

Abstract
Tyrosine kinase inhibitors (TKIs), despite efficacy as anti-cancer therapeutics, are associated with cardiovascular side effects ranging from induced arrhythmias to heart failure. We used patient-specific human induced pluripotent stem cell-derived cardiomyocytes (hiPSC-CMs), generated from 11 healthy individuals and 2 patients receiving cancer treatment, to screen FDA-approved TKIs for cardiotoxicities by measuring alterations in cardiomyocyte viability, contractility, electrophysiology, calcium handling, and signaling. With these data, we generated a “cardiac safety index” to assess cardiotoxicities of existing TKIs. TKIs with low cardiac safety indices exhibit cardiotoxicity in patients. We also derived endothelial cells (hiPSC-ECs) and cardiac fibroblasts (hiPSC-CFs) to examine cell type-specific cardiotoxicities. Using high-throughput screening, we determined that VEGFR2/PDGFR-inhibiting TKIs caused cardiotoxicity in hiPSC-CMs, hiPSC-ECs, and hiPSC-CFs. Using phosphoprotein analysis, we determined that VEGFR2/PDGFR-inhibiting TKIs led to a compensatory increase in cardioprotective insulin and insulin-like growth factor (IGF) signaling in hiPSC-CMs. Upregulating cardioprotective signaling with exogenous insulin or IGF1 improved hiPSC-CM viability during co-treatment with cardiotoxic VEGFR2/PDGFR-inhibiting TKIs. Thus, hiPSC-CMs can be used to screen for cardiovascular toxicities associated with anti-cancer TKIs, correlating with clinical phenotypes. This approach provides unexpected insights, as illustrated by our finding that toxicity can be alleviated via cardioprotective insulin/IGF signaling.
INTRODUCTION
Small molecule tyrosine kinase inhibitors (TKIs) have dramatically improved life expectancy for cancer patients (1). Since the FDA approval of imatinib for treating chronic myeloid leukemia, dozens of TKIs have been developed. TKIs inhibit the phosphorylation activity of hyperactive receptor tyrosine kinases (RTK) in cancer cells, stymying the enhanced cell survival, proliferation, and migration associated with cancer progression. However, some TKIs are linked to severe cardiotoxicities including heart failure, reduced left ventricular ejection fraction, myocardial infarction, or arrhythmias (2, 3). Given these life-threatening complications, new approaches are needed to assess for chemotherapeutic cardiotoxicity.
Pre-clinical platforms for evaluating drug cardiotoxicity use animal models, which inaccurately predict human cardiac pathophysiology due to interspecies differences in cardiac structure, electrophysiology, and genetics (4). In vitro drug cardiotoxicity assessments also employ non-human cells transfected with the human ether-à-go-go-related gene (hERG), encoding a cardiac potassium channel, to evaluate drug-induced alterations in cardiac electrophysiology (5). Primary human cardiomyocytes, ideal for assessing drug cardiotoxicities, are difficult to procure and maintain (6). Because primary human cardiomyocytes are terminally-differentiated, it remains impossible to obtain sufficient quantities for cardiotoxicity screening. However, advances in human induced pluripotent stem cells (hiPSCs) provide an alternative (7). Human cardiomyocytes can be mass-produced from hiPSCs using chemically-defined differentiation (8). Patient-specific hiPSC-derived cardiomyocytes (hiPSC-CMs) can recapitulate cardiovascular disease phenotypes for dilated cardiomyopathy, hypertrophic cardiomyopathy, left-ventricular non-compaction, long QT syndrome, viral cardiomyopathy, and others (9–14).
Here, we utilized patient-specific hiPSC-CMs, hiPSC-derived endothelial cells (hiPSC-ECs), and hiPSC-derived cardiac fibroblasts (hiPSC-CFs) from eleven healthy individuals and two cancer patients receiving TKIs to evaluate the cardiotoxicities of 21 FDA-approved TKIs. We also employed cytotoxicity and high-throughput cell contractility assessments to establish a TKI “cardiac safety index”.
RESULTS
Expression of Cardiomyocyte Markers and Receptor Tyrosine Kinases in hiPSC-CMs
Eleven hiPSC lines were produced from the somatic tissues of eleven healthy individuals by cellular reprogramming with lentivirus or Sendai virus-based vectors expressing transcription factors OCT4, SOX2, KLF4, and MYC. These individuals were a diverse group of male and females of different ages. Two additional hiPSC lines were created from two individuals receiving TKIs for cancer treatment (Fig. S1A). All hiPSC lines expressed pluripotency markers (Fig. S1B). hiPSC-CMs were produced using a chemically-defined differentiation protocol (Fig. 1A). The hiPSC-CMs expressed standard cardiomyocyte markers (Fig. 1B) (8). Cardiomyocytes exhibited spontaneous beating and were purified for downstream assays (Movie S1). Five healthy control hiPSC-CM lines were chosen for RTK expression analysis and exhibited near-identical RTK expression (Fig. 1C). KDR encoding VEGFR2, PDGFRΑ encoding PDGFRα, INSR encoding insulin receptor, and IGF1R encoding IGF1 receptor were highly expressed.
Fig. 1. hiPSC-CMs exhibit sarcomeric proteins and express human receptor tyrosine kinase families.

(A) Diagram of study workflow. Somatic tissue samples were obtained from 13 individuals and reprogrammed into hiPSC colonies with either Sendai virus or lentivirus vectors expressing transcription factors OCT4, SOX2, KLF4, and MYC (OKSM). hiPSCs were differentiated into hiPSC-CMs, hiPSC-ECs, and hiPSC-CFs. Purified cardiomyocytes were treated with TKIs and examined for alterations in cell viability, contractility, cellular signaling, and gene expression. (B) Confocal microscopic immunofluorescence images of differentiated hiPSC-CMs expressing sarcomeric markers cardiac troponin T (TNNT2) and α-actinin (ACTN2). (C) Day 30 hiPSC-CMs from 5 healthy control lines expressing major RTKs including INSR, IGF1R, PDGFRA, and KDR. High TNNT2 and low PECAM1 expression indicates a pure hiPSC-CM population devoid of endothelial cells. N=3 biological replicates conducted for gene expression analysis in each hiPSC-CM line. Data expressed as means ± SEM.
High-throughput Analysis of TKI-Induced Cytotoxicity and Contractility in hiPSC-CMs
Twenty-one small molecule TKIs were utilized for a high-throughput cardiotoxicity screen in hiPSC-CMs (Table S1). Many TKIs inhibit multiple RTK families and induce cardiotoxicities including left ventricular dysfunction, myocardial infarction, or arrhythmias. However, the net benefit with respect to cancer treatment outweighs these risks, and these drugs are frequently prescribed at major cancer treatment centers (Table S2). The highly cardiotoxic anthracycline, doxorubicin, was included as a positive control for toxicity. Using the PrestoBlue cell viability assay, we found that VEGFR2/PDGFR-inhibiting TKIs sorafenib, regorafenib, and ponatinib induced the most cell death in hiPSC-CMs, with LD50 of 3.4 μM, 7.1 μM, and 4.3 μM, respectively (Fig. 2A). Doxorubicin was extremely cytotoxic to hiPSC-CMs at LD50 of 0.78 μM. TKIs not strongly associated with cytotoxicity, such as imatinib or erlotinib, had LD50 of 78.20 μM and 87.60 μM, respectively. Sorafenib, regorafenib, and ponatinib were highly cytotoxic in all eleven healthy control hiPSC-CM lines, demonstrated via quantitative and qualitative viability assays. (Fig. S2A–2C; Fig. S3). We also performed cytotoxicity assays in hiPSC-CMs and hiPSC-ECs derived from two individuals with kidney cancer (Fig. S4). These individuals received two TKIs each: sunitinib as first-line treatment and axitinib as second-line treatment. These patients experienced no significant clinical cardiotoxicity from either agent. As expected, we did not observe a significant difference in cytotoxicity between TKI-receiving patient hiPSC-CMs and healthy control hiPSC-CM lines after subjecting them to sunitinib or axitinib.
Fig. 2. High-throughput analysis of TKI toxicity in purified hiPSC-CMs allows for the development of a TKI cardiac safety index.

(A) Dose response curves quantifying cytotoxicity after 72 hour TKI treatment of 5 healthy control hiPSC-CM lines using a PrestoBlue viability assay. N=5 biological replicates conducted per line. Data presented as mean ± SEM. (B) Evaluation of hiPSC-CM contractility after 72 hour TKI treatment with IC200 Kinetic Imaging Cytometer. Average results from triplicate wells shown at each concentration. Red indicates decreased contraction rate, whereas green indicates increased contraction rate. (C) Values gathered from cytotoxicity and contractility analyses in hiPSC-CMs. Green shading indicates values associated with less cardiotoxicity. Red shading indicates values associated with higher cardiotoxicity. Cessation of beating is the concentration at which >50% of triplicate wells ceased beating. Effective concentration is the concentration at which a significant alteration in all listed contractility parameters was detected (see Fig. S7, see Materials and Methods for details). Amplitude of effect is the degree to which all listed contractility parameters were altered at the effective concentration (see Materials and Methods for details). LD50 is the TKI concentration at which 50% loss in viability is observed from viability assays, averaged across patient hiPSC-CM lines. Patient Cmax represents the maximum TKI blood plasma concentration experienced by patients reported in FDA literature. The cardiac safety index is a value from 0–1 that normalizes contractility and viability parameters to patient Cmax and combines these parameters to provide a relative metric for TKI cardiotoxicity. Highlighted drugs (surrounded by a red rectangle) have a safety index at or below 0.10, our threshold for highly cardiotoxic compounds. Clinically-reported cardiotoxicities are alterations in patient cardiac function (see Table S1). QT, QT interval prolongation; Hy, hypertension; LV, left ventricular ejection fraction decrease; HF, heart failure; MI, myocardial infarction; TdP, Torsades de pointes; SCD, sudden cardiac death; Brady, bradycardia; PE, pericardial effusion; Vas, vascular abnormalities; Afib, atrial fibrillation; **-cardiovascular toxicity-associated boxed warning; #-non-cardiovascular toxicity-associated boxed warning.
To avoid lab-to-lab biases and variations in hiPSC-CM quality, we performed contractility assessment in CMs derived from commercially-available, healthy control hiPSCs. We observed alterations in hiPSC-CM beating rate and other parameters at doses lower than LD50 cytotoxicity values after treatment with TKIs such as nilotinib and vandetanib, suggesting that irregular beating arises before cardiomyocyte death (Fig. 2B, Fig. S5). We also determined hiPSC-CM contractility parameters altered after increasing TKI concentration, effective drug concentrations at which contractility alterations initially appeared, and TKI concentrations at which hiPSC-CM contraction ceased (Fig. 2C, Fig. S6, Fig S7). To accurately assess TKI toxicity, we investigated whether toxic TKI concentrations observed in cytotoxicity and contractility assays matched doses that patients experience. We obtained patient Cmax values from FDA literature, providing an estimate of TKI blood plasma concentrations in patients (Fig. 2C). By normalizing our in vitro cessation of beating, effective concentration, and LD50 cytotoxicity data to literature-reported Cmax values, we developed a “cardiac safety index”, a metric identifying clinically-cardiotoxic TKIs (Fig. 2C, Fig. S7).
Three of seven compounds with cardiac safety indices at or below 0.10 (doxorubicin, nilotinib, and vandetanib) were previously labeled with FDA black box cardiotoxicity warnings. A safety index value of 0.10 was chosen as our threshold for highly cardiotoxic drugs as it marked a separation in the safety index between clinically cardiotoxic, black-boxed drugs (doxorubicin, nilotinib, and vandetanib) and other compounds not commonly associated with cardiotoxicity. Nilotinib and vandetanib, two black-boxed TKIs causing QT interval prolongation and arrhythmias, were selected for further analysis. Three TKIs with safety indices under 0.10 were VEGFR2/PDGFR-inhibiting TKIs (regorafenib, sorafenib, and vandetanib). Regorafenib and sorafenib had safety indices comparable to the cardiotoxic anthracycline doxorubicin. These results demonstrate that VEGFR2/PDGFR-inhibiting TKIs can induce cardiotoxicities in hiPSC-CMs at clinically-relevant concentrations comparable to doses that patients experience. Clinically, VEGFR2/PDGFR-inhibiting TKIs cause various cardiovascular toxicities including hypertension, heart failure, and QT prolongation (15).
Confirmation of Toxicity for Known QT Interval-Prolonging TKIs Nilotinib and Vandetanib in hiPSC-CMs
QT interval prolongation remains a major concern during drug development (16). Because nilotinib and vandetanib cause dangerous QT interval prolongation and arrhythmias clinically, we conducted additional contractility, calcium imaging, and electrophysiological analyses in 4 healthy control hiPSC-CM lines treated with nilotinib or vandetanib (Fig. S8). DMSO and axitinib, not associated with contractility abnormalities at clinically-relevant doses prescribed to patients (per clinical literature and our previous data), were negative controls for toxicity. We observed a prolongation in cardiomyocyte contraction time following nilotinib or vandetanib treatment at clinically-relevant concentrations as low as 3.7 μM (Fig. S8). Neither DMSO nor axitinib elicited contraction irregularities at clinically-relevant concentrations.
We also conducted calcium imaging of hiPSC-CMs to examine alterations in intracellular calcium handling following 2 hour nilotinib or vandetanib treatment (Fig. 3A). At clinically-relevant concentrations (Fig. 2C and Table S1), nilotinib and vandetanib prolonged calcium transient duration and decreased beat rate in hiPSC-CMs (Fig. 3B, 3C). The electrophysiologically “safe” drugs (DMSO control, imatinib, and axitinib) did not significantly alter parameters such as calcium transient amplitude, transient duration, or beating rate (Fig. 3C). Additionally, nilotinib and vandetanib altered cardiomyocyte electrophysiology (Fig. 4). We subjected hiPSC-CMs to an acute TKI treatment up to 10 minutes or a two-hour treatment and recorded cellular electrophysiology using patch clamping (Fig. 4A). With acute treatment, TKIs at clinically-relevant concentrations did not alter action potential duration (Fig. 4B). However, after two hours, QT-prolonging TKIs nilotinib and vandetanib significantly prolonged action potential duration and decreased cellular beating rate (Figure 4C, 4D). Drugs not known to alter cardiac electrophysiology, such as DMSO, imatinib, and axitinib, did not alter action potential duration. These results demonstrate that detrimental arrhythmogenic effects of known QT interval-prolonging TKIs such as nilotinib and vandetanib can be recapitulated in hiPSC-CMs as assessed by contractility assays, calcium imaging, and patch clamp electrophysiology.
Fig. 3. hiPSC-CMs exhibit alterations in intracellular calcium handling after 2 hour treatment with known QT interval-prolonging TKIs.

(A) Schematic illustrating TKI treatment regimen for hiPSC-CMs before calcium imaging. (B) Raw line scans of individual hiPSC-CM calcium transients following TKI treatment at indicated clinically-relevant concentration and calcium dye treatment over multiple beats. (C) Quantification of hiPSC-CM calcium imaging parameters following 2 hour TKI treatment. N=10 cells recorded for each condition. Data presented as box-and-whisker plots showing the minimum, first quartile, median, mean, third quartile, and maximum of dataset. Student’s t-test indicates significance compared to control (*P<0.05 and **P<0.01).
Fig. 4. hiPSC-CMs exhibit alterations in cellular electrophysiology after 2 hour treatment with known QT interval-prolonging TKIs.

(A) Schematic illustrating setup for acute and 2 hour TKI treatment before action potential recording. (B) Representative action potential tracings following acute TKI treatment for up to 10 min at clinically-relevant concentrations in hiPSC-CMs. (C) Representative action potential tracings following 2 hour TKI treatment at clinically-relevant concentrations in hiPSC-CMs. (D) Quantification of hiPSC-CM electrophysiological parameters following 2 hour TKI treatment. Data expressed as means ± SEM. Statistical significance indicated by *P<0.05 compared to DMSO via Student’s t-test. N=10 cells recorded for each condition.
Analysis of TKI Cardiotoxicity in hiPSC-ECs and hiPSC-CFs
We next derived endothelial cells (hiPSC-ECs) and cardiac fibroblasts (hiPSC-CFs) from hiPSCs to determine cell type-specific differences in cardiotoxicity. Human iPSC-ECs were produced with a chemically-defined differentiation protocol utilizing small molecule Wnt signaling modulators, FGF and VEGF stimulation, and magnetic-activated cell sorting of CD31+/CD144+ populations (Fig. S9A). These hiPSC-ECs exhibited standard EC morphologies, markers, and functionality (Fig. S9B–S9D). Similar to hiPSC-CMs, sorafenib, regorafenib, and ponatinib were the most cytotoxic TKIs in hiPSC-ECs (Fig. S9E). We also developed a custom hiPSC-CF differentiation protocol employing small molecule Wnt signaling modulation, FGF2 and VEGFA stimulation, and negative sorting for endothelial populations (Fig. S10A). These hiPSC-CFs were negative for cardiomyocyte markers, expressed mesenchymal and myofibroblast markers, and were morphologically similar to primary cardiac fibroblasts (Fig. S10B–S10E). These hiPSC-CFs exhibited TKI cytotoxicity profiles similar to hiPSC-CMs and hiPSC-ECs, with sorafenib, regorafenib, and ponatinib eliciting the highest cytotoxicities (Fig. S10F). We next treated undifferentiated hiPSCs with our TKI panel to determine whether non-cardiovascular cell types exhibit similar toxicities to hiPSC-CMs, hiPSC-ECs, and hiPSC-CFs (Fig. S11). hiPSCs exhibited a unique TKI cytotoxicity profile, showing enhanced toxicity by VEGFR2/PDGFR dual inhibitors in comparison to cardiovascular derivatives (hiPSC-CMs, ECs, and CFs). For example, axitinib, the least cytotoxic TKI in hiPSC-CMs, was extremely toxic to hiPSCs. Doxorubicin toxicity was also substantially enhanced in hiPSCs compared to cardiovascular cell types. These results suggest that VEGFR2/PDGFR-inhibiting TKIs sorafenib, regorafenib, and ponatinib exhibit cell type-specific cytotoxicites varying between cardiovascular and non-cardiovascular cell types.
Evaluation of Receptor Tyrosine Kinase Phosphorylation Status in hiPSC-CMs after TKI Treatment
To elucidate TKI-induced signaling alterations, we utilized a receptor tyrosine kinase proteome profiler to assess RTK phosphorylation after treatment with VEGFR2/PDGFR-inhibiting TKIs (Fig. 5, Fig. S12). Drugs were added to hiPSC-CMs at sub-cytotoxic concentrations. We observed a dose-dependent decline in VEGFR2 and PDGFRα phosphorylation after VEGFR2/PDGFR-inhibiting TKI treatment, with axitinib eliciting the strongest dual-inhibition, suggesting that these TKIs can inhibit functionally-relevant signaling pathways in hiPSC-CMs. ErbB2, ErbB4, and EGFR2 phosphorylation remained constant over increasing TKI concentrations. Cabozantinib, a known Axl inhibitor, decreased Axl phosphorylation. Notably, we observed increased INSR and IGF1R phosphorylation after treatment with ponatinib and axitinib, suggesting a compensatory augmentation in IGF/insulin signaling during VEGFR2/PDGFR inhibition.
Fig. 5. Treatment with VEGFR2/PDGFR-inhibiting TKIs causes dose-dependent alterations in receptor tyrosine kinase signaling in hiPSC-CMs.

Normalized quantification of RTK phosphorylation in purified hiPSC-CMs treated with 0–1 μM of VEGFR2/PDGFR-inhibiting TKIs sorafenib, cabozantinib, ponatinib, axitinib, regorafenib, or sunitinib for 72 hours. Phosphorylation array blots are shown in Fig. S12. N=3 biological replicates conducted. Data expressed as means ± SEM.
Evaluation of Insulin and IGF1-Mediated Compensatory Cardioprotection during TKI Treatment
Treatment with insulin or IGF1 can enhance cardiac function during adverse events (17, 18). Given that insulin/IGF signaling was upregulated after treatment with VEGFR2/PDGFR-inhibiting TKIs, we hypothesized that this compensatory upregulation may protect hiPSC-CMs from TKI toxicity. To determine whether exogenous insulin or IGF1 could enhance cardioprotective signaling in hiPSC-CMs, we utilized a high-throughput kinase phosphorylation array (Fig. 6A, Fig. S13). We observed that both IGF1 and insulin enhanced phosphorylation of the anti-apoptotic Akt protein network. We confirmed enhanced cell survival when hiPSC-CMs exposed to ponatinib were concurrently treated with IGF1 or insulin (Fig. 6B). This observation was confirmed quantitatively with CellTiter-Glo viability assays (Fig. 6C). Additionally, we observed that IGF1 and insulin treatment rescued hiPSC-CMs from doxorubicin cytotoxicity (Fig. S14). To confirm that the effect of insulin/IGF1 was because of enhanced cardiomyocyte survival rather than proliferation, we quantitatively assessed cell number at early timepoints after TKI treatment. We observed an increase in viability at merely 12 hours after TKI treatment, confirming that insulin/IGF augment cardiomyocyte survival (Fig. S15). We next evaluated the gene expression response in hiPSC-CMs during treatment with VEGFR2/PDGFR-inhibiting TKIs sorafenib, regorafenib, and ponatinib and observed an increase in growth factor receptor gene expression (Fig. 7). NRP2, encoding for the non-canonical VEGF receptor neuropilin 2, was upregulated in our microarray. We subsequently conducted RNA-sequencing analysis of 5 healthy control hiPSC-CM lines treated with 1 μM VEGFR2/PDGFR-inhibiting TKI sorafenib for 72 hours and observed increased expression of KDR, encoding for VEGFR2 receptor, and VEGFC, encoding for VEGFC ligand (Fig. S16). These gene expression analyses suggest that non-canonical VEGF-binding receptors and VEGF signaling pathway members are upregulated to compensate for losing canonical VEGFR signaling after treatment with VEGFR2/PDGFR-inhibiting TKIs. A summary of the compensatory cardioprotective signaling model is shown in Fig. 8. Altogether, our data suggest that VEGFR2/PDGFR-inhibiting TKIs elicit a compensatory increase in cardioprotective insulin/IGF1 signaling (phosphorylation) in hiPSC-CMs. This cardioprotective signaling can be harnessed with exogenous insulin/IGF1 ligands to enhance cardiomyocyte survival. Simultaneously, VEGFR2/PDGFR-inhibiting TKIs increase the downstream gene expression of VEGF pathway members to compensate for an upstream loss in VEGF signal transduction.
Fig. 6. Insulin and IGF1 activate cardioprotective signaling pathways and alleviate cytotoxicity in hiPSC-CMs.

(A) Phosphorylation arrays demonstrating alterations in hiPSC-CM kinase activity after 12 hour IGF1 or insulin treatment. N=3 biological replicate phosphorylation arrays conducted. Data expressed as means ± SEM. Significant differences defined by *P<0.05 calculated by Student’s t-test. We observed a significant increase in phosphorylation of the following protein amino acid residues after IGF1 treatment (P value listed): Akt1/2/3-S473 (0.01), Akt1/2/3-T308 (0.04), GSK3α/β-S21/S9 (0.03), p53-S15 (0.002), p53-S392 (0.02), p53-S46 (0.003), PRAS40-T246 (0.001), TOR-S2448 (0.0001), WNK1-T60 (0.002). We observed a significant increase in phosphorylation of the following protein amino acid residues after insulin treatment (P value listed): Akt1/2/3-S473 (0.01), Akt1/2/3-T308 (0.04), GSK3-α/β-S21/S9 (0.005), p53-S46 (0.04), PRAS40-T246 (0.007), TOR-S2448 (0.01), WNK1-T60 (0.006). (B) Immunofluorescence of hiPSC-CMs treated with sorafenib, regorafenib, or ponatinib at increasing concentrations for 72 hours in the presence of IGF1 or insulin. Calcein-AM stains viable cells. (C) CellTiter-Glo quantification of hiPSC-CM viability with or without IGF1/insulin co-treatment during TKI treatment. N=5 biological replicates conducted. IGF and insulin treatment significantly rescued ponatinib toxicity (P=0.004). Data expressed as means ± SEM.
Fig. 7. Treatment with sorafenib, regorafenib, or ponatinib leads to hyperactivation of compensatory signaling through non-canonical VEGF receptors.

(A) Microarray heat map illustrating differentially-expressed genes after 72 hour sorafenib, regorafenib, and ponatinib treatment in hiPSC-CMs. Cells were treated with 1 μM TKI to avoid cytotoxicity at higher doses. Red indicates high gene expression, and blue indicates low gene expression. (B) Graph represents fold expression change (compared to control) of significantly-altered genes after drug treatment. Significantly-altered genes defined by P<0.05 compared to untreated control. Multiple P-value comparisons made using a one-way between-subject ANOVA.
Fig. 8. Model for the activation of compensatory survival signaling in hiPSC-CMs in response to treatment with VEGFR2/PDGFR-inhibiting TKIs.
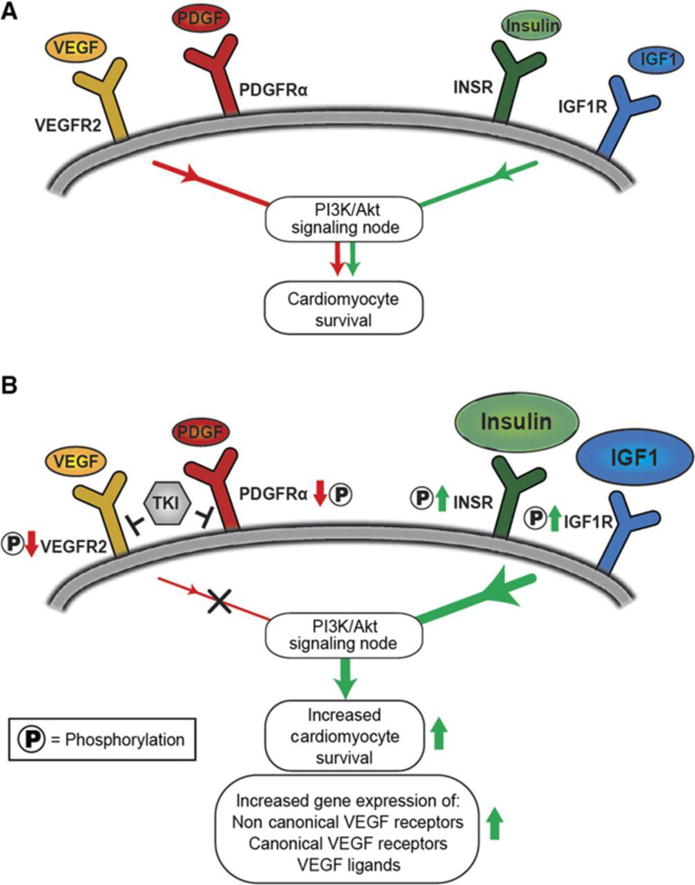
(A) In hiPSC-CMs, receptor tyrosine kinases VEGFR2, PDGFRα, INSR, and IGF1R are upstream of pro-survival signaling pathways. (B) Our results suggest that VEGFR2/PDGFR-inhibiting TKIs upregulate INSR and IGF1R signaling (phosphorylation) to compensate for the loss of VEGFR/PDGFR signaling (phosphorylation). This compensatory effect can augment cardiomyocyte survival during TKI treatment via introduction of exogenous insulin and IGF1 ligands. We observed an increase in the downstream gene expression of non-canonical VEGF-binding receptors and VEGFR pathway members, presumably to compensate for VEGFR2/PDGFR-inhibiting TKI-induced loss in upstream VEGFR signaling (phosphorylation).
DISCUSSION
Tyrosine kinase inhibitors are a major class of cancer therapeutics, with revenues from these drugs annually reaching billions of dollars (19). However, many TKIs, like other chemotherapeutics, exhibit substantial cardiotoxicities (3). Our results demonstrate that hiPSC-CMs can assess TKI cardiotoxicity in a high-throughput fashion. We evaluated 21 FDA-approved TKIs using hiPSC-CMs derived from eleven healthy individuals and two patients receiving TKIs as cancer therapy. From the data obtained, we developed a “cardiac safety index” integrating TKI-induced cytotoxicity measurements, contractility assessments, and literature-reported TKI blood plasma concentrations in patients. We also validated the negative effects of known cardiotoxic TKIs.
Previous studies evaluated TKI cardiotoxicity using animals and other in vitro models (20). Sorafenib, one of the three most cytotoxic TKIs in our study, induces cardiomyocyte death and contractility defects in the zebrafish heart and causes ventricular dysfunction and heart failure clinically (Table S2) (20). Ponatinib, withdrawn briefly for adverse vascular events, was reported to induce mitochondrial stress and elicit contraction abnormalities in hiPSC-CMs, corroborating our results (21, 22). Although regorafenib has a black-box warning for liver toxicity, our study demonstrates that regorafenib can induce cardiotoxicity at clinically-relevant doses similar to other VEGFR2/PDGFR-inhibiting TKIs (23). This is reasonable because sorafenib and regorafenib, also known as fluoro-sorafenib, have similar molecular structures (24).
The seven drugs with cardiac safety indices at or below 0.10, our threshold for highly cardiotoxic compounds, cause clinical cardiotoxicities including heart failure, ventricular dysfunction, myocardial infarction, or arrhythmias (Table S2). Six out of these seven drugs are widely prescribed at major cancer treatment centers at greater than 10,000 doses annually (Table S2). Three out of the seven compounds with safety indices at or below 0.10 (doxorubicin, vandetanib, and nilotinib) have cardiotoxicity-associated FDA black-box warnings, lending validity to our cardiac safety index. We also confirmed the clinical arrhythmia-inducing potential of nilotinib and vandetanib by contractility assay, patch clamp electrophysiology, and calcium imaging in hiPSC-CMs.
Three out of the four TKIs with the lowest safety indices (sorafenib, regorafenib, and vandetanib) were VEGFR2/PDGFR-inhibiting TKIs, piquing our interest in further studying this class of drugs. Clinically, these TKIs cause cardiovascular toxicities including hypertension, heart failure, and QT prolongation (15). VEGFR2/PDGFR-inhibiting TKIs sorafenib, regorafenib, and ponatinib induced the highest levels of cytotoxicity in hiPSC-ECs, hiPSC-CFs, and hiPSC-CMs alike. The high hiPSC-EC toxicity we observed with VEGFR2/PDGFR-inhibiting TKIs such as ponatinib corroborates with vascular toxicity observed clinically with these TKIs (1). The cytotoxicity profile for undifferentiated hiPSCs was substantially different from hiPSC-derived cardiovascular derivatives. For example, the VEGFR2/PDGFR inhibitor axitinib was the least cytotoxic TKI in hiPSC-CMs. However, it was extremely toxic to hiPSCs, perhaps because hiPSCs are highly sensitive to alterations to RTK signaling due to their pluripotent state. Doxorubicin was lethal to hiPSCs even at 0.1 μM, likely because it is a highly-effective DNA intercalating agent for killing hyperproliferative cell types such as cancer cells and hiPSCs. The hiPSC-CMs also expressed the major RTK kinase families targeted by TKIs in our panel (INSR, IGF1R, PDGFRα, and VEGFR2), lending validity to our model. However, we did not observe a patient-specific difference in TKI-induced cardiotoxicity between the 11 hiPSC-CM lines made from healthy individuals and the 2 made from TKI-treated patients. This is expected as neither of the individuals receiving TKI treatment developed severe clinical cardiotoxicity due to TKI treatment. Therefore, we would not expect a difference in the cardiac safety index for hiPSC-CMs derived from different individuals, unless a subset of individuals has a genetic predisposition to TKI-induced cardiotoxicity that could be recapitulated in vitro.
The VEGF and PDGFR signaling pathways are critical regulators of cardiovascular development. VEGF regulates endothelial cell function along with promoting cardiomyocyte survival (25, 26). Although nanomolar concentrations of sorafenib, regorafenib, and ponatinib caused complete VEGFR2/PDGFR inhibition, cytotoxicity was observed at micromolar concentrations, suggesting that VEGFR2/PDGFR inhibition may not directly cause hiPSC-CM cytotoxicity. However, VEGFR2/PDGFR inhibition may provide a secondary benefit to hiPSC-CMs. VEGFR2/PDGFR-inhibiting TKIs such as ponatinib and axitinib led to compensatory hyperactivation of cardioprotective insulin/IGF1 signaling. Axitinib, the strongest inhibitor of VEGFR2 and PDGFRα phosphorylation per our kinase assays, induced the strongest compensatory effect along with ponatinib, enhancing INSR/IGF1R phosphorylation two-fold. This TKI-induced compensatory effect is fortuitous because insulin and IGF1 are cardioprotective during adverse cardiac events (17, 18). Although VEGFR2/PDGFR-inhibiting TKIs may cause cardiomyocyte cytotoxicity, they may “prime” hiPSC-CMs for stimulation with pro-survival factors.
We harnessed this compensatory effect to enhance hiPSC-CM survival during VEGFR2/PDGFR-inhibiting TKI treatment with either insulin or IGF1, augmenting anti-apoptotic Akt signaling. We observed a cardioprotective effect with insulin and IGF1 during ponatinib treatment, but not with sorafenib or regorafenib. This may be because, per our RTK phosphorylation arrays, ponatinib elicited the strongest compensatory increase in INSR/IGF1R phosphorylation among these three TKIs. We also observed reduced doxorubicin cytotoxicity after IGF1 and insulin pretreatment, suggesting that these growth factors might alleviate anthracycline cardiotoxicity in cardiomyocytes, corroborating other studies (27). Phosphorylation of RTKs such as ErbB2, ErbB4, EGFR2, and Axl was not significantly altered by VEGFR2/PDGFR-inhibiting TKIs, except by the known Axl inhibitor cabozantinib. Because insulin and IGF1 also induce cell cycle activity, we investigated whether they enhance hiPSC-CM proliferation instead of survival (28). To test for a pro-survival effect, we substantially shortened the TKI treatment but still observed an increase in hiPSC-CM viability after IGF1/insulin pretreatment. To further safeguard against confounding effects of insulin/IGF1-induced proliferation, we utilized day 30 post-differentiation hiPSC-CMs, which exhibit lower mitotic activity than younger cells (28). Finally, we conducted gene expression analysis to elucidate gene networks altered by TKI treatment. VEGFR2/PDGFR-inhibiting TKIs sorafenib, regorafenib, and ponatinib induced a two-fold increase in the expression of neuropilin 2, a non-canonical VEGF receptor (29). Thus, hiPSC-CMs may compensate for VEGFR2 signaling loss by upregulating auxiliary and canonical VEGF receptor expression, thus facilitating VEGF signaling in the absence of VEGFR2 kinase activity. Indeed, RNA-seq analysis revealed an upregulation of KDR (VEGFR2 receptor), as well as an upregulation in the expression of VEGF ligands. This suggests that in hiPSC-CMs, the upstream blockade of the phosphorylation cascade by VEGFR2/PDGFR-inhibiting TKIs causes a downstream increase in the gene expression of VEGF pathway members, potentially to compensate for the loss of upstream VEGFR signaling (Fig. 8).
In summary, we utilized hiPSC-CMs, hiPSC-ECs and hiPSC-CFs to screen for the cardiotoxicity of 21 FDA-approved TKIs and established a “cardiac safety index” for TKI toxicity. We also validated the known cardiotoxicities of FDA black-boxed TKIs in our hiPSC-CM platform. Although TKIs target various RTK families, we observed that VEGFR2/PDGFR-inhibiting TKIs exhibited high cardiotoxicity on multiple cardiovascular cell types. These cardiotoxicities could be rescued by co-opting compensatory pro-survival insulin/IGF1 signaling pathways. There is substantial interest in deriving hiPSCs from a broader cohort of individuals to establish a population level, prospective, preclinical toxicity assessment to better inform drug development. As presented here, a combination of electrophysiological, functional, and genetic assays and continued advances in hiPSC biology will enable the development of efficient high-throughput platforms for preemptively screening potential chemotherapeutic compounds for cardiotoxicities.
MATERIALS AND METHODS
Additional information available in the Supplementary Materials.
Study design
To investigate the cardiotoxicity of FDA-approved TKIs in hiPSC-CMs, 11 healthy individuals and two individuals receiving TKIs for cancer therapy were recruited and consented. Either skin punch biopsies or blood draws were performed to obtain primary tissue samples for hiPSC production. Reprogramming of either skin fibroblasts or peripheral blood mononuclear cells to hiPSCs was conducted according to previously-published protocols (8, 30). A minimum of N=3 biological replicates were conducted for each experiment, with details in figure legends.
Chemically-defined differentiation of hiPSC-CMs
The hiPSCs were differentiated into hiPSC-CMs using a chemically-defined protocol and maintained in media supplemented with human albumin and ascorbic acid (8). This cardiomyocyte maintenance media was devoid of growth factors such as insulin and IGF1. Differentiated cells were glucose-starved and supplemented with 5 mM sodium DL-lactate to metabolically select hiPSC-CMs (31). When replating, hiPSC-CMs were dissociated with TrypLE Express (Life Technologies) and reseeded on Matrigel-coated plates.
Tyrosine kinase inhibitor stocks and cardioprotective growth factor treatments
TKI stocks (LC Laboratories) were resuspended in DMSO at 10 mM and stored at −80°C. Insulin (Life Technologies) was stored at −20°C and Long-R3 IGF1 (Sigma-Aldrich) was stored at 4°C. For cell viability rescue experiments, day 30–35 post-differentiation hiPSC-CMs were pretreated with insulin or IGF1 for 12 hours before TKI treatment, when insulin or IGF1 was re-supplemented.
High-throughput imaging and quantitative viability assays
Day 30–35 post-differentiation hiPSC-CMs were plated on Matrigel at 25,000 cells/well of a 384-well plate (Greiner Bio-One). Cells were treated with TKIs at 0–100 μM for 72 hours unless otherwise specified. Immunostaining qualitatively assessed cell viability per previous protocols (8). For quantitative viability measurements, cells were treated with CellTiter-Glo Viability Assay (Promega), CCK8 (Dojindo), or PrestoBlue reagent (Life Technologies) per manufacturer-recommended procedures. High-throughput imaging and viability assays were conducted using a Cytation 5 plate reader/imager (BioTek Instruments). Prism (GraphPad) was utilized for curve fitting, LD50 calculations, and statistical analysis.
High-throughput hiPSC-CM contractility assessment
After 72 hour TKI treatment, hiPSC-CMs were washed with Tyrode’s solution. Imaging dye was prepared by diluting Hoechst 33258 (Life Technologies, H3569) to 4 μg/mL and wheat germ agglutinin Alexa-Fluor 488 conjugate (Life Technologies, W11261) to 5 μg/mL in Tyrode’s solution. Solution was added to hiPSC-CMs and incubated at 37°C and 5% CO2 for 15 minutes. After rewashing with Tyrode’s solution, hiPSC-CMs were incubated for 15 minutes pre-imaging. The IC200 Kinetic Imaging Cytometer (Vala Sciences) recorded a 6.5 second time series of contracting hiPSC-CMs at 100 Hz at 20× magnification per well of a 384-well plate.
Safety coefficients based on contractility parameters
Safety coefficients presented in this paper are computed as follows. Cessation of beating (CoB) is the concentration at which >50% of triplicate wells ceased beating. Effective concentration for the i-th metric (ECi) is a concentration that presents a statistically-significant contractility difference (P<0.05) from baseline. “Amplitude of the effect (AEi) quantifies the magnitude of such departures from baseline as the log2 of the ratio of the metric value EVi at concentration ECi, hereinafter referred to as effective value (EVi), to the value of the metric BVi at baseline concentration.” Additionally, i = 1…M, M is the number of metrics obtained from the contractility analysis (M = 9 in this paper: Tpeak, Trise, Tfall, Total Contraction Time, Dpeak, Dvalley, Dp2v, Contraction Rate, and Relaxation Rate).
Average Amplitude of Effect (AE) is obtained by averaging the different AEi’s.
Average Effective Concentration (EC) is a weighted average of the different effective concentrations using each respective amplitude of effect as weight.
The rationale for this EC expression is that it considers all different ECs and introduces a bias towards those ECs corresponding to metrics that most prominently alter normal cell behavior.
Calcium imaging
Day 30–40 post-differentiation hiPSC-CMs were reseeded in Matrigel-coated 8-well Lab Tek II chambers (Nalge Nuc International) and were treated with TKIs for 2 hours. Cells were treated with 5 μM Fluo-4 AM and 0.02% Pluronic F-127 (Molecular Probes) in Tyrode’s solution for 15 minutes at 37°C and washed with Tyrode’s solution afterwards. Ca2+ imaging was conducted using a Zeiss LSM 510Meta confocal microscope (Carl Zeiss AG) and analyzed using Zen software. Spontaneous Ca2+ transients were obtained at 37°C using a single-cell line scan mode.
Electrophysiology
Whole-cell action potentials (APs) were recorded with patch-clamp technique, as previously-described (8). Cultured hiPSC-CMs were dissociated using TrypLE and plated as single cells on glass cover slips coated with Matrigel. Cells were placed in a RC-26C recording chamber (Warner) and mounted onto an inverted microscope (Nikon). The chamber was continuously perfused with warm (35–37°C) extracellular solution of following composition: (mM) 150 NaC1, 5.4 KCl, 1.8 CaCl2, 1.0 MgCl2, 1.0 Na pyruvate, 15 HEPES, and 15 glucose; pH was adjusted to 7.4 with NaOH. Glass micropipettes (2–3 MΩ tip resistance) were fabricated from standard wall borosilicate glass capillary tubes (Sutter BF 100-50-10) and filled with the following intracellular solution: 120 KCl, 1.0 MgCl2, 10 HEPES, 10 EGTA, and 3 Mg-ATP; pH was adjusted to 7.2 with KOH. Single beating cardiomyocytes were selected and APs were recorded in whole-cell current clamp mode using an EPC-10 patch-clamp amplifier (HEKA). External solution containing 0.1% DMSO (vehicle) was applied to establish the baseline. Then, cells were treated with TKI solution containing imatinib, axitinib, nilotinib, or vandetanib (LC Labs). Data were acquired using PatchMaster software (HEKA), digitized at 1.0 kHz and analyzed using FitMaster (HEKA), Igor Pro (Wave Metrics), and Prism 5 (GraphPad). For recordings on differentiated ventricular-like hiPSC-CMs, the maximum diastolic potential (MDP) of single cardiomyocytes varied from −70 mV to −50 mV, action potential amplitude (APA) was greater than 90 mV, and action potential duration (APD)90/APD50 was less than 1.20. Only cardiomyocytes satisfying aforementioned criteria were ventricular-like cardiomyocytes and selected for assessing the effects of TKIs. Baseline APs were recorded for 3 minutes before application of drug and at 3, 5 and 10 minutes while keeping a continuous perfusion with drug. In a separate series of experiments, drugs were added for 2 hours at 37°C before patching. Average responses of N=10 APs were analyzed per treatment. Significant APD90 prolongation is defined as >10% change in APD90.
Kinase phosphorylation profiling
Phosphorylation of human RTKs and other phosphoproteins was determined using a Human Phospho-RTK Array or Human Phospho-Kinase Antibody Array (R&D Systems). Day 30–35 post-differentiation hiPSC-CMs were treated with TKIs for 72 hours and lysed. Lysate was incubated overnight on an RTK or phospho-kinase panel and subsequently with an anti-phospho-tyrosine-horseradish peroxidase antibody to assess phosphorylation. Blots were developed using a Gel Doc XR (BioRad). Phosphorylation intensity was determined using ImageJ software.
Gene expression
RTK expression in hiPSC-CMs was determined using Ion AmpliSeq (Life Technologies). RNA was extracted using the RNeasy Micro kit (Qiagen). cDNA libraries were synthesized using the Ion AmpliSeq Transcriptome Human Gene Expression kit. Libraries were added to Ion PI chips and loaded onto an Ion Chef instrument for template preparation. Transcriptome sequencing was conducted on an Ion Proton sequencing system (Life Technologies). For expression analysis of hiPSC-CMs following TKI treatment, a GeneChip® Human Gene 1.0 ST DNA Microarray was used (Affymetrix).
Statistical Analysis
Data presented as mean ± standard error of the mean (SEM) unless otherwise specified. Comparisons conducted via Student’s t-test, unless otherwise specified, with significant differences defined by *P<0.05 or **P<0.01. For microarray experiments, multiple P-value comparisons were made using a one-way between-subject ANOVA (P<0.05) and Affymetrix Transcriptome Analysis Console 2.0 software.
Supplementary Material
Fig. S1. hiPSCs exhibit characteristic morphologies and markers of pluripotent stem cells.
Fig. S2. Quantitative and qualitative cell viability assays illustrate sorafenib, regorafenib, and ponatinib cytotoxicity in hiPSC-CMs.
Fig. S3. Quantitative cell viability assays on additional hiPSC-CM lines demonstrate VEGFR2/PDGFR-inhibiting TKI toxicity.
Fig. S4. Quantitative cell viability assays in hiPSC-CMs and hiPSC-ECs derived from patients receiving TKI treatment.
Fig. S5. Commercially-available, healthy control hiPSC-CMs exhibit alterations in cellular contractility after 72 hour TKI treatment.
Fig. S6. Heatmaps of high-throughput contractility analysis on commercially-available, healthy control hiPSC-CMs treated with TKIs.
Fig. S7. Extended calculations for TKI safety index after 72 hour TKI treatment on commercially-available, healthy control hiPSC-CMs.
Fig. S8. hiPSC-CMs exhibit alterations in cellular contractility after 72 hour treatment with known QT interval-prolonging TKIs.
Fig. S9. hiPSC-derived endothelial cells exhibit endothelial cell characteristics and demonstrate cytotoxicity in response to TKI treatment.
Fig. S10. hiPSC-derived cardiac fibroblasts exhibit properties of adult cardiac fibroblasts and demonstrate cytotoxicity in response to TKI treatment.
Fig. S11. hiPSCs demonstrate a TKI cytotoxicity profile that is unique from hiPSC-CMs, hiPSC-ECs, and hiPSC-CFs.
Fig. S12. VEGFR2/PDGFR-inhibiting TKI treatment in hiPSC-CMs results in activation of compensatory insulin/IGF1 signaling.
Fig. S13. IGF1 and insulin treatment activates cardioprotective Akt signaling in hiPSC-CMs.
Fig. S14. IGF1 and insulin treatment rescues doxorubicin toxicity in hiPSC-CMs.
Fig. S15. IGF1 and insulin treatment rescues ponatinib toxicity at early timepoints in hiPSC-CMs.
Fig. S16. RNA-sequencing of hiPSC-CMs treated with VEGFR2/PDGFR-inhibiting TKI sorafenib illustrates compensatory hyperactivation of VEGF signaling.
Table S1. Small molecule TKIs selected for high-throughput cardiotoxicity screen.
Table S2. Adverse cardiac events associated with small molecule TKIs selected for high-throughput cardiotoxicity screen.
Movie S1. hiPSC-CMs prior to purification via glucose deprivation.
One Sentence Summary.
In this study, we conducted high-throughput screening of patient-specific human induced pluripotent stem cell-derived cardiomyocytes and developed a “cardiac safety index” to assess the cardiotoxicity profiles of tyrosine kinase inhibitors.
Acknowledgments
We thank Kristy Red-Horse for assistance with confocal imaging. We also thank Edward Yeh from MD Anderson Cancer Center for information regarding TKI usage and cardiotoxicity prevalence. We acknowledge the Stanford High-Throughput Bioscience Center for assistance with high-throughput imaging and plate reader assays. We thank Andrew Olson from the Stanford Neuroscience Microscopy Service for help with calcium imaging.
Funding: We gratefully acknowledge support from the American Heart Association Predoctoral Fellowship 13PRE15770000, National Science Foundation Graduate Research Fellowship DGE-114747 (A.S.), NIH K99/R00 HL121177 and American Heart Association Beginning Grant-in-Aid 14BGIA20480329 (P.W.B.), NIH Director’s Pioneer Award, American Heart Association Grant-in-Aid, Endowed Faculty Scholar Award of the Lucile Packard Foundation for Children and Child Health Research Institute at Stanford (S.M.W.), and Burroughs Wellcome Foundation Innovation in Regulatory Science, American Heart Association Established Investigator Award, NIH R01 HL132875, NIH R01 HL130020, NIH R01 HL128170, NIH R01 HL123968, and NIH R24 HL117756 (J.C.W.).
Footnotes
Author contributions: A.S., P.W.B., and J.C.W designed the study and participated in data analysis and manuscript writing. A.S. and P.W.B. participated in all experimental work. W.L.M. and R.S. conducted high-throughput contractility assessments. P.S. performed patch clamp electrophysiology. N.S. assisted with deriving hiPSC-CMs and hiPSC-ECs from patients receiving TKI treatment. J.M.C. performed microarray and RNA-seq analysis. T.K. assisted with high-throughput toxicity analysis. H.W. conducted calcium imaging. A.H. conducted hiPSC-EC differentiation and characterization. E.M. assisted with gene expression analysis. Y.Z. performed immunocytochemistry and manuscript editing. A.K. performed immunocytochemistry and manuscript editing. A.C.F. assisted with patient recruitment. J.C.A., S.M.W., J.J.M., M.M., and J.C.W assisted with study design and manuscript editing.
Competing interests: Dr. Mark Mercola is on the scientific advisory board for Vala Sciences, a company offering high-content screening services. Dr. Joseph Wu is on the scientific advisory board of Stem Cell Theranostics, a company using patient-specific hiPSC-CMs for drug discovery.
Data and materials availability: Gene expression data found at Gene Expression Omnibus with accession number GSE88944 and GSE89411.
SUPPLEMENTARY MATERIALS
Supplementary References: (32–50)
REFERENCES AND NOTES
- 1.Moslehi JJ, Deininger M. Tyrosine Kinase Inhibitor-Associated Cardiovascular Toxicity in Chronic Myeloid Leukemia. Journal of clinical oncology: official journal of the American Society of Clinical Oncology. 2015 doi: 10.1200/JCO.2015.62.4718. [DOI] [PMC free article] [PubMed] [Google Scholar]
- 2.Yeh ET, Bickford CL. Cardiovascular complications of cancer therapy: incidence, pathogenesis, diagnosis, and management. Journal of the American College of Cardiology. 2009;53:2231–2247. doi: 10.1016/j.jacc.2009.02.050. [DOI] [PubMed] [Google Scholar]
- 3.T. Force. Krause DS, Van Etten RA. Molecular mechanisms of cardiotoxicity of tyrosine kinase inhibition. Nat Rev Cancer. 2007;7:332–344. doi: 10.1038/nrc2106. [DOI] [PubMed] [Google Scholar]
- 4.Lu HR, Marien R, De Clerck F. Species plays an important role in drug-induced prolongation of action potential duration and early afterdepolarizations in isolated Purkinje fibers. J Cardiovasc Electrophysiol. 2001;12:93–102. doi: 10.1046/j.1540-8167.2001.00093.x. [DOI] [PubMed] [Google Scholar]
- 5.Liang P, Lan F, Lee AS, Gong T, Sanchez-Freire V, Wang Y, Diecke S, Sallam K, Knowles JW, Wang PJ, Nguyen PK, Bers DM, Robbins RC, Wu JC. Drug screening using a library of human induced pluripotent stem cell-derived cardiomyocytes reveals disease-specific patterns of cardiotoxicity. Circulation. 2013;127:1677–1691. doi: 10.1161/CIRCULATIONAHA.113.001883. [DOI] [PMC free article] [PubMed] [Google Scholar]
- 6.Mitcheson JS, Hancox JC, Levi AJ. Cultured adult cardiac myocytes: future applications, culture methods, morphological and electrophysiological properties. Cardiovasc Res. 1998;39:280–300. doi: 10.1016/s0008-6363(98)00128-x. [DOI] [PubMed] [Google Scholar]
- 7.Takahashi K, Tanabe K, Ohnuki M, Narita M, Ichisaka T, Tomoda K, Yamanaka S. Induction of pluripotent stem cells from adult human fibroblasts by defined factors. Cell. 2007;131:861–872. doi: 10.1016/j.cell.2007.11.019. [DOI] [PubMed] [Google Scholar]
- 8.Burridge PW, Matsa E, Shukla P, Lin ZC, Churko JM, Ebert AD, Lan F, Diecke S, Huber B, Mordwinkin NM, Plews JR, Abilez OJ, Cui B, Gold JD, Wu JC. Chemically defined generation of human cardiomyocytes. Nat Methods. 2014;11:855–860. doi: 10.1038/nmeth.2999. [DOI] [PMC free article] [PubMed] [Google Scholar]
- 9.Sharma A, Marceau C, Hamaguchi R, Burridge PW, Rajarajan K, Churko JM, Wu H, Sallam KI, Matsa E, Sturzu AC, Che Y, Ebert A, Diecke S, Liang P, Red-Horse K, Carette JE, Wu SM, Wu JC. Human induced pluripotent stem cell-derived cardiomyocytes as an in vitro model for coxsackievirus B3-induced myocarditis and antiviral drug screening platform. Circ Res. 2014;115:556–566. doi: 10.1161/CIRCRESAHA.115.303810. [DOI] [PMC free article] [PubMed] [Google Scholar]
- 10.Lan F, Lee AS, Liang P, Sanchez-Freire V, Nguyen PK, Wang L, Han L, Yen M, Wang Y, Sun N, Abilez OJ, Hu S, Ebert AD, Navarrete EG, Simmons CS, Wheeler M, Pruitt B, Lewis R, Yamaguchi Y, Ashley EA, Bers DM, Robbins RC, Longaker MT, Wu JC. Abnormal calcium handling properties underlie familial hypertrophic cardiomyopathy pathology in patient-specific induced pluripotent stem cells. Cell stem cell. 2013;12:101–113. doi: 10.1016/j.stem.2012.10.010. [DOI] [PMC free article] [PubMed] [Google Scholar]
- 11.Wu H, Lee J, Vincent LG, Wang Q, Gu M, Lan F, Churko JM, Sallam KI, Matsa E, Sharma A, Gold JD, Engler AJ, Xiang YK, Bers DM, Wu JC. Epigenetic Regulation of Phosphodiesterases 2A and 3A Underlies Compromised beta-Adrenergic Signaling in an iPSC Model of Dilated Cardiomyopathy. Cell stem cell. 2015;17:89–100. doi: 10.1016/j.stem.2015.04.020. [DOI] [PMC free article] [PubMed] [Google Scholar]
- 12.Moretti A, Bellin M, Welling A, Jung CB, Lam JT, Bott-Flugel L, Dorn T, Goedel A, Hohnke C, Hofmann F, Seyfarth M, Sinnecker D, Schomig A, Laugwitz KL. Patient-specific induced pluripotent stem-cell models for long-QT syndrome. The New England journal of medicine. 2010;363:1397–1409. doi: 10.1056/NEJMoa0908679. [DOI] [PubMed] [Google Scholar]
- 13.Burridge PW, Li YF, Matsa E, Wu H, Ong SG, Sharma A, Holmstrom A, Chang AC, Coronado MJ, Ebert AD, Knowles JW, Telli ML, Witteles RM, Blau HM, Bernstein D, Altman RB, Wu JC. Human induced pluripotent stem cell-derived cardiomyocytes recapitulate the predilection of breast cancer patients to doxorubicin-induced cardiotoxicity. Nature medicine. 2016;22:547–556. doi: 10.1038/nm.4087. [DOI] [PMC free article] [PubMed] [Google Scholar]
- 14.Kodo K, Ong SG, Jahanbani F, Termglinchan V, Hirono K, InanlooRahatloo K, Ebert AD, Shukla P, Abilez OJ, Churko JM, Karakikes I, Jung G, Ichida F, Wu SM, Snyder MP, Bernstein D, Wu JC. iPSC-derived cardiomyocytes reveal abnormal TGF-beta signalling in left ventricular non-compaction cardiomyopathy. Nature cell biology. 2016;18:1031–1042. doi: 10.1038/ncb3411. [DOI] [PMC free article] [PubMed] [Google Scholar]
- 15.Li W, Croce K, Steensma DP, McDermott DF, Ben-Yehuda O, Moslehi J. Vascular and Metabolic Implications of Novel Targeted Cancer Therapies: Focus on Kinase Inhibitors. Journal of the American College of Cardiology. 2015;66:1160–1178. doi: 10.1016/j.jacc.2015.07.025. [DOI] [PubMed] [Google Scholar]
- 16.Fradley MG, Moslehi J. QT Prolongation and Oncology Drug Development. Cardiac electrophysiology clinics. 2015;7:341–355. doi: 10.1016/j.ccep.2015.03.013. [DOI] [PubMed] [Google Scholar]
- 17.Jonassen AK, Sack MN, Mjos OD, Yellon DM. Myocardial protection by insulin at reperfusion requires early administration and is mediated via Akt and p70s6 kinase cell-survival signaling. Circ Res. 2001;89:1191–1198. doi: 10.1161/hh2401.101385. [DOI] [PubMed] [Google Scholar]
- 18.Buerke M, Murohara T, Skurk C, Nuss C, Tomaselli K, Lefer AM. Cardioprotective effect of insulin-like growth factor I in myocardial ischemia followed by reperfusion. Proc Natl Acad Sci U S A. 1995;92:8031–8035. doi: 10.1073/pnas.92.17.8031. [DOI] [PMC free article] [PubMed] [Google Scholar]
- 19.Hill A, Gotham D, Fortunak J, Meldrum J, Erbacher I, Martin M, Shoman H, Levi J, Powderly WG, Bower M. Target prices for mass production of tyrosine kinase inhibitors for global cancer treatment. BMJ open. 2016;6:e009586. doi: 10.1136/bmjopen-2015-009586. [DOI] [PMC free article] [PubMed] [Google Scholar]
- 20.Cheng H, Kari G, Dicker AP, Rodeck U, Koch WJ, T. Force A novel preclinical strategy for identifying cardiotoxic kinase inhibitors and mechanisms of cardiotoxicity. Circ Res. 2011;109:1401–1409. doi: 10.1161/CIRCRESAHA.111.255695. [DOI] [PMC free article] [PubMed] [Google Scholar]
- 21.Prasad V, Mailankody S. The accelerated approval of oncologic drugs: lessons from ponatinib. JAMA. 2014;311:353–354. doi: 10.1001/jama.2013.284531. [DOI] [PubMed] [Google Scholar]
- 22.Talbert DR, Doherty KR, Trusk PB, Moran DM, Shell SA, Bacus S. A multi-parameter in vitro screen in human stem cell-derived cardiomyocytes identifies ponatinib-induced structural and functional cardiac toxicity. Toxicol Sci. 2015;143:147–155. doi: 10.1093/toxsci/kfu215. [DOI] [PubMed] [Google Scholar]
- 23.Demetri GD, Reichardt P, Kang YK, Blay JY, Rutkowski P, Gelderblom H, Hohenberger P, Leahy M, von Mehren M, Joensuu H, Badalamenti G, Blackstein M, Le Cesne A, Schoffski P, Maki RG, Bauer S, Nguyen BB, Xu J, Nishida T, Chung J, Kappeler C, Kuss I, Laurent D, Casali PG, G. s. investigators Efficacy and safety of regorafenib for advanced gastrointestinal stromal tumours after failure of imatinib and sunitinib (GRID): an international, multicentre, randomised, placebo-controlled, phase 3 trial. Lancet. 2013;381:295–302. doi: 10.1016/S0140-6736(12)61857-1. [DOI] [PMC free article] [PubMed] [Google Scholar]
- 24.Wilhelm SM, Dumas J, Adnane L, Lynch M, Carter CA, Schutz G, Thierauch KH, Zopf D. Regorafenib (BAY 73–4506): a new oral multikinase inhibitor of angiogenic, stromal and oncogenic receptor tyrosine kinases with potent preclinical antitumor activity. Int J Cancer. 2011;129:245–255. doi: 10.1002/ijc.25864. [DOI] [PubMed] [Google Scholar]
- 25.Kattman SJ, Witty AD, Gagliardi M, Dubois NC, Niapour M, Hotta A, Ellis J, Keller G. Stage-specific optimization of activin/nodal and BMP signaling promotes cardiac differentiation of mouse and human pluripotent stem cell lines. Cell Stem Cell. 2011;8:228–240. doi: 10.1016/j.stem.2010.12.008. [DOI] [PubMed] [Google Scholar]
- 26.Giordano FJ, Gerber HP, Williams SP, VanBruggen N, Bunting S, Ruiz-Lozano P, Gu Y, Nath AK, Huang Y, Hickey R, Dalton N, Peterson KL, Ross J, Jr, Chien KR, Ferrara N. A cardiac myocyte vascular endothelial growth factor paracrine pathway is required to maintain cardiac function. Proc Natl Acad Sci U S A. 2001;98:5780–5785. doi: 10.1073/pnas.091415198. [DOI] [PMC free article] [PubMed] [Google Scholar]
- 27.Lee BS, Oh J, Kang SK, Park S, Lee SH, Choi D, Chung JH, Chung YW, Kang SM. Insulin Protects Cardiac Myocytes from Doxorubicin Toxicity by Sp1-Mediated Transactivation of Survivin. PLoS One. 2015;10:e0135438. doi: 10.1371/journal.pone.0135438. [DOI] [PMC free article] [PubMed] [Google Scholar]
- 28.McDevitt TC, Laflamme MA, Murry CE. Proliferation of cardiomyocytes derived from human embryonic stem cells is mediated via the IGF/PI 3-kinase/Akt signaling pathway. J Mol Cell Cardiol. 2005;39:865–873. doi: 10.1016/j.yjmcc.2005.09.007. [DOI] [PMC free article] [PubMed] [Google Scholar]
- 29.Favier B, Alam A, Barron P, Bonnin J, Laboudie P, Fons P, Mandron M, Herault JP, Neufeld G, Savi P, Herbert JM, Bono F. Neuropilin-2 interacts with VEGFR-2 and VEGFR-3 and promotes human endothelial cell survival and migration. Blood. 2006;108:1243–1250. doi: 10.1182/blood-2005-11-4447. [DOI] [PubMed] [Google Scholar]
- 30.Churko JM, Burridge PW, Wu JC. Generation of human iPSCs from human peripheral blood mononuclear cells using non-integrative Sendai virus in chemically defined conditions. Methods Mol Biol. 2013;1036:81–88. doi: 10.1007/978-1-62703-511-8_7. [DOI] [PMC free article] [PubMed] [Google Scholar]
- 31.Tohyama S, Hattori F, Sano M, Hishiki T, Nagahata Y, Matsuura T, Hashimoto H, Suzuki T, Yamashita H, Satoh Y, Egashira T, Seki T, Muraoka N, Yamakawa H, Ohgino Y, Tanaka T, Yoichi M, Yuasa S, Murata M, Suematsu M, Fukuda K. Distinct metabolic flow enables large-scale purification of mouse and human pluripotent stem cell-derived cardiomyocytes. Cell Stem Cell. 2013;12:127–137. doi: 10.1016/j.stem.2012.09.013. [DOI] [PubMed] [Google Scholar]
- 32.Banerjee I, Carrion K, Serrano R, Dyo J, Sasik R, Lund S, Willems E, Aceves S, Meili R, Mercola M, Chen J, Zambon A, Hardiman G, Doherty TA, Lange S, del Alamo JC, Nigam V. Cyclic stretch of embryonic cardiomyocytes increases proliferation, growth, and expression while repressing Tgf-beta signaling. Journal of molecular and cellular cardiology. 2015;79:133–144. doi: 10.1016/j.yjmcc.2014.11.003. [DOI] [PMC free article] [PubMed] [Google Scholar]
- 33.Natale RB, Thongprasert S, Greco FA, Thomas M, Tsai CM, Sunpaweravong P, Ferry D, Mulatero C, Whorf R, Thompson J, Barlesi F, Langmuir P, Gogov S, Rowbottom JA, Goss GD. Phase III trial of vandetanib compared with erlotinib in patients with previously treated advanced non-small-cell lung cancer. J Clin Oncol. 2011;29:1059–1066. doi: 10.1200/JCO.2010.28.5981. [DOI] [PubMed] [Google Scholar]
- 34.Perez EA, Koehler M, Byrne J, Preston AJ, Rappold E, Ewer MS. Cardiac safety of lapatinib: pooled analysis of 3689 patients enrolled in clinical trials. Mayo Clin Proc. 2008;83:679–686. doi: 10.4065/83.6.679. [DOI] [PubMed] [Google Scholar]
- 35.Gunnarsson O, Pfanzelter NR, Cohen RB, Keefe SM. Evaluating the safety and efficacy of axitinib in the treatment of advanced renal cell carcinoma. Cancer management and research. 2015;7:65–73. doi: 10.2147/CMAR.S74202. [DOI] [PMC free article] [PubMed] [Google Scholar]
- 36.van der Graaf WT, Blay JY, Chawla SP, Kim DW, Bui-Nguyen B, Casali PG, Schoffski P, Aglietta M, Staddon AP, Beppu Y, Le Cesne A, Gelderblom H, Judson IR, Araki N, Ouali M, Marreaud S, Hodge R, Dewji MR, Coens C, Demetri GD, Fletcher CD, Dei Tos AP, Hohenberger P, Tissue ES, Bone Sarcoma G, P. s. group Pazopanib for metastatic soft-tissue sarcoma (PALETTE): a randomised, double-blind, placebo-controlled phase 3 trial. Lancet. 2012;379:1879–1886. doi: 10.1016/S0140-6736(12)60651-5. [DOI] [PubMed] [Google Scholar]
- 37.Cortes JE, Kim DW, Pinilla-Ibarz J, le Coutre P, Paquette R, Chuah C, Nicolini FE, Apperley JF, Khoury HJ, Talpaz M, DiPersio J, DeAngelo DJ, Abruzzese E, Rea D, Baccarani M, Muller MC, Gambacorti-Passerini C, Wong S, Lustgarten S, Rivera VM, Clackson T, Turner CD, Haluska FG, Guilhot F, Deininger MW, Hochhaus A, Hughes T, Goldman JM, Shah NP, Kantarjian H, P. Investigators A phase 2 trial of ponatinib in Philadelphia chromosome-positive leukemias. N Engl J Med. 2013;369:1783–1796. doi: 10.1056/NEJMoa1306494. [DOI] [PMC free article] [PubMed] [Google Scholar]
- 38.Grothey A, Van Cutsem E, Sobrero A, Siena S, Falcone A, Ychou M, Humblet Y, Bouche O, Mineur L, Barone C, Adenis A, Tabernero J, Yoshino T, Lenz HJ, Goldberg RM, Sargent DJ, Cihon F, Cupit L, Wagner A, Laurent D, C.S. Group Regorafenib monotherapy for previously treated metastatic colorectal cancer (CORRECT): an international, multicentre, randomised, placebo-controlled, phase 3 trial. Lancet. 2013;381:303–312. doi: 10.1016/S0140-6736(12)61900-X. [DOI] [PubMed] [Google Scholar]
- 39.Schmidinger M, Zielinski CC, Vogl UM, Bojic A, Bojic M, Schukro C, Ruhsam M, Hejna M, Schmidinger H. Cardiac toxicity of sunitinib and sorafenib in patients with metastatic renal cell carcinoma. J Clin Oncol. 2008;26:5204–5212. doi: 10.1200/JCO.2007.15.6331. [DOI] [PubMed] [Google Scholar]
- 40.Zang J, Wu S, Tang L, Xu X, Bai J, Ding C, Chang Y, Yue L, Kang E, He J. Incidence and risk of QTc interval prolongation among cancer patients treated with vandetanib: a systematic review and meta-analysis. PLoS ONE. 2012;7:e30353. doi: 10.1371/journal.pone.0030353. [DOI] [PMC free article] [PubMed] [Google Scholar]
- 41.Kantarjian HM, Cortes JE, Kim DW, Khoury HJ, Brummendorf TH, Porkka K, Martinelli G, Durrant S, Leip E, Kelly V, Turnbull K, Besson N, Gambacorti-Passerini C. Bosutinib safety and management of toxicity in leukemia patients with resistance or intolerance to imatinib and other tyrosine kinase inhibitors. Blood. 2014;123:1309–1318. doi: 10.1182/blood-2013-07-513937. [DOI] [PMC free article] [PubMed] [Google Scholar]
- 42.Talpaz M, Shah NP, Kantarjian H, Donato N, Nicoll J, Paquette R, Cortes J, O’Brien S, Nicaise C, Bleickardt E, Blackwood-Chirchir MA, Iyer V, Chen TT, Huang F, Decillis AP, Sawyers CL. Dasatinib in imatinib-resistant Philadelphia chromosome-positive leukemias. N Engl J Med. 2006;354:2531–2541. doi: 10.1056/NEJMoa055229. [DOI] [PubMed] [Google Scholar]
- 43.Kerkela R, Grazette L, Yacobi R, Iliescu C, Patten R, Beahm C, Walters B, Shevtsov S, Pesant S, Clubb FJ, Rosenzweig A, Salomon RN, Van Etten RA, Alroy J, Durand JB, T. Force Cardiotoxicity of the cancer therapeutic agent imatinib mesylate. Nature medicine. 2006;12:908–916. doi: 10.1038/nm1446. [DOI] [PubMed] [Google Scholar]
- 44.Kim TD, le Coutre P, Schwarz M, Grille P, Levitin M, Fateh-Moghadam S, Giles FJ, Dorken B, Haverkamp W, Kohncke C. Clinical cardiac safety profile of nilotinib. Haematologica. 2012;97:883–889. doi: 10.3324/haematol.2011.058776. [DOI] [PMC free article] [PubMed] [Google Scholar]
- 45.Bronte E, Bronte G, Novo G, Bronte F, Bavetta MG, Lo Re G, Brancatelli G, Bazan V, Natoli C, Novo S, Russo A. What links BRAF to the heart function? new insights from the cardiotoxicity of BRAF inhibitors in cancer treatment. Oncotarget. 2015;6:35589–35601. doi: 10.18632/oncotarget.5853. [DOI] [PMC free article] [PubMed] [Google Scholar]
- 46.Kim G, McKee AE, Ning YM, Hazarika M, Theoret M, Johnson JR, Xu QC, Tang S, Sridhara R, Jiang X, He K, Roscoe D, McGuinn WD, Helms WS, Russell AM, Miksinski SP, Zirkelbach JF, Earp J, Liu Q, Ibrahim A, Justice R, Pazdur R. FDA approval summary: vemurafenib for treatment of unresectable or metastatic melanoma with the BRAFV600E mutation. Clin Cancer Res. 2014;20:4994–5000. doi: 10.1158/1078-0432.CCR-14-0776. [DOI] [PubMed] [Google Scholar]
- 47.Infante JR, Fecher LA, Falchook GS, Nallapareddy S, Gordon MS, Becerra C, DeMarini DJ, Cox DS, Xu Y, Morris SR, Peddareddigari VG, Le NT, Hart L, Bendell JC, Eckhardt G, Kurzrock R, Flaherty K, Burris HA, 3rd, Messersmith WA. Safety, pharmacokinetic, pharmacodynamic, and efficacy data for the oral MEK inhibitor trametinib: a phase 1 dose-escalation trial. Lancet Oncol. 2012;13:773–781. doi: 10.1016/S1470-2045(12)70270-X. [DOI] [PubMed] [Google Scholar]
- 48.Byrd JC, Brown JR, O’Brien S, Barrientos JC, Kay NE, Reddy NM, Coutre S, Tam CS, Mulligan SP, Jaeger U, Devereux S, Barr PM, Furman RR, Kipps TJ, Cymbalista F, Pocock C, Thornton P, Caligaris-Cappio F, Robak T, Delgado J, Schuster SJ, Montillo M, Schuh A, de Vos S, Gill D, Bloor A, Dearden C, Moreno C, Jones JJ, Chu AD, Fardis M, McGreivy J, Clow F, James DF, Hillmen P, R. Investigators Ibrutinib versus ofatumumab in previously treated chronic lymphoid leukemia. N Engl J Med. 2014;371:213–223. doi: 10.1056/NEJMoa1400376. [DOI] [PMC free article] [PubMed] [Google Scholar]
- 49.Tartarone A, Gallucci G, Lazzari C, Lerose R, Lombardi L, Aieta M. Crizotinib-induced cardiotoxicity: the importance of a proactive monitoring and management. Future Oncol. 2015;11:2043–2048. doi: 10.2217/fon.15.47. [DOI] [PubMed] [Google Scholar]
- 50.E.T. Yeh. (MD Anderson Practices In Onco-Cardiology Department of Cardiology, The University of Texas MD Anderson Cancer Center, 2016).
Associated Data
This section collects any data citations, data availability statements, or supplementary materials included in this article.
Supplementary Materials
Fig. S1. hiPSCs exhibit characteristic morphologies and markers of pluripotent stem cells.
Fig. S2. Quantitative and qualitative cell viability assays illustrate sorafenib, regorafenib, and ponatinib cytotoxicity in hiPSC-CMs.
Fig. S3. Quantitative cell viability assays on additional hiPSC-CM lines demonstrate VEGFR2/PDGFR-inhibiting TKI toxicity.
Fig. S4. Quantitative cell viability assays in hiPSC-CMs and hiPSC-ECs derived from patients receiving TKI treatment.
Fig. S5. Commercially-available, healthy control hiPSC-CMs exhibit alterations in cellular contractility after 72 hour TKI treatment.
Fig. S6. Heatmaps of high-throughput contractility analysis on commercially-available, healthy control hiPSC-CMs treated with TKIs.
Fig. S7. Extended calculations for TKI safety index after 72 hour TKI treatment on commercially-available, healthy control hiPSC-CMs.
Fig. S8. hiPSC-CMs exhibit alterations in cellular contractility after 72 hour treatment with known QT interval-prolonging TKIs.
Fig. S9. hiPSC-derived endothelial cells exhibit endothelial cell characteristics and demonstrate cytotoxicity in response to TKI treatment.
Fig. S10. hiPSC-derived cardiac fibroblasts exhibit properties of adult cardiac fibroblasts and demonstrate cytotoxicity in response to TKI treatment.
Fig. S11. hiPSCs demonstrate a TKI cytotoxicity profile that is unique from hiPSC-CMs, hiPSC-ECs, and hiPSC-CFs.
Fig. S12. VEGFR2/PDGFR-inhibiting TKI treatment in hiPSC-CMs results in activation of compensatory insulin/IGF1 signaling.
Fig. S13. IGF1 and insulin treatment activates cardioprotective Akt signaling in hiPSC-CMs.
Fig. S14. IGF1 and insulin treatment rescues doxorubicin toxicity in hiPSC-CMs.
Fig. S15. IGF1 and insulin treatment rescues ponatinib toxicity at early timepoints in hiPSC-CMs.
Fig. S16. RNA-sequencing of hiPSC-CMs treated with VEGFR2/PDGFR-inhibiting TKI sorafenib illustrates compensatory hyperactivation of VEGF signaling.
Table S1. Small molecule TKIs selected for high-throughput cardiotoxicity screen.
Table S2. Adverse cardiac events associated with small molecule TKIs selected for high-throughput cardiotoxicity screen.
Movie S1. hiPSC-CMs prior to purification via glucose deprivation.