

Abstract
Cellular functions are mediated by complex interactome networks of physical, biochemical, and functional interactions between DNA sequences, RNA molecules, proteins, lipids, and small metabolites. A thorough understanding of cellular organization requires accurate and relatively complete models of interactome networks at proteome-scale. The recent publication of four human protein-protein interaction (PPI) maps represents a technological breakthrough and an unprecedented resource for the scientific community, heralding a new era of proteome-scale human interactomics. Our knowledge gained from these and complementary studies provides fresh insights into the opportunities and challenges when analyzing systematically generated interactome data, defines a clear roadmap towards the generation of a first reference interactome, and reveals new perspectives on the organization of cellular life.
Keywords: network biology, protein-protein interactions, human interactome, binary protein interactions, co-complex associations, interactome mapping quality, systematic interactome network maps
Proteome-scale human interactome maps
Cellular functions are orchestrated by complex “interactome” networks of physical and functional interactions between biological macromolecules, including DNA, RNA, proteins, and lipids, as well as smaller molecules such as metabolites. The relationships between such components are best modeled as graphical networks, in which molecules are represented by “nodes” and the interactions between them by links or “edges” [1]. Analyzing the properties of such networks can provide important insights into cellular organization and underlying systems-level properties of life [1].
Since proteins are crucial for most cellular functions and typically participate in biological processes in concert with other proteins, reference maps of protein-protein interactions (PPIs) in an organism, or its PPI interactome, should provide a deeper, more mechanistic understanding of cellular functions. However, contrary to genome and transcriptome reference sequences, human PPI interactome maps are still relatively far from completeness. The reasons are two-fold. First, compared to DNA or RNA, proteins tend to be more biochemically complex and thus technically challenging to manipulate and study. Second, the detection of interactions is more difficult than directly detecting molecules given the wide range of interaction strengths and specificities. Indeed, it took several decades to develop robust methods for detecting PPIs at proteome-scale. These efforts paired with the availability of nearly complete “ORFeome” collections of “readyto-be-expressed” human open reading frames (ORFs) [2] laid the necessary foundation to enable substantial progress in mapping the human PPI interactome (hereafter referred to as “interactome” for simplicity). In the span of a couple of years, four groundbreaking human interactome maps have been published (Figure 1), each utilizing different methodologies and thus capturing different aspects of the human interactome [3–6]. This review compares and contrasts these four interactome maps, puts their achievements and findings into context, and identifies remaining challenges in the field of human protein interactomics.
Figure 1. Published systematic human protein interactome maps.
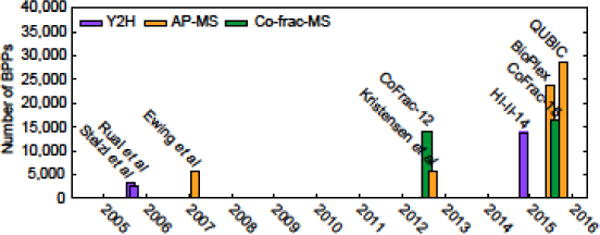
It took about ten years from the first publication of a medium-scale set of human PPIs to the publication of several proteome-scale systematic maps of biophysical relationships between pairs of human proteins (BPPs). The color code indicates the primary screening method used. The displayed datasets are, from left to right, Stelzl et al. [58], Rual et al. [59], Ewing et al. [60], CoFrac-12 [17], Kristensen et al. [61], HI-II-14 [5], BioPlex [4], CoFrac-15 [6], and QUBIC [3].
Human PPI Mapping at Proteome-scale
We define a PPI as a direct physical contact between two proteins. Such interactions may occur on their own in a binary manner or may require additional interaction partners. Proteins can form multimeric complexes, in which there are many direct interactions (PPIs) as well as indirect protein-protein associations (PPAs) between the different proteins of the complex. Currently, two orthogonal approaches exist for experimentally identifying biophysical relationships between pairs of proteins (in short, biophysical protein pairs or BPPs, which include PPIs and PPAs) at proteome-scale: binary mapping and protein complex mapping (Figure 2).
Figure 2. Overview of the generation of four recently published human interactome maps.
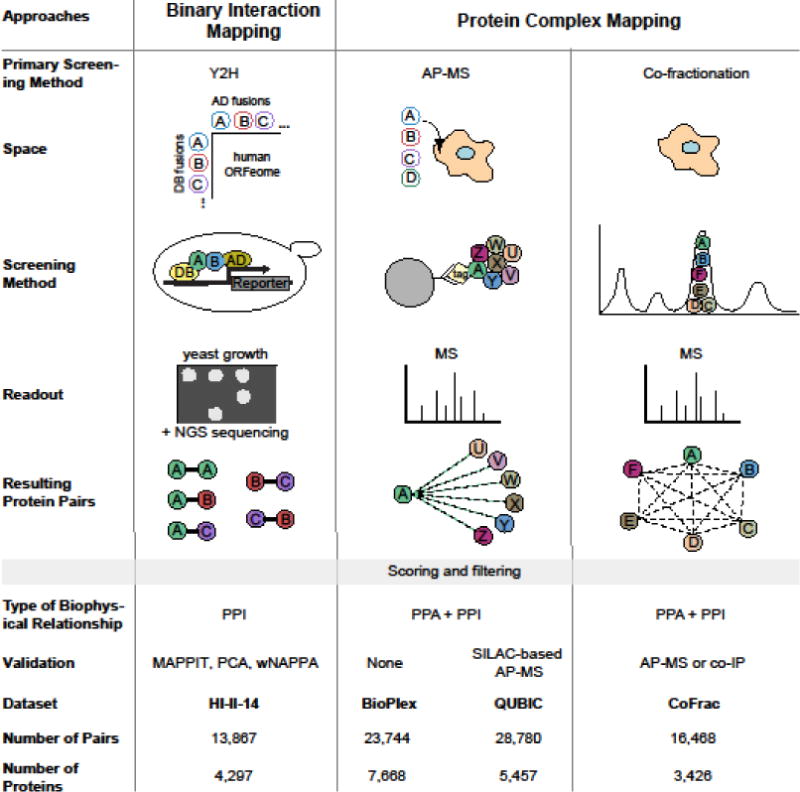
Empty circles represent expression constructs, filled circles represent proteins. NGS = next-generation sequencing, DB = DNA-binding domain and AD = activation domain of the Gal4 transcription factor. The number of pairs and proteins are determined after mapping each dataset to the Entrez Gene ID gene space. The maps are HI-II-14 [5], BioPlex [4], QUBIC [3], and CoFrac-15 [6].
Binary mapping approaches interrogate pairs of proteins for the existence of direct interactions between them (PPIs). Protein complex mapping approaches, on the other hand, aim to identify the set of proteins that belong to a multimeric protein complex, wherein pairs of proteins form either direct contacts (PPIs) or are linked by indirect associations (PPAs). Yeast two-hybrid (Y2H) systems combined with orthogonal validation assays performed in mammalian cells and/or in vitro [7] are now routinely used to screen hundreds of millions of protein pairs for possible interactions [8]. Y2H is based on the activation of a reporter gene upon the reconstitution of a transcription factor via a pair of interacting proteins in yeast, resulting in a growth selection (Figure 2). It is the relative ease of working with yeast and the ability to select for interacting pairs that determine the scalability of Y2H. The precision and sensitivity of datasets generated with Y2H are determined with the help of validation assays, in which pairs identified in the screens are systematically tested together with large sets of known PPIs and random pairs of proteins as positive and negative controls, respectively. The validation assays routinely used for this purpose are based on reconstitution of split enzymes or on the activation of the STAT3 pathway resulting in a readout such as fluorescence or luminescence [9–11].
Two approaches exist for the identification of protein complexes at proteome-scale: affinity purification (AP) followed by mass spectrometry (MS) or “AP-MS” and co-fractionation (co-Frac) followed by MS or “co-Frac-MS” In AP-MS, protein baits are purified from a cell lysate and co-purified proteins (the preys) are detected by MS. In co-Frac-MS, protein extracts are extensively fractionated to separate protein complexes whose components are then detected by MS (Figure 2). Current methods for protein complex identification operated at proteome-scale are unable to distinguish between PPAs and PPIs for all reported protein pairs. Y2H followed by systematic orthogonal validation, two forms of AP-MS, and co-Frac-MS strategies have been applied to the human proteome to produce four recently published human interactome maps, hereafter referred to as HI-II-14 [5], BioPlex [4], QUBIC [3], and CoFrac [6] (Figure 2).
Insights from Analyzing Systematically Generated Human Interactome Maps
These four human interactome maps have been generated and processed using different experimental and analytical frameworks, resulting in exciting findings that span topics as diverse as the quality and biases of current interactome maps, evolution of protein complexes, and how interaction strength relates to interactome organization [3–6]. Rolland and colleagues used computational and experimental approaches to investigate the quality of literature-curated PPIs originating from small-scale studies [5]. Retesting literature PPIs in two different assays revealed a three-fold higher rate at which literature PPIs with multiple experimental evidences (hereafter referred to as Lit-BM-13) scored positive compared to those PPIs with only one piece of evidence. Further analysis of Lit-BM-13 PPIs identified an inherent bias of the “literature interactome” towards heavily studied and/or highly expressed proteins (Figure 3) [5]. In fact, Lit-BM-13 mostly consists of PPIs involving proteins encoded by genes characterized in many publications and is depleted of interactions involving proteins described in few or no publications [5]. In contrast to the patterns in Lit-BM-13, the rate at which the four systematic interactome maps detect BPPs across the genome-by-genome space is more homogeneous, suggesting that the observed skewed distribution of Lit-BM-13 PPIs originates from a “sociological” or “study” bias (Figure 3) [5]. Therefore, the exclusive use of literature-derived PPI maps in network analysis may lead to incorrect conclusions about systems-level properties. For example, correlations between number of interaction partners, or “degree”, of proteins and the functional properties of their corresponding genes, such as essentiality, might have been observed mainly because essential genes are more studied [12, 13]. Using HI-II-14, the interactome map that is least biased among the four with respect to the number of publications, Rolland et al. could for the first time assess in a truly systematically generated PPI network the properties of proteins from genes involved in cancer, confirming that they tend to: i) bind to each other more often, ii) have higher degrees, and iii) be more central in a PPI network than proteins encoded by genes with no known association with cancer susceptibility [5]. These properties were successfully exploited to prioritize candidate genes of loci from cancer-associated genome-wide association studies (GWASs), by selecting genes within these loci that are linked via PPIs to well-established cancer genes [5].
Figure 3. Genome-wide coverage biases of functional and biophysical protein networks.
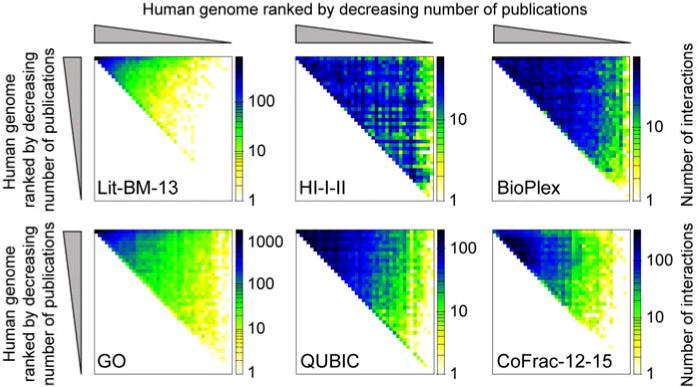
Interactome maps are each represented as an adjacency matrix in which all genes in the human genome were ranked based on publication count as extracted from [5] and grouped into bins of 478. The color scale was adjusted for every network to range from 0 to the largest number of protein pairs observed in any bin-by-bin subspace. Sources of the networks: Lit-BM-13 extracted from [5], HI-I-II merge of [5, 59], BioPlex [4], GO (Gene Ontology) network extracted from [5] (briefly, pairs of proteins were built if they share GO annotations, GO terms were filtered to those with at most 30 annotated genes), QUBIC [3], CoFrac-12-15 merge of [6, 17]. Every dataset was mapped to the Entrez Gene ID gene space. Observed study biases in the BioPlex, QUBIC and CoFrac-12-15 datasets are likely related to their propensity to detect interactions between more highly expressed genes.
Compared to literature-compiled interactome maps, systematically generated maps tend to display a more homogeneous sampling of protein interactions across the human proteome when proteins are ranked by publication count (Figure 3). It follows that systematically generated maps contain many more interactions for less-studied genes and are a powerful source of information for annotating proteins of unknown function using the “guilt-by-association” approach, the transfer of functional annotations from one protein to its less studied interaction partners [14, 15]. The discovery of new proteins that are involved in biological processes as diverse as embryonic development (CoFrac), cell cycle, and chaperone function (QUBIC), as well as diseases like amyotrophic lateral sclerosis (BioPlex) and cancer (HI-II-14), showcases the broad applicability of this approach using any of the four interactome maps [3–6]. Furthermore, protein interaction data has been leveraged to predict the subcellular localization of interaction partners (BioPlex) and new classes of domain-domain interactions (BioPlex, HI-II-14) [4, 5].
Studying the conservation or divergence of protein interactions on evolutionary time scales has proven difficult largely because comparing PPIs across taxa relied on heterogeneous data (i.e., data derived from different methods). This heterogeneity has created uncertainty about whether the observed differences in PPIs between organisms reflect true adaptation or are due to methodological differences or low assay sensitivities [16]. The CoFrac study is unique in that it employed the same BPP screening platform to detect protein complexes in nine different species that span one billion years of evolution [6, 17]. The authors find that although 75% of all human genes arose in metazoa, these younger genes only constitute 40% of the proteins in the complexes detected in CoFrac. This observation suggests that most of the biophysically stable protein complexes arose in unicellular ancestors and were only slightly modified over time [6]. Furthermore, Wan et al. have shown that the proteins in these ancient complexes tend to be broadly and abundantly expressed and display lower average domain complexity [6]. In line with these findings, proteins in ancient complexes are enriched for core biological processes, such as metabolism, whereas proteins in more “modern” complexes, defined as those formed after the emergence of metazoa, are enriched for functions linked to multicellularity [6]. Additionally, the protein subunits of modern complexes display more diverse domain architectures (i.e., each protein contains multiple distinct domains), a common property of proteins involved in cell signaling processes [6].
The set of interactions in the interactome is characterized by a continuum of binding affinities ranging from very weak or transient to highly stable protein interactions. Due to the technical challenges of obtaining such affinity data at interactome-scale, little is known about how interaction strength relates to interactome organization. In the QUBIC study, technological advances of label-free quantitative MS-based proteomics enabled an unprecedented view of protein association strength at interactome-scale [3]. Here, endogenously expressed baits fused to GFP were affinity purified from HeLa cells, and the interaction stoichiometries—the relative abundances of each bait-prey pair—were quantified using a label-free MS method. Using a similar methodology, the abundance stoichiometries—the endogenous abundances of each prey and bait in HeLa cell lysate—were also quantified. Both measures of stoichiometry were combined to define the strength of every bait-prey association [3]. “Strong” associations were defined as those pairs of proteins with one-to-one stoichiometry relationships and are likely part of very stable protein complexes. “Weak” associations between proteins were defined as those exhibiting sub-stoichiometric bait-prey recoveries (less prey than bait in the coimmunoprecipitations) and are considered cases in which the prey partially dissociated during the affinity purification or where the prey associates with a fraction of the bait pool in vivo [3]. The weak associations between proteins seem to vastly outnumber the more stable associations in the human interactome. Systematically removing associations from the network in silico, starting with the weakest associations (i.e., the lowest stoichiometry), leads to the rapid disconnection of the network characterized by the formation of a large number of isolated sub-networks [3]. Alternatively, iterative removal starting with the strongest associations tends to leave the network more intact compared with random edge removal. Thus, Hein et al. suggest that weak protein associations may mediate connections between more stable complexes and their regulators or adaptors, whereas strong protein associations are formed within complexes [3].
Interactome Maps of High Quality
In just a couple of years, the publication of four systematic human interactome maps have led to the identification of almost 93,000 unique protein interactions and assocations. This is comparable in scale to the ~115,000 BPPs detected in small-scale studies over several decades [5]. While these four interactome maps comprise high numbers of systematically generated BPPs, a majority (90%) of those have been observed in only one of the four maps, even for those pairs tested in all four maps (e.g. only ~150 baits were screened by both BioPlex and QUBIC). It has been hypothesized that these small overlaps (Figure 4) are explained by large numbers of false positives reported in individual interactome datasets [18]. In the following sections, we argue that these maps are of high quality, that small overlaps are due to low assay sensitivities and high assay complementarities, and that previous conclusions of high false positive rates were based on incorrect assumptions.
Figure 4. Overlaps between the four human interactome maps.

All of the displayed datasets (same as in Figure 3) were mapped to the Entrez Gene ID gene space prior to calculating their overlaps. The interactome maps were not restricted to the common gene space that was screened by all four studies.
HI-II-14, BioPlex, QUBIC, and CoFrac were generated by experts in the field who have honed protein interaction mapping methods over many years, specifically in pinpointing sources of false positives and, in turn, prompting their avoidance [8, 19–21]. For example, Y2H-based PPI mapping transitioned from using cDNA libraries to using sequencevalidated and arrayable sets of ORF clones during screening [22]. These sets have grown into near-complete ‘human ORFeome collections’, resources of protein-encoding ORF clones with a representative protein for almost every human gene [2]. Furthermore, rigorous quality control measures were implemented that eliminated spontaneous autoactivation of DNA binding-fusion proteins (i.e., activation of the reporter gene in the absence of the activation domain-containing fusion construct) [7, 23]. MS-based approaches also evolved through the years. The identification of associated proteins in purified complexes became practical after improvement of computational algorithms for peptide identification and quantification [24, 25], as well as experimental modifications and sophisticated computational analysis that more efficiently removed background and non-specifically bound proteins [26].
High-throughput screening offers many advantages over small-scale studies such as the ability to test large sets of positive and negative controls, operate under uniform experimental settings, identify technical artifacts, and discriminate between signal and noise from the abundant data. The four human interactome mapping efforts incorporated rigorous quality control, which followed a general strategy as outlined in Figure 5. Key steps include internal benchmarking to generate the protein pairs followed by external validation (retesting of a subset of these pairs in orthogonal assays) to quantify the quality of the generated pairs [21]. More details on the quality control process for each map is provided in Box 1 and Figure 5. A few general observations can be made: Key in the implementation of internal benchmarks for the MS-based approaches is the combination of state-of-the art quantitative proteomics with sophisticated machine learning (or probabilistic modeling, in the case of QUBIC) using gold-standard BPP datasets for training or testing. On the other hand, the MS-based methods were found to be more limited in their external validation, likely because of the unavailability of orthogonal assays at required throughput. Of note are external benchmarking efforts conducted in HI-II-14, for which 800 PPIs together with hundreds of positive (Lit-BM-13 pairs) and negative (random protein pairs) controls were tested in three orthogonal binary PPI detection assays, in which HI-II-14 and Lit-BM-13 PPIs recovered at similar rates (Box 1 and Figure 5) [5]. Thus, contrary to the perception that systematically generated maps are of low quality [18], multiple evidences suggest that proteome-scale screening efforts to systematically identify protein interactions can result in datasets of equal or superior reproducibility compared to interactions identified in focused studies.
Figure 5. Comparison of the different quality control approaches for generating the four human interactome maps.
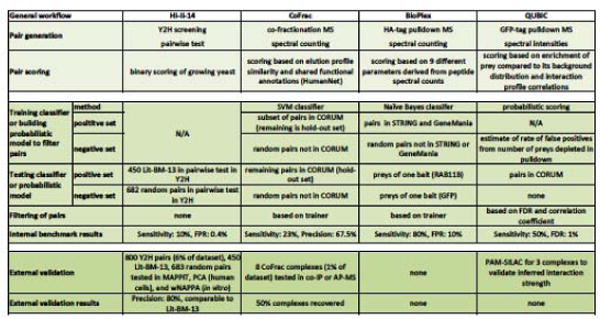
HA = hemagglutinin, GFP = green fluorescent protein, HumanNet [62], CORUM [63], STRING [64], GeneMania [65], RAB11B = Ras-related protein Rab-11B, FDR = false discovery rate (fraction of all identified BPPs that are false positives), sensitivity (fraction of “real” BPPs identified), FPR = false positive rate (fraction of negative BPPs scored as positive), precision (fraction of all reported BPPs that are correct), MAPPIT = mammalian protein-protein interaction trap [11], PCA = protein complementation assay [10], wNAPPA = well nucleic acid programmable protein array [66], coIP = co-immunoprecipitation, PAM-SILAC = purify after mixing stable isotope labeling of amino acids in cell culture.
Text Box 1. Quality control implementations of interactome maps.
In HI-II-14, interacting pairs of proteins were identified based on scoring growth of yeast, a process empirically controlled by testing in parallel large sets of Lit-BM-13 (positive) and random (negative control) protein pairs. A randomly selected subset of the identified PPIs was retested in three orthogonal binary PPI detection assays together with the above-mentioned sets of positive-and negative-control pairs (Figure 5) [5].
In CoFrac, the extent to which a protein pair co-elutes is a key factor in associating it to the same protein complex. A support vector machine (SVM) was trained to discriminate between true-and false-positive protein associations, and retained BPPs were clustered to define protein complexes. Eight complexes were selected for external validation using AP-MS or co-immunoprecipitation, but without estimates of the sensitivity and precision of both methods by simultaneous testing of positive and negative controls, there is no estimate on the precision (Figure 5) [6, 21].
In BioPlex, protein association information was derived from proteins co-purified from HA-tagged baits. A Naive Bayes machine learner was used to discriminate between true and false protein associations but its performance has been assessed using only two baits and their preys as positive and negative controls. Larger sets of positive and negative test data are likely required for more robust estimates of sensitivity and FPR (Figure 5) [4].
In QUBIC, the absolute quantities of bait and prey protein were measured in the cell lysate as well as in each co-purification. These values were incorporated into a probabilistic model to determine if a prey could be considered above background levels. Preys depleted compared to background levels were considered false positive BPPs and used to estimate FDRs of the QUBIC dataset [3]. When assessed against CORUM, ~50% of the protein pairs were recovered by QUBIC at an FDR of 1% (Figure 5) [3]. The advantage of this probabilistic approach is its independence from training a classifier; however, it is unclear to what extent depleted preys are representative of potential false positives generated by QUBIC.
It needs to be stressed that despite all efforts in quality control, calculated performance measures for all four interactome maps remain rough estimates, given that gold-standard datasets themselves are not fully representative of the physiological interactome and our understanding of sources of false positives is likely to be incomplete.
Potential Sources of Small Overlaps Between Interactome Maps
Clearly, the data quality is unlikely to explain the observed small overlaps between the maps (Figure 4). Rather, small overlaps are more likely the result of high rates of false negatives (i.e., low sensitivities) as indicated in Figure 5. Why do systematic interactome screening efforts miss so many PPIs and PPAs as revealed from assessing these methods using literature-derived gold standard datasets? One reason is attributable to the complexity of the human proteome. It is well known that human genes typically give rise to multiple protein isoforms, each of which can be further processed by post-translational modifications to produce “proteoforms” [27]. Proteoforms from the same gene can differ strikingly in the interactions that they are able to form with other proteins (more in detail discussed in Box 2). Thus, a known interaction between two proteoforms may not be detected in any of the four systematic studies, even if the corresponding genes are part of the search space because the relevant proteoforms are not tested, either because they are not expressed in the cell lines used in the MS-based approaches, or the corresponding clones are not available in the ORFeome collection. Furthermore, many reported binary interactions have been reported for protein fragments, not full-length sequences, the original reason being that fragments are more amenable to exogenous expression and tend to have higher PPI detection sensitivities [28]. The four human interactome mapping efforts are unlikely to detect interactions for these fragments because they exclusively screened for interactions between full-length proteins. Lastly, the information about which proteoforms or protein fragments were used to identify a BPP in a small-scale study may not be reliable or available in the first place and hence cannot be curated for addition into literature-derived gold standard datasets [29] making it impossible to account for proteomic variations upon determination of assay sensitivities.
Text Box 2. Leveraging protein interactions to infer protein function.
Protein interactions represent powerful data for the functional characterization of proteins, but the precise patterns or dynamics of interactions between related proteins can lead to a deeper understanding of their function. For example, several groups have investigated the extent to which splice-driven sequence differences between protein isoforms of the same gene can lead to different protein interactions, and by extension, function [49–51]. The most recent study described a new methodology, in which isoforms are cloned from large numbers of genes and then systematically profiled for PPIs [52]. Interaction profiles were compared between isoforms of the same gene (366 isoforms, 161 genes) to provide an indication of their functional divergence. Strikingly, these profiles differ by at least 50% for about half of the isoform pairs tested, suggesting that functional divergence between alternative isoforms from the same gene is more widespread than generally appreciated [52]. Inference of isoform function through properties of their interaction partners revealed that alternative isoforms behave like distinct proteins within a global network context [52].
Molecular interaction profiling has also uncovered the functional effect of the vast number of genetic variants identified in human genome sequencing efforts such as GWASs. For example, one study utilized a binary interaction screening platform to generate and compare protein interaction profiles between hundreds of proteins and their disease-allele-containing counterparts [53]. About one fourth of the disease-associated proteins lost all PPIs compared to the wild-type protein (“node removal” alleles) whereas one third only lost a subset of PPIs (“edgetic” alleles). The rates of interaction perturbation were seven times more likely for proteins containing disease-associated variants compared with common variants [5, 53]. Interestingly, existing tools to predict deleterious effects of mutations failed to distinguish between node removal and edgetic alleles, highlighting the relevance of assessing disease alleles experimentally. Finally, differences in interaction perturbation between mutant alleles of the same gene correlated with different disease phenotypes, and the extent of interaction perturbation correlated with disease severity.
These molecular interaction profiling strategies find application beyond the study of protein sequence variations. Interaction profile changes can be induced by protein phosphorylation [54] or other post-translational modifications (reviewed in [55]). And molecular interaction profiling is not limited to PPIs. Profiling protein-DNA interaction changes induced by variations in transcription factors or regulatory DNA is an equally powerful tool for the functional characterization of disease-related alleles [53, 56, 57].
An equally if not more important contributor to small overlaps between interactome maps are variations in the experimental methods that lead to different subsets of BPPs detected, a phenomenon known as assay complementarity [30, 31]. This becomes most apparent upon comparison of binary versus protein complex detection methods, with the former detecting PPIs and the latter a mix of PPIs and PPAs. Furthermore, PPIs display a large continuum of binding affinities and different BPP detection methods – each based on fundamentally different modes of detection – inevitably vary in the range of binding affinities in which they can detect interactions. Variations in the particular parameters of the BPP detection method itself can delimit the set of detectable BPPs. For example, the use of different fusion constructs (variable linker lengths between the epitope tag and protein, C-versus N-terminal tag configurations, etc.) can influence the binding properties of the proteins assayed [3, 32]. The use of different stringencies of washing buffers (variable formula of detergents, salts, chaotropic agents, etc.) to remove nonspecific binders in AP-MS can influence, which proteins are retained in the affinity purifications [30, 31]. More indications of assay complementarity between the four interactome mapping attempts become apparent upon closer inspection. The CoFrac map is enriched for ancient proteins (60%) compared to the 20–30% of the proteins in BioPlex and HI-II-14 that more closely match the estimated fraction of ancient proteins in the human genome [6]. Furthermore, CoFrac seems to be enriched for very stable protein complexes, as illustrated by a relatively high overlap of 26% with the very stable protein pairs reported in the QUBIC study [3]. Interestingly, CORUM seems to be biased towards more stable complexes [3] and ancient proteins [6], so gold-standard datasets are not necessarily representative of the properties of the whole interactome.
Even though overlaps between interactome maps are very small, they are still highly significant given the vast proteome-by-proteome search space from which BPPs are sampled. In line with this finding is another observation reported by Braun et al. where five different PPI detection assays were tested on a manually curated gold standard dataset of 92 binary PPIs [30, 33]. Of the 55 PPIs detected by at least one assay, eight PPIs were detected by all five assays. Again, this overlap appears small, but it is extremely unlikely to have occurred under the null-hypothesis that each of these five methods uniformly sampled a subset of interactions from the reference set of PPIs. Furthermore, 22 gold standard PPIs were only detected by one of the five tested assays overall suggesting that true protein interactions are not equally detectable by different assays.
These complex and interrelated factors that must be considered when interpreting overlaps between BPP datasets have been unknown or ignored in many studies, leading to large overestimates of false-positive rates of systematically generated yeast interactome datasets [18, 34, 35]. With human proteome-scale interactome maps now at hand, it is time to use this knowledge for a more accurate interpretation of the data. Through further exploration of these maps, we may gain a better understanding of the types of BPPs preferentially detected in different assays as well as of the factors that differentiate between quality and detectability of BPPs, insights that will be invaluable to improve interactome benchmarks and to obtain more detailed views on the composition and nature of the human protein interactome.
On Biophysical vs. Functionally Relevant PPIs
Proteins that can biophysically interact with each other do not necessarily mediate an interaction with a noticeable functional effect within the cell. The term “pseudointeractions” has been introduced to refer to these non-funtional PPIs [21]. Most assays, including Y2H, AP-MS, and co-Frac-MS, produce datasets of biophysical relationships between proteins whose functional relevance remains to be demonstrated. One can think of two different sources of biophysical yet non-functional protein pairs in interactome maps [36]. The first source includes pairs of proteins that can interact or associate but do so only under non-native conditions. For example, in AP-MS and co-Frac-MS, associated proteins are detected from cell lysates, in which the cellular localization of the proteins is perturbed. In Y2H, proteins are expressed and tested for interaction in the yeast nucleus. In these artificial settings, biophysical relationships between pairs of proteins can be detected, although there might not be a single cellular state under which these proteins would meet. The second source of biophysical yet nonfunctional interactions includes pairs of proteins that actually interact or associate with each other at a certain time point within a cell, but for which the interaction is ‘agnostic’, without any functional relationship or effect. BPPs that are non-functional have been considered false positives [37–39]. We strongly argue against such a classification upon several grounds: first, the objective of interactome mapping approaches is, because of technical limitations, to identify BPPs irrespective of their functional relevance; second, disproving the functional relevance of any BPP is nearly impossible; and third, nonfunctional BPPs within a cell may actually serve as an evolutionary reservoir for future functional BPPs during adaptation processes [36]. It is a subject of active research to understand the extent to which non-functional PPIs can form under cellular and nonnatural (e.g., during experimental manipulations) conditions. Recent work provides some evidence for natural selection against non-functional PPIs [40, 41].
Integration of systematically generated interactome maps with other (ideally, systematically generated) functional datasets can reveal the degree to which interactome maps are enriched with functional relationships between proteins as compared to random networks. All four interactome maps have been integrated with functional information such as the set of literature-curated BPPs, co-localization data, gene ontology (GO) annotations, mouse phenotypes, co-expression datasets, or kinase-substrate relationships, and all results universally demonstrate that each map is highly enriched for protein pairs that share functional annotations [3–6]. Interactome datasets derived from literature (by curating BPPs from small-scale studies) usually display a higher fraction of BPPs with shared functional annotations as compared to systematically generated interactome datasets [5, 18, 37, 39]. However, this does not mean that literature-derived maps are of higher quality [18, 37, 39]. First, many published BPPs themselves have been used to build functional annotation resources such as the Gene Ontology [42], so some degree of functional enrichment originates from circularity of information flow. Second, most functional annotations for human proteins originate from non-systematic studies. Heavily studied proteins tend to have more functional annotations, while less-studied proteins that exhibit interactions in the vast ‘sparse zone’ covered by the systematic maps will have few if any annotations (see GO plot in Figure 3) [5]. Thus, functional enrichments among PPIs in systematic and non-systematic maps, as an isolated measure, should not be solely relied upon to make conclusions about the quality or biological significance of interactome maps with respect to each other.
Defining a Reference Map of Human Protein Interactions
The ultimate goal of human interactome mapping is the generation of a reference map of human protein interactions, but how can such a reference map be defined? The genome, transcriptome, proteome, and interactome can be defined as the entirety of genes, transcripts, proteins, and interactions in a given cell. The actual set of expressed transcripts, proteins or interactions that exist at a given cellular state represent subsets of these ‘omes’ and can be considered cell-state-specific transcriptomes, proteomes or interactomes themselves. Y2H detects PPIs in a uniform cellular context, thus building a dataset that resembles an aggregate interactome that requires integration with gene or protein expression data to derive cell-state-specific interactomes. Alternatively, co-Frac-MS identifies protein complexes that are endogenous to a given cell line. This is also the case in AP-MS studies, if the baits are expressed from endogenous expression systems, as in the QUBIC study [3]. Furthermore, different mapping approaches identify complementary sets of biophysical relationships between proteins ranging from direct (binary) interactions to protein co-complex memberships. Given these methodological and conceptual differences, it is important to consider the different method-dependent interactome reference maps that can be built.
How complete does an interactome map need to be to be considered a reference interactome? Estimates on human interactome sizes range from 120,000 to more than one million [21, 43, 44] reflecting our vast uncertainties about the proportions of different types of protein interactions in the interactome and unknown biases in existing interactome maps originating from the different BPP detection methods. Given our uncertainties in the size of the human interactome, the completeness of a reference map can only be defined in a practical sense. This leads us to define a “working version” of a reference map of human protein interactions: all BPPs that are detectable by a method after a certain number of screens on a protein-by-protein matrix space that covers at least one isoform for every human protein-coding gene.
Generating such reference maps for the human interactome is within reach in this decade. Both published BioPlex and HI-II-14 datasets are intermediates in ongoing projects. These BPP maps in their current implementation are already substantially larger through increases in the space of protein pairs interrogated for interaction and the number of completed screens (BioPlex: http://wren.hms.harvard.edu/bioplex/, http://thebiogrid.org/. HI-II-14: http://interactome.baderlab.org, http://www.ebi.ac.uk/intact/).
Though such interactome reference maps will be incomplete in their approximation of the physiological human interactome, the very process of conceptualizing the problem of generating a reference interactome map and identification of concrete milestones will help to direct concerted effort towards their completion.
Concluding Remarks
We have entered an exciting new era of human protein interactome mapping. Systematically generated, high-quality BPP datasets contain a wealth of functional information that can aid genome annotation and deepen our understanding of biological processes and cellular organization. Key challenges towards generating more complete interactome maps will be to better understand the types of interactions identified by different methods, improve the sensitivity and scalability of BPP detection methods, complete current human ORFeome collections to contain at least one isoform per human protein-coding gene, incorporate the ability to screen and detect proteoforms in BPP assays, develop strategies to determine binding affinities of protein pairs at highthroughput, and to build (via binary approaches) or to dissect (via MS-based approaches) protein complex topologies (see Outstanding Questions). Important innovations along these lines have already been made. For instance, cross-linking MS methods are providing higher resolution topologies of intra-complex contacts between subunits and are approaching proteome-scale [45–47]. In tandem with large-scale mapping studies, focused studies on conditional interactomes are increasingly defining cell-, tissue-, and disease-specific interaction landscapes [48]. These and other developments promise to lead to a better understanding of how binary and co-complex based BPP maps can complement each other to provide a more complete picture of the human protein interactome.
Outstanding Questions.
How big is the human protein interactome?
How prevalent are different types of PPIs in the human interactome?
What are the methodological biases introduced into every interactome map and how do these influence our views on the physiological human interactome?
What is the fraction of functional interactions within the set of BPPs reported in interactome maps?
What is the topology of identified protein complexes?
What is the proportion of BPPs reported by protein complex methods that directly contact each other in the complex?
To which extent do pairs of proteins that directly contact each other in protein complexes also form a binary interaction (i.e. have a measurable binding affinity outside of the complex environment)?
Trends Box.
Proteome-scale maps of human protein interactions are becoming available, generated by complementary approaches.
High throughput protein interactome maps are of high quality, on par with literature-curated interaction datasets.
Systematically generated interactome maps more uniformly cover the human proteome compared to literature-curated interaction datasets that display a strong study bias.
Analysis of systematically generated interactome maps spurs new discoveries impossible to obtain with literature-curated interaction maps.
Acknowledgments
We thank D. Hill, A. Richardson, and M. Calderwood for helpful discussions, valuable comments and critical reading of the manuscript. K.L. and I.Z. were supported by NHGRI grant U41HG001715 and G.M.S. was supported by NIH training grant T32CA009361. Interactome mapping studies at CCSB are supported by NHGRI grants U41HG001715 and P50HG004233 Center of Excellence in Genomic Science awarded to M.V.
Footnotes
Publisher's Disclaimer: This is a PDF file of an unedited manuscript that has been accepted for publication. As a service to our customers we are providing this early version of the manuscript. The manuscript will undergo copyediting, typesetting, and review of the resulting proof before it is published in its final citable form. Please note that during the production process errors may be discovered which could affect the content, and all legal disclaimers that apply to the journal pertain.
References
- 1.Vidal M, et al. Interactome networks and human disease. Cell. 2011;144:986–998. doi: 10.1016/j.cell.2011.02.016. [DOI] [PMC free article] [PubMed] [Google Scholar]
- 2.Collaboration OR. The ORFeome Collaboration: a genome-scale human ORF-clone resource. Nature methods. 2016;13:191–192. doi: 10.1038/nmeth.3776. [DOI] [PubMed] [Google Scholar]
- 3.Hein MY, et al. A human interactome in three quantitative dimensions organized by stoichiometries and abundances. Cell. 2015;163:712–723. doi: 10.1016/j.cell.2015.09.053. [DOI] [PubMed] [Google Scholar]
- 4.Huttlin EL, et al. The BioPlex Network: A Systematic Exploration of the Human Interactome. Cell. 2015;162:425–440. doi: 10.1016/j.cell.2015.06.043. [DOI] [PMC free article] [PubMed] [Google Scholar]
- 5.Rolland T, et al. A proteome-scale map of the human interactome network. Cell. 2014;159:1212–1226. doi: 10.1016/j.cell.2014.10.050. [DOI] [PMC free article] [PubMed] [Google Scholar]
- 6.Wan C, et al. Panorama of ancient metazoan macromolecular complexes. Nature. 2015;525:339–344. doi: 10.1038/nature14877. [DOI] [PMC free article] [PubMed] [Google Scholar]
- 7.Dreze M, et al. High-quality binary interactome mapping. Methods in enzymology. 2010;470:281–315. doi: 10.1016/S0076-6879(10)70012-4. [DOI] [PubMed] [Google Scholar]
- 8.Vidal M, Fields S. The yeast two-hybrid assay: still finding connections after 25 years. Nature methods. 2014;11:1203–1206. doi: 10.1038/nmeth.3182. [DOI] [PubMed] [Google Scholar]
- 9.Cassonnet P, et al. Benchmarking a luciferase complementation assay for detecting protein complexes. Nature methods. 2011;8:990–992. doi: 10.1038/nmeth.1773. [DOI] [PubMed] [Google Scholar]
- 10.Nyfeler B, et al. Capturing protein interactions in the secretory pathway of living cells. Proceedings of the National Academy of Sciences of the United States of America. 2005;102:6350–6355. doi: 10.1073/pnas.0501976102. [DOI] [PMC free article] [PubMed] [Google Scholar]
- 11.Eyckerman S, et al. Design and application of a cytokine-receptor-based interaction trap. Nature cell biology. 2001;3:1114–1119. doi: 10.1038/ncb1201-1114. [DOI] [PubMed] [Google Scholar]
- 12.Hart T, et al. High-Resolution CRISPR Screens Reveal Fitness Genes and Genotype-Specific Cancer Liabilities. Cell. 2015;163:1515–1526. doi: 10.1016/j.cell.2015.11.015. [DOI] [PubMed] [Google Scholar]
- 13.Yu H, et al. High-quality binary protein interaction map of the yeast interactome network. Science. 2008;322:104–110. doi: 10.1126/science.1158684. [DOI] [PMC free article] [PubMed] [Google Scholar]
- 14.Oliver S. Guilt-by-association goes global. Nature. 2000;403:601–603. doi: 10.1038/35001165. [DOI] [PubMed] [Google Scholar]
- 15.Uetz P, et al. A comprehensive analysis of protein-protein interactions in Saccharomyces cerevisiae. Nature. 2000;403:623–627. doi: 10.1038/35001009. [DOI] [PubMed] [Google Scholar]
- 16.Vo TV, et al. A Proteome-wide Fission Yeast Interactome Reveals Network Evolution Principles from Yeasts to Human. Cell. 2016;164:310–323. doi: 10.1016/j.cell.2015.11.037. [DOI] [PMC free article] [PubMed] [Google Scholar]
- 17.Havugimana PC, et al. A census of human soluble protein complexes. Cell. 2012;150:1068–1081. doi: 10.1016/j.cell.2012.08.011. [DOI] [PMC free article] [PubMed] [Google Scholar]
- 18.von Mering C, et al. Comparative assessment of large-scale data sets of protein-protein interactions. Nature. 2002;417:399–403. doi: 10.1038/nature750. [DOI] [PubMed] [Google Scholar]
- 19.Smits AH, Vermeulen M. Characterizing Protein-Protein Interactions Using Mass Spectrometry: Challenges and Opportunities. Trends in biotechnology. 2016 doi: 10.1016/j.tibtech.2016.02.014. [DOI] [PubMed] [Google Scholar]
- 20.Sowa ME, et al. Defining the human deubiquitinating enzyme interaction landscape. Cell. 2009;138:389–403. doi: 10.1016/j.cell.2009.04.042. [DOI] [PMC free article] [PubMed] [Google Scholar]
- 21.Venkatesan K, et al. An empirical framework for binary interactome mapping. Nature methods. 2009;6:83–90. doi: 10.1038/nmeth.1280. [DOI] [PMC free article] [PubMed] [Google Scholar]
- 22.Rual JF, et al. Human ORFeome version 1.1: A platform for reverse proteomics. Genome Res. 2004;14:2128–2135. doi: 10.1101/gr.2973604. [DOI] [PMC free article] [PubMed] [Google Scholar]
- 23.Walhout AJ, Vidal M. A genetic strategy to eliminate self-activator baits prior to high-throughput yeast two-hybrid screens. Genome research. 1999;9:1128–1134. doi: 10.1101/gr.9.11.1128. [DOI] [PMC free article] [PubMed] [Google Scholar]
- 24.Mann M, et al. The coming age of complete, accurate, and ubiquitous proteomes. Molecular cell. 2013;49:583–590. doi: 10.1016/j.molcel.2013.01.029. [DOI] [PubMed] [Google Scholar]
- 25.Nesvizhskii AI. A survey of computational methods and error rate estimation procedures for peptide and protein identification in shotgun proteomics. Journal of proteomics. 2010;73:2092–2123. doi: 10.1016/j.jprot.2010.08.009. [DOI] [PMC free article] [PubMed] [Google Scholar]
- 26.Nesvizhskii AI. Computational and informatics strategies for identification of specific protein interaction partners in affinity purification mass spectrometry experiments. Proteomics. 2012;12:1639–1655. doi: 10.1002/pmic.201100537. [DOI] [PMC free article] [PubMed] [Google Scholar]
- 27.Smith LM, et al. Proteoform: a single term describing protein complexity. Nature methods. 2013;10:186–187. doi: 10.1038/nmeth.2369. [DOI] [PMC free article] [PubMed] [Google Scholar]
- 28.Boxem M, et al. A protein domain-based interactome network for C. elegans early embryogenesis. Cell. 2008;134:534–545. doi: 10.1016/j.cell.2008.07.009. [DOI] [PMC free article] [PubMed] [Google Scholar]
- 29.Orchard S, et al. Protein interaction data curation: the International Molecular Exchange (IMEx) consortium. Nature methods. 2012;9:345–350. doi: 10.1038/nmeth.1931. [DOI] [PMC free article] [PubMed] [Google Scholar]
- 30.Braun P, et al. An experimentally derived confidence score for binary protein-protein interactions. Nature methods. 2009;6:91–97. doi: 10.1038/nmeth.1281. [DOI] [PMC free article] [PubMed] [Google Scholar]
- 31.Chen YC, et al. Exhaustive benchmarking of the yeast two-hybrid system. Nature methods. 2010;7:667–668. doi: 10.1038/nmeth0910-667. author reply 668. [DOI] [PMC free article] [PubMed] [Google Scholar]
- 32.Caufield JH, et al. A comparison and optimization of yeast two-hybrid systems. Methods. 2012;58:317–324. doi: 10.1016/j.ymeth.2012.12.001. [DOI] [PMC free article] [PubMed] [Google Scholar]
- 33.Cusick ME, et al. Literature-curated protein interaction datasets. Nature methods. 2009;6:39–46. doi: 10.1038/nmeth.1284. [DOI] [PMC free article] [PubMed] [Google Scholar]
- 34.D’Haeseleer P, Church GM. Estimating and improving protein interaction error rates; Proceedings / IEEE Computational Systems Bioinformatics Conference, CSB IEEE Computational Systems Bioinformatics Conference; 2004. pp. 216–223. [DOI] [PubMed] [Google Scholar]
- 35.Hart GT, et al. How complete are current yeast and human protein-interaction networks? Genome biology. 2006;7:120. doi: 10.1186/gb-2006-7-11-120. [DOI] [PMC free article] [PubMed] [Google Scholar]
- 36.Landry CR, et al. Extracting insight from noisy cellular networks. Cell. 2013;155:983–989. doi: 10.1016/j.cell.2013.11.003. [DOI] [PubMed] [Google Scholar]
- 37.Deane CM, et al. Protein interactions: two methods for assessment of the reliability of high throughput observations. Molecular & cellular proteomics: MCP. 2002;1:349–356. doi: 10.1074/mcp.m100037-mcp200. [DOI] [PubMed] [Google Scholar]
- 38.Levy ED, et al. How perfect can protein interactomes be? Science signaling. 2009;2:pe11. doi: 10.1126/scisignal.260pe11. [DOI] [PubMed] [Google Scholar]
- 39.Sprinzak E, et al. How reliable are experimental protein-protein interaction data? Journal of molecular biology. 2003;327:919–923. doi: 10.1016/s0022-2836(03)00239-0. [DOI] [PubMed] [Google Scholar]
- 40.Zarrinpar A, et al. Optimization of specificity in a cellular protein interaction network by negative selection. Nature. 2003;426:676–680. doi: 10.1038/nature02178. [DOI] [PubMed] [Google Scholar]
- 41.Zhong Q, et al. An inter-species protein-protein interaction network across vast evolutionary distance. Molecular systems biology. 2016;12:865. doi: 10.15252/msb.20156484. [DOI] [PMC free article] [PubMed] [Google Scholar]
- 42.Ashburner M, et al. Gene ontology: tool for the unification of biology. The Gene Ontology Consortium. Nature genetics. 2000;25:25–29. doi: 10.1038/75556. [DOI] [PMC free article] [PubMed] [Google Scholar]
- 43.Stumpf MP, et al. Estimating the size of the human interactome. Proceedings of the National Academy of Sciences of the United States of America. 2008;105:6959–6964. doi: 10.1073/pnas.0708078105. [DOI] [PMC free article] [PubMed] [Google Scholar]
- 44.Tompa P, et al. A million peptide motifs for the molecular biologist. Molecular cell. 2014;55:161–169. doi: 10.1016/j.molcel.2014.05.032. [DOI] [PubMed] [Google Scholar]
- 45.Shi Y, et al. A strategy for dissecting the architectures of native macromolecular assemblies. Nature methods. 2015;12:1135–1138. doi: 10.1038/nmeth.3617. [DOI] [PMC free article] [PubMed] [Google Scholar]
- 46.Makowski MM, et al. Cross-linking immunoprecipitation-MS (xIP-MS): Topological Analysis of Chromatin-associated Protein Complexes Using Single Affinity Purification. Molecular & cellular proteomics: MCP. 2016;15:854–865. doi: 10.1074/mcp.M115.053082. [DOI] [PMC free article] [PubMed] [Google Scholar]
- 47.Liu F, et al. Proteome-wide profiling of protein assemblies by cross-linking mass spectrometry. Nature methods. 2015;12:1179–1184. doi: 10.1038/nmeth.3603. [DOI] [PubMed] [Google Scholar]
- 48.Pankow S, et al. F508 CFTR interactome remodelling promotes rescue of cystic fibrosis. Nature. 2015;528:510–516. doi: 10.1038/nature15729. [DOI] [PMC free article] [PubMed] [Google Scholar]
- 49.Ellis JD, et al. Tissue-Specific Alternative Splicing Remodels Protein-Protein Interaction Networks. Mol Cell. 2012;46:884–892. doi: 10.1016/j.molcel.2012.05.037. [DOI] [PubMed] [Google Scholar]
- 50.Buljan M, et al. Alternative splicing of intrinsically disordered regions and rewiring of protein interactions. Curr Opin Struc Biol. 2013;23:443–450. doi: 10.1016/j.sbi.2013.03.006. [DOI] [PubMed] [Google Scholar]
- 51.Yang XP, et al. Widespread Expansion of Protein Interaction Capabilities by Alternative Splicing. Cell. 2016;164:805–817. doi: 10.1016/j.cell.2016.01.029. [DOI] [PMC free article] [PubMed] [Google Scholar]
- 52.Yang X, et al. Widespread Expansion of Protein Interaction Capabilities by Alternative Splicing. Cell. 2016;164:805–817. doi: 10.1016/j.cell.2016.01.029. [DOI] [PMC free article] [PubMed] [Google Scholar]
- 53.Sahni N, et al. Widespread macromolecular interaction perturbations in human genetic disorders. Cell. 2015;161:647–660. doi: 10.1016/j.cell.2015.04.013. [DOI] [PMC free article] [PubMed] [Google Scholar]
- 54.Grossmann A, et al. Phospho-tyrosine dependent protein-protein interaction network. Molecular systems biology. 2015;11:794. doi: 10.15252/msb.20145968. [DOI] [PMC free article] [PubMed] [Google Scholar]
- 55.Woodsmith J, Stelzl U. Studying post-translational modifications with protein interaction networks. Curr Opin Struc Biol. 2014;24:34–44. doi: 10.1016/j.sbi.2013.11.009. [DOI] [PubMed] [Google Scholar]
- 56.Barrera LA, et al. Survey of variation in human transcription factors reveals prevalent DNA binding changes. Science. 2016;351:1450–1454. doi: 10.1126/science.aad2257. [DOI] [PMC free article] [PubMed] [Google Scholar]
- 57.Fuxman Bass JI, et al. Human gene-centered transcription factor networks for enhancers and disease variants. Cell. 2015;161:661–673. doi: 10.1016/j.cell.2015.03.003. [DOI] [PMC free article] [PubMed] [Google Scholar]
- 58.Stelzl U, et al. A human protein-protein interaction network: a resource for annotating the proteome. Cell. 2005;122:957–968. doi: 10.1016/j.cell.2005.08.029. [DOI] [PubMed] [Google Scholar]
- 59.Rual JF, et al. Towards a proteome-scale map of the human protein-protein interaction network. Nature. 2005;437:1173–1178. doi: 10.1038/nature04209. [DOI] [PubMed] [Google Scholar]
- 60.Ewing RM, et al. Large-scale mapping of human protein-protein interactions by mass spectrometry. Molecular systems biology. 2007;3:89. doi: 10.1038/msb4100134. [DOI] [PMC free article] [PubMed] [Google Scholar]
- 61.Kristensen AR, et al. A high-throughput approach for measuring temporal changes in the interactome. Nature methods. 2012;9:907–909. doi: 10.1038/nmeth.2131. [DOI] [PMC free article] [PubMed] [Google Scholar]
- 62.Lee I, et al. Prioritizing candidate disease genes by network-based boosting of genome-wide association data. Genome research. 2011;21:1109–1121. doi: 10.1101/gr.118992.110. [DOI] [PMC free article] [PubMed] [Google Scholar]
- 63.Ruepp A, et al. CORUM: the comprehensive resource of mammalian protein complexes–2009. Nucleic acids research. 2010;38:D497–501. doi: 10.1093/nar/gkp914. [DOI] [PMC free article] [PubMed] [Google Scholar]
- 64.Szklarczyk D, et al. STRING v10: protein-protein interaction networks, integrated over the tree of life. Nucleic acids research. 2015;43:D447–452. doi: 10.1093/nar/gku1003. [DOI] [PMC free article] [PubMed] [Google Scholar]
- 65.Warde-Farley D, et al. The GeneMANIA prediction server: biological network integration for gene prioritization and predicting gene function. Nucleic acids research. 2010;38:W214–220. doi: 10.1093/nar/gkq537. [DOI] [PMC free article] [PubMed] [Google Scholar]
- 66.Ramachandran N, et al. Next-generation high-density self-assembling functional protein arrays. Nature methods. 2008;5:535–538. doi: 10.1038/nmeth.1210. [DOI] [PMC free article] [PubMed] [Google Scholar]