Abstract
Objectives
The aims of the present study are: (1) to analyze the effects of the acoustical environment and the voice style on time dose (Dt_p,) and fundamental frequency (mean fo and standard deviation std_fo), while taking into account the effect of short term vocal fatigue; (2) to predict the self-reported vocal effort from the voice acoustical parameters.
Methods
Ten male and ten female subjects were recorded while reading a text in normal and loud styles, in three rooms - anechoic, semi-reverberant and reverberant –with and without acrylic glass panels 0.5 m from the mouth, which increased external auditory feedback. Subjects quantified how much effort was required to speak in each condition on a visual analogue scale after each task.
Results
(Aim1) In the loud style, Dt_p, fo and std_fo increased. The Dt_p was higher in the reverberant room compared to the other two rooms. Both genders tended to increase fo in less reverberant environments, while a more monotonous speech was produced in rooms with greater reverberation. All three voice parameters increased with short-term vocal fatigue. (Aim2) A model of the vocal effort to acoustic vocal parameters is proposed. The SPL (Sound Pressure Level) contributed to 66% of the variance explained by the model, followed by the fundamental frequency (30%) and the modulation in amplitude (4%).
Conclusions
The results provide insight into how voice acoustical parameters can predict vocal effort. In particular, it increased when SPL and fo increased and when the amplitude voice modulation (std_ΔSPL) decreased.
Keywords: Voice acoustical parameters, Room acoustics, Vocal effort, Vocal fatigue, Speech adjustments
INTRODUCTION
While speech acoustic parameters are strongly related to physiological factors such as vocal tract size, vocal fold length and lung capacity, speakers can adjust their voice to achieve the desired vocal output. This vocal output is affected by various factors such as the type of environment1–2 and interlocutor.3
Fundamental frequency mean (fo) and standard deviation (std_fo) appear to be affected by the room acoustics and in particular by the reverberation time (T30).4 This parameter is the duration required for the space-averaged sound energy density in an enclosure to decrease by 60 dB after the source emission has stopped.4 The effect of the environment on speech acoustics was investigated by Pelegrín-García et al.,1 considering the talker-listener distance. Thirteen male talkers were recorded in four different environments: an anechoic chamber, a lecture hall, a corridor and a reverberant room with reverberation times averaged between 500 Hz and 1000 Hz (T30, 0.5–1 kHz) of 0.04 s, 1.88 s, 2.34 s and 5.38 s, respectively. The parameters analyzed by the authors included phonation time ratio, which is the ratio between the phonation time (total duration of voiced frames) and the running speech time (total duration of the recording without pauses longer than 200 ms) and fo mean and standard deviation. The phonation time ratio changed significantly among rooms. In the anechoic room and the reverberant room, it was higher of about 10 % compared to one in the lecture hall and the corridor. The fo mean and standard deviation decreased with an increase in the reverberation time.
Phonation time (Dt_p) appears to increase under more reverberant conditions, with a consequent increase in vocal fatigue.2 The influence of different acoustic environments on the duration of voicing and silence frames in continuous speech was investigated by Astolfi et al.2 Part of their study involved the analysis of phonation time in percent (Dt_p) from free speech of 5 minutes in duration, which was performed by twenty-two university students in a reverberant room and a semi-anechoic room (T30, 0.5–2 kHz were 7.38 s and 0.11 s, respectively) and by six professors in a reverberant room, a semi-reverberant room and an anechoic room (T30, 0.5–2 kHz were 3.51 s, 1.73 s and 0.05 s, respectively). Although the differences detected by the authors did not reach significance, they found a tendency for speakers in both groups to increase Dt_p with the increase in reverberation.
Several studies have analysed the relationship between voice acoustical parameters and vocal fatigue. Vocal fatigue can be related to laryngeal muscle fatigue and laryngeal tissue fatigue. Laryngeal muscle fatigue, which can cause tension in the vocal folds, is caused by depletion or accumulation of biochemical substances in the muscle fibers. Laryngeal tissue fatigue takes place in non-muscular tissue layers (epithelium, superficial and intermediate layers of the lamina propria) and is caused by changes in molecular structure that result from mechanical loading and unloading.5 Fundamental frequency and fo standard deviation have been found to increase over the course of a work day, as reported by Rantala et al.6 They analysed recordings of 33 female teachers during the first and the last lesson on a normal workday. Each lesson had a duration of 35–45 minutes, while the work day was 5 hours long. They divided the teachers into two categories: subjects with many voice complaints (MC) and subjects with few vocal complaints (FC). The results of the study indicated that some voice features changed during the working day, even if these changes were not monotonic. The most uniform changes were seen in f0, which increased toward the end of the working day (9.7 Hz, p value < 0.001). The magnitude of the f0 increase was larger in the FC subgroup (12.8 Hz, p-value < 0.001). The f0 standard deviation showed a similar tendency.
The first aim of the present study was to analyze the effect of the acoustical environment on time dose and fundamental frequency, while taking into account the effect of short-term vocal fatigue. Based on the literature results, it has been hypothesized that fo means and standard deviations will increase under less reverberant conditions and when the voice becomes fatigued, while phonation time will increase under more reverberant conditions.
Based on the same experiment, Bottalico et al.7 reported the effects of room acoustics, voice style (corresponding to normal and raised levels) and short-term vocal fatigue on Sound Pressure Level centered per subject (ΔSPL) and self-reported vocal effort, control, comfort and clarity. The second aim of the current study was to predict self-reported vocal effort from objective measurements, combining the results of the voice parameters analyzed in this study with the results from Bottalico et al.7 Based on the standard ISO 9921,8 vocal effort can be quantified by means of voice SPL. However, it has been hypothesized that other vocal parameters should also be considered to better predict self-reported vocal effort.
EXPERIMENTAL METHOD
The speech of 20 seated talkers was recorded in three different rooms in the presence of artificial babble noise, with and without acrylic glass panels at 0.5 m from the subjects’ mouths. More details on and the rationale of the experimental method are given in Bottalico et al.7 Speech signals were processed to calculate measures of phonation time (Dt_p) and fundamental frequency (fo).
Subjects, instructions and equipment
Ethics approval for the experiment was granted by the Michigan State University Human Research Protection Program (IRB 13-1149). Twenty students, comprised of ten males and ten females, participated in the experiment. All subjects were aged between 18 and 30 years (mean age 20.8 y), were non-smoking and had self-reported normal speech and hearing.
The subjects were instructed to read a text for approximately 30 s in duration in the presence of artificial babble noise, with and without acrylic glass panels at 0.5 m from the subjects’ mouths. Two different speech styles were used: normal and loud. The instructions given for the styles were as follows: Normal: “Speak in your normal voice”; Loud: “Imagine you are in a classroom and you want to be heard by all of the children”.
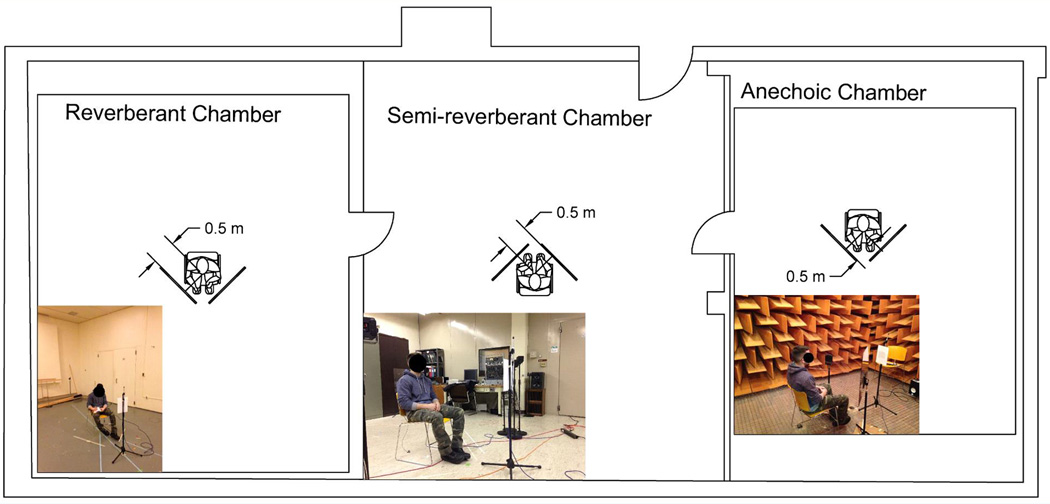
The subjects were recorded in three different rooms: an anechoic room, a semi-reverberant room and a reverberant room. In each room, the subjects were asked to read in four conditions (for a total of 12 tasks): (i) with normal vocal effort and without the presence of the reflective panels; (ii) with loud vocal effort and without the presence of the reflective panels; (iii) with normal vocal effort and in the presence of the reflective panels and (iv) with loud vocal effort and in the presence of the reflective panels. The time separating these tasks was between 15 and 30 s. The experimental setup is shown in Figure 1. With the aim of an equal distribution of vocal fatigue (throughout all of) the tasks across subjects and in order to avoid any other confounding effects of order of administration, the order of administration of the tasks was randomized. With the aim to quantify possible effect of vocal fatigue, the chronological order of tasks administration, which was different for each subject, was considered in the analysis.
FIG. 1.
Experimental setup during the experiment.
Each subject answered several questions after each task. In particular, subjects were asked: “How effortful was it to speak in this condition?” Subjects responded by making a vertical tick on a continuous horizontal line of 100 mm in length (on a visual analogue scale or VAS). The score was measured as the distance of the tick from the left end of the line. The extremes of the scale were ‘not at all’ (left) and ‘extremely’ (right).
Speech was recorded using a head-mounted microphone placed 5–7 cm from the mouth (Glottal Enterprises M80, Glottal Enterprises, Syracuse, NY, U.S.A). The microphone was connected to a PC via an external sound board (Scarlett 2i4 Focusrite, High Wycombe, UK). The signals were recorded with a sampling rate of 44.1 kHz.
Room acoustic parameters
The mid-frequency reverberation time, T30, was 0.04 s (s.d. 0.005) in the anechoic room, 0.78 s (s.d. 0.012) in the semi-reverberant room and 2.37 s (s.d. 0.167) in the reverberant room. To manipulate the level of external auditory feedback in the position of the talker, two reflective acrylic glass panels were placed 0.5 m from the subject. The panels were mounted on stands, located ± 45° from the mouth-axis. Multi-talker children’s babble was emitted using a directional loudspeaker placed 2 m in front of the subject. The power level of the loudspeaker was set in order to obtain an A-weighed equivalent level of 62 dB in the talker position (measured with and Head and Torso Simulator, HATS, averaging the levels from both ears). This level represents the background noise present in a classroom during group activities.9 More details on the room acoustics parameters are given in Bottalico et al.7
Processing of the voice recordings
The voice recordings were processed with MATLAB R2014b (Mathworks, U.S.) and Praat 5.4/5.4.17 (Netherlands). Time dose (Dt) and fo were analyzed. Following the indication of Titze et al.,10 Dt quantifies the total time (in seconds) of vocal fold vibration:
| (1) |
where tp is the performance time and kv is the voicing unit step function (1 for voiced and 0 for unvoiced frames). The percentage of time Dose (Dt_p) was calculated as the percentage of the total period of vocal fold vibration (voicing time) over the total monitoring time.
The fundamental frequency, fo, was extracted with a frame of 0.05 s using Praat. The algorithm performed an acoustic periodicity detection on the basis of an accurate autocorrelation method. This method is more accurate, noise-resistant and robust than other methods based on the cepstrum or combs, or the original autocorrelation methods.11
The step function kv was determined by means of Praat using two different criteria: (1) a lower bound of 75 Hz and an upper bound of 500 Hz for the fo, (2) and a voicing threshold (equal to 0.45 relative to the global maximum amplitude) and silence threshold (equal to 0.03 relative to the global maximum amplitude). A frame was rated as unvoiced if it had an intensity below the voicing threshold or a local peak below the silence threshold. For each sequence of the fo values extracted from the voiced frames, the mean and the standard deviation (std_fo) were calculated.
Statistical method
Statistical analysis was conducted using R version 3.1.2.12 Linear mixed models (LMEs) fit by restricted maximum likelihood (REML) were built using lme413, lmerTest14 and multcomp15 packages. Nested models were compared on the basis of the Akaike information criterion16 and likelihood ratio tests. Random effect terms were chosen on the basis of variance explained. Tukey’s post-hoc pair-wise comparisons17 with single-step correction were performed to examine the differences between all levels of the fixed factors of interest.
The model output included estimates of fixed effects coefficients, standard error associated with the estimate, degrees of freedom, df, the test statistic, t and the p value. The Satterthwaite method18 was used to approximate degrees of freedom and calculate p values.
The relaimpo package19 was used to assess the relative importance of the predictor in the linear models. Relative importance was performed using the metric lmg (R2 partitioned by averaging over orders).19
RESULTS
First, the effect of room acoustics, voice style and chronological task order, or “experimental presentation order,” on time dose and fundamental frequency will be examined. Next, the extent to which the objective vocal parameters (SPL, time dose and fundamental frequency) predict the self-reported vocal effort will be discussed. These parameters were chosen because they are the main output of vocal dosimeter devices available in the market. The relationship of SPL and self-reported vocal effort with speech style, room acoustics and vocal fatigue, have been presented in Bottalico et al.7 The mean values for the variables Effort (%), ΔSPL (dB), std_ΔSPL(dB), fo (Hz) and std_fo (Hz) for males and females and Dt_p (%) are reported in Table I for the 12 conditions (2 styles, 3 rooms and 2 panels).
Table I.
Mean values in the 12 conditions (2 Styles, 3 Rooms and 2 Panels) for the variables Effort (%), ΔSPL (dB), std_ΔSPL(dB), fo(Hz) and std_fo (Hz) for males and females and Dt_p (%).
| Conditions | Effort | ΔSPL | std_ΔSPL |
fo_ Males |
fo_ Females |
std_fo_ Males |
std_fo_ Females |
Dt_p | ||
|---|---|---|---|---|---|---|---|---|---|---|
| Style | Room | Panel | (%) | (dB) | (dB) | (Hz) | (Hz) | (Hz) | (Hz) | (%) |
| Loud | Anechoic | Absent | 65.2 | 4.7 | 10.7 | 150.9 | 256.7 | 24.4 | 41.9 | 69.5 |
| Loud | Anechoic | Present | 53.5 | 3.8 | 10.8 | 151.8 | 257.2 | 25.6 | 41.7 | 69.4 |
| Loud | Reverb. | Absent | 55.9 | 4.0 | 9.8 | 150.4 | 253.9 | 25.3 | 41.7 | 69.8 |
| Loud | Reverb. | Present | 49.6 | 2.8 | 9.5 | 149.2 | 250.9 | 24.6 | 41.5 | 68.8 |
| Loud | Semireverb. | Absent | 40.1 | 4.3 | 10.6 | 147.7 | 251.5 | 25.6 | 40.4 | 72.1 |
| Loud | Semireverb. | Present | 45.4 | 3.5 | 10.7 | 145.2 | 248.2 | 25.7 | 40.5 | 72.0 |
| Normal | Anechoic | Absent | 28.8 | −3.5 | 8.6 | 119.4 | 213.1 | 19.8 | 36.4 | 66.0 |
| Normal | Anechoic | Present | 24.0 | −4.3 | 8.9 | 117.8 | 217.7 | 21.1 | 40.7 | 65.9 |
| Normal | Reverb. | Absent | 25.7 | −4.3 | 8.2 | 118.8 | 215.1 | 21.6 | 38.0 | 66.3 |
| Normal | Reverb. | Present | 19.8 | −4.9 | 8.1 | 120.9 | 213.8 | 21.9 | 37.4 | 66.5 |
| Normal | Semireverb. | Absent | 25.9 | −3.2 | 8.8 | 116.4 | 212.4 | 21.4 | 34.5 | 67.8 |
| Normal | Semireverb. | Present | 20.0 | −4.1 | 8.8 | 116.5 | 212.3 | 20.5 | 36.1 | 67.9 |
Phonation time in percentage
A linear mixed effect model was fitted with the response variable phonation time in percentage (Dt_p) and the covariates (1) style, (2) room, (3) panel, (4) chronological order of tasks (1–12) and a random effect term (subject). The reference levels were: Normal for the style, Reverberant for the room and the condition without panels. The output of the model is reported in Table II.
Table II.
Linear mixed effect model output for response variable phonation time (Dt_p) fitted by REML. The following four factors are considered: (1) Style, (2) Room, (3) Panel and (4) (chronological task) Order. For the intercept and for each fixed factor, the estimate, the standard error, the degrees of freedom, the test statistic, t and the p value are reported.
| Dt_p | Estimate | Std. Error | df | t value | p value |
|---|---|---|---|---|---|
| (Intercept) | 67.18 | 1.18 | 32 | 57.15 | <0.0001 *** |
| Style Loud | 3.54 | 0.42 | 215 | 8.45 | <0.0001 *** |
| Anechoic Room | −2.34 | 0.51 | 215 | −4.55 | <0.0001 *** |
| Semi-reverberant Room | −2.09 | 0.51 | 215 | −4.07 | <0.0001 *** |
| Panel | −0.10 | 0.42 | 215 | −0.24 | 0.8106 |
| Order | 0.17 | 0.06 | 215 | 2.76 | 0.0064 ** |
Signif. Codes: ’***’<0.001 ’**’<0.01 ’*’<0.05 ’.’<0.1
The estimate of standard deviation for random effect (subject) was 4.5 %, while the residual standard deviation was 3.2 %. The fixed effect coefficient for the intercept was 67.18 %. The estimate for Dt_p in the loud style was 3.54 % higher than that in the normal style. In the anechoic room it was 2.34 % lower than that in the reverberant room, while in the semi-reverberant room it was 2.09 % lower than that in the reverberant room. The estimate for Dt_p in the presence of the panels was 0.1 % lower than that without panels; however, this effect was not statistically significant (p=0.81). The slope of for Dt_p – chronological order was 0.17 %. The full effect over 12 tasks on Dt_p was an increase of 1.85 %.
Tukey’s post-hoc multiple comparisons confirmed that subjects recorded longer phonation times in the reverberant room, while the phonation times accumulated in the anechoic room and the semi-reverberant room were similar (anechoic room – reverberant room: estimate = −2.34 %, z = −4.55, p < 0.0001, semi-reverberant – reverberant room: estimate = −2.09 %, z = −4.07, p = 0.0001; semi-reverberant – anechoic room: estimate = 0.25 %, z = 0.48, p = 0.88).
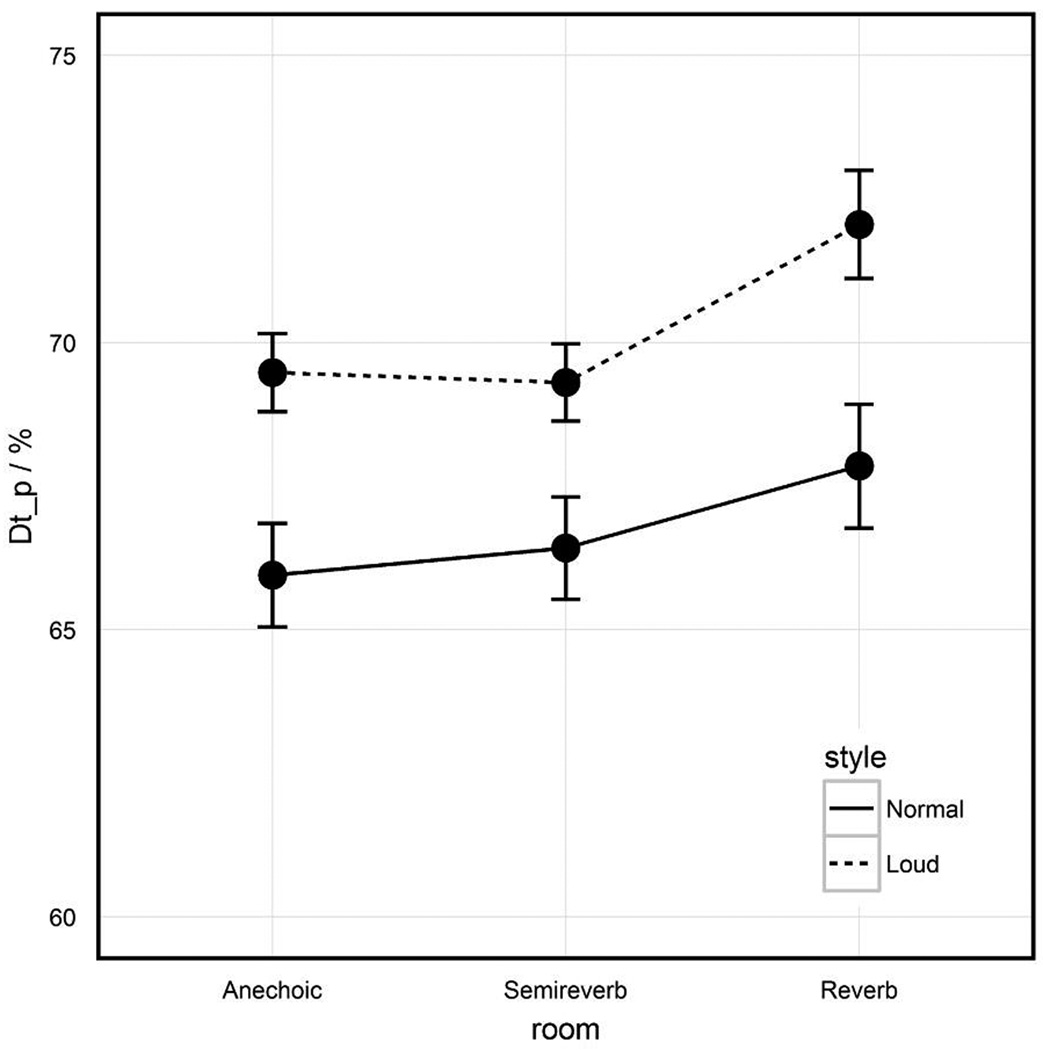
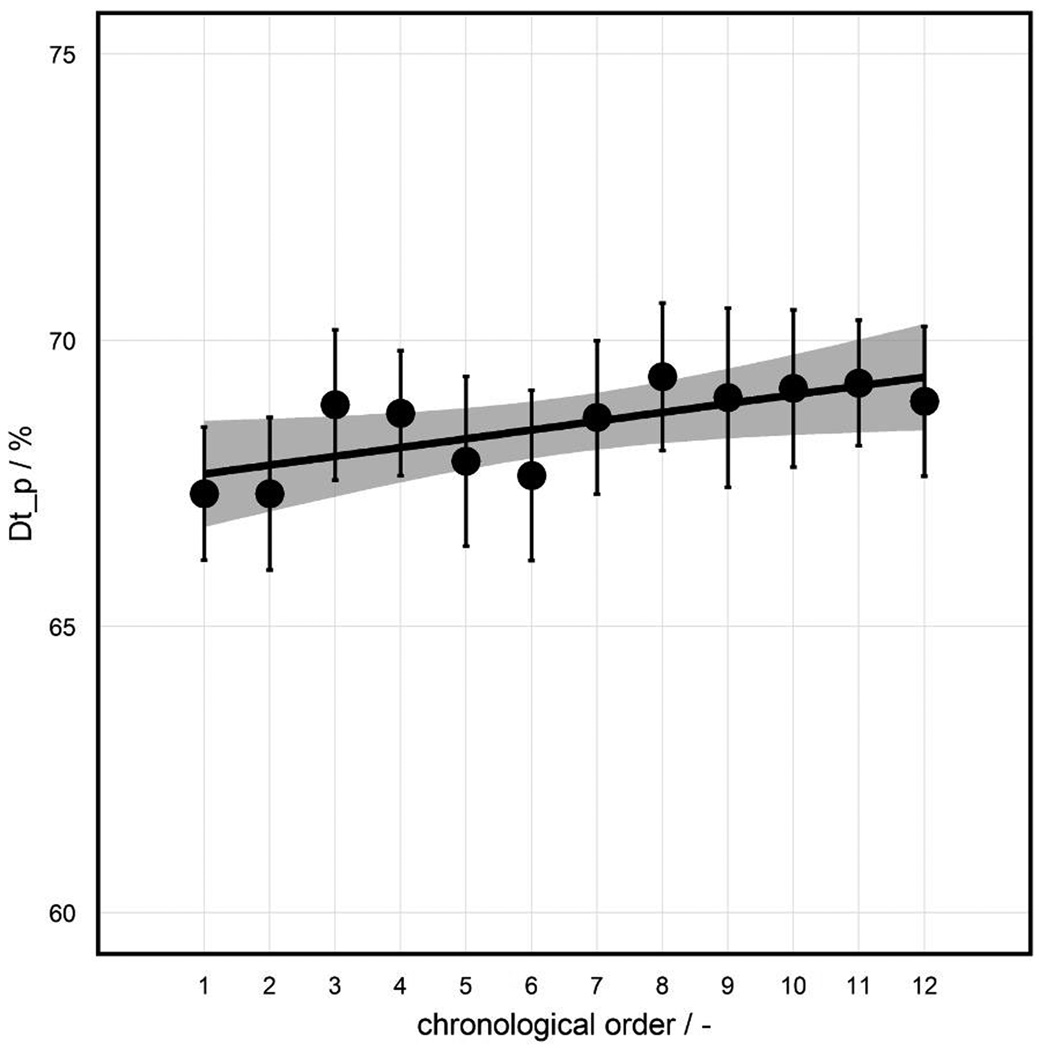
Figure 2 shows the mean and the standard error of Dt_p accumulated by the subjects in the three rooms for the normal and loud styles. The values accumulated in anechoic and semi-reverberant rooms were comparable, while the values accumulated in the reverberant room were significantly higher, especially in the loud style. Figure 3 shows the mean values and the standard errors of the Dt_p accumulated by the subjects over the 12 tasks. The solid line shows the best linear fit and the band represents the 99% confidence intervals. The slop of the line represents the effect of vocal fatigue on Dt_p.
FIG. 2.
Mean Dt_p values accumulated in anechoic, semi-reverberant and reverberant rooms in normal style (solid line) and loud style (dotted line) conditions, with standard errors shown by error bars.
FIG. 3.
Mean Dt_p accumulated over the 12 tasks, with standard errors shown by error bars. The solid line shows the best linear fit and the band represents the 99% confidence intervals.
Fundamental frequency
A linear mixed effect model was fitted with the respons variable fo and the fixed effects terms (1) gender, (2) style, (3) room, (4) panel, (5) chronological order, with interactions of (6) style and gender, (7) style and order and (8) style and panel. The random effect term was subject. The reference levels were: Normal style, Reverberant room, Female and the condition without panels. The output of the model is reported in Table III.
Table III.
Linear mixed effect model output for response variable fo fitted by REML. The following factors are considered: (1) Style, (2) Room, (3) Panel, (4) (chronological task) Order, (5) Gender and the interaction between (6) Style and Gender, (7) Style and Order and (8) Style and Panel. For the intercept, for each fixed factor and interaction, the estimate, the standard error, the degrees of freedom, the test statistic, t and the p value are reported.
| fo | Estimate | Std. Error | df | t value | p value |
|---|---|---|---|---|---|
| (Intercept) | 207.71 | 6.99 | 18 | 29.70 | <0.0001 *** |
| Gender Male | −95.33 | 9.88 | 18 | −9.65 | <0.0001 *** |
| Style Loud | 35.98 | 0.58 | 93812 | 61.87 | <0.0001 *** |
| Anechoic Room | 3.72 | 0.28 | 93811 | 13.39 | <0.0001 *** |
| Semi-reverberant Room | 2.68 | 0.28 | 93811 | 9.70 | <0.0001 *** |
| Order | 0.55 | 0.05 | 93812 | 11.92 | <0.0001 *** |
| Panel | 0.86 | 0.33 | 93811 | 2.60 | 0.0092 ** |
| Style Loud: Gender Male | −8.13 | 0.46 | 93812 | −17.85 | <0.0001 *** |
| Style Loud: Order | 0.66 | 0.07 | 93812 | 10.00 | <0.0001 *** |
| Style Loud: Panel | −2.29 | 0.45 | 93811 | −5.03 | <0.0001 *** |
Signif. Codes: ’***’<0.001 ’**’<0.01 ’*’<0.05 ’.’<0.1
The estimate of the standard deviation of the random effect (subject) was 22.1 Hz, while the residual standard deviation estimate was 34.7 Hz. The fixed effect coefficient for the intercept was 207.7 Hz. The estimate for fo in males was 95.3 Hz lower than that of females. The estimate for fo in the loud style was 36.0 Hz higher than that of the normal style. The estimate for fo in the anechoic room was 3.7 Hz higher than that of the reverberant room, while in the semi-reverberant room was 2.7 Hz higher. The estimate for fo with the inclusion of panels was 0.9 Hz higher than that without panels. The slope of fo – chronological order was 0.6 Hz (indicating an increase in fo of 0.6 Hz for every increase in task number of 1) holding the other variables at their reference level, i.e. in the semi-reverberant room, in the normal style, without panels. The full effect over 12 tasks on fo was a 6.1 Hz increase.
The interactions style-gender, style-order and style-panels were significant. There was a smaller increase in fo (8.1 Hz smaller) in the loud style for males compared to females. A steeper slope in fo (0.7 Hz higher) was found between the tasks in the loud style compared with the normal style. The presence of panels in the loud style was associated with an fo decrease of 1.4 Hz.
Post-hoc comparisons confirmed lower fo values in the reverberant room and there was a statistically significant fo decrease with the increase in reverberation time (anechoic room – reverberant room: estimate = 3.72 Hz, z = 13.39, p < 0.001, semi-reverberant – reverberant room: estimate = 2.68 Hz, z = 9.70, p < 0.001; semi-reverberant – anechoic room: estimate = −1.05 Hz, z = −3.72, p = < 0.001).
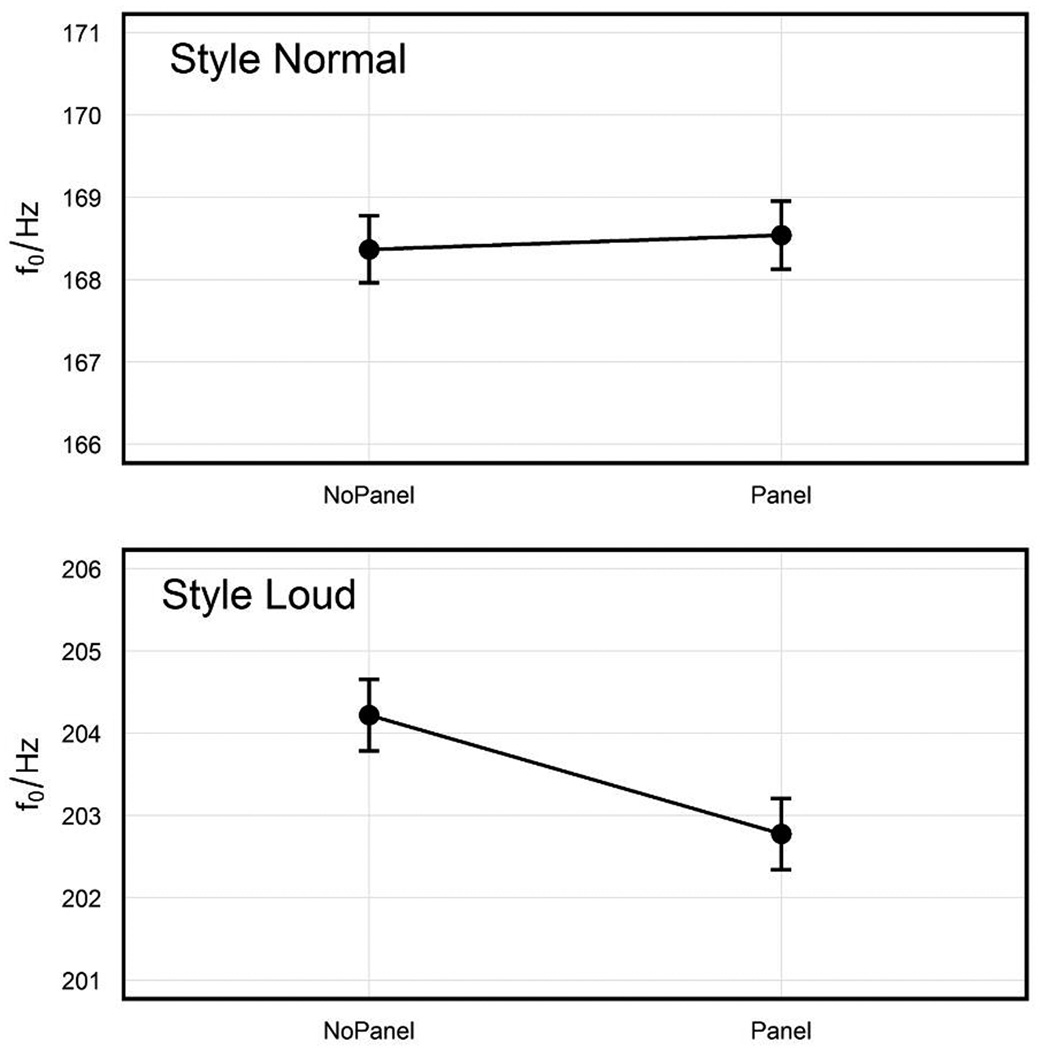
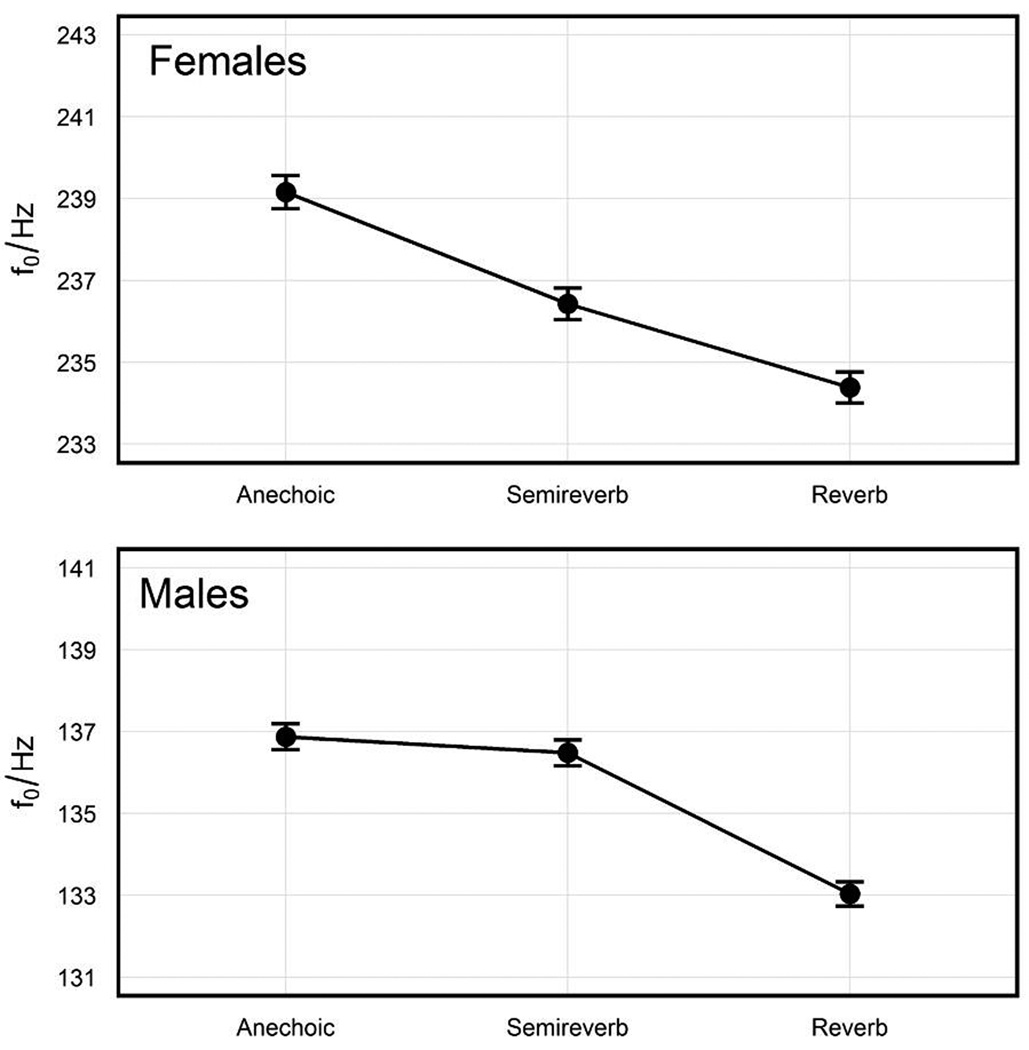
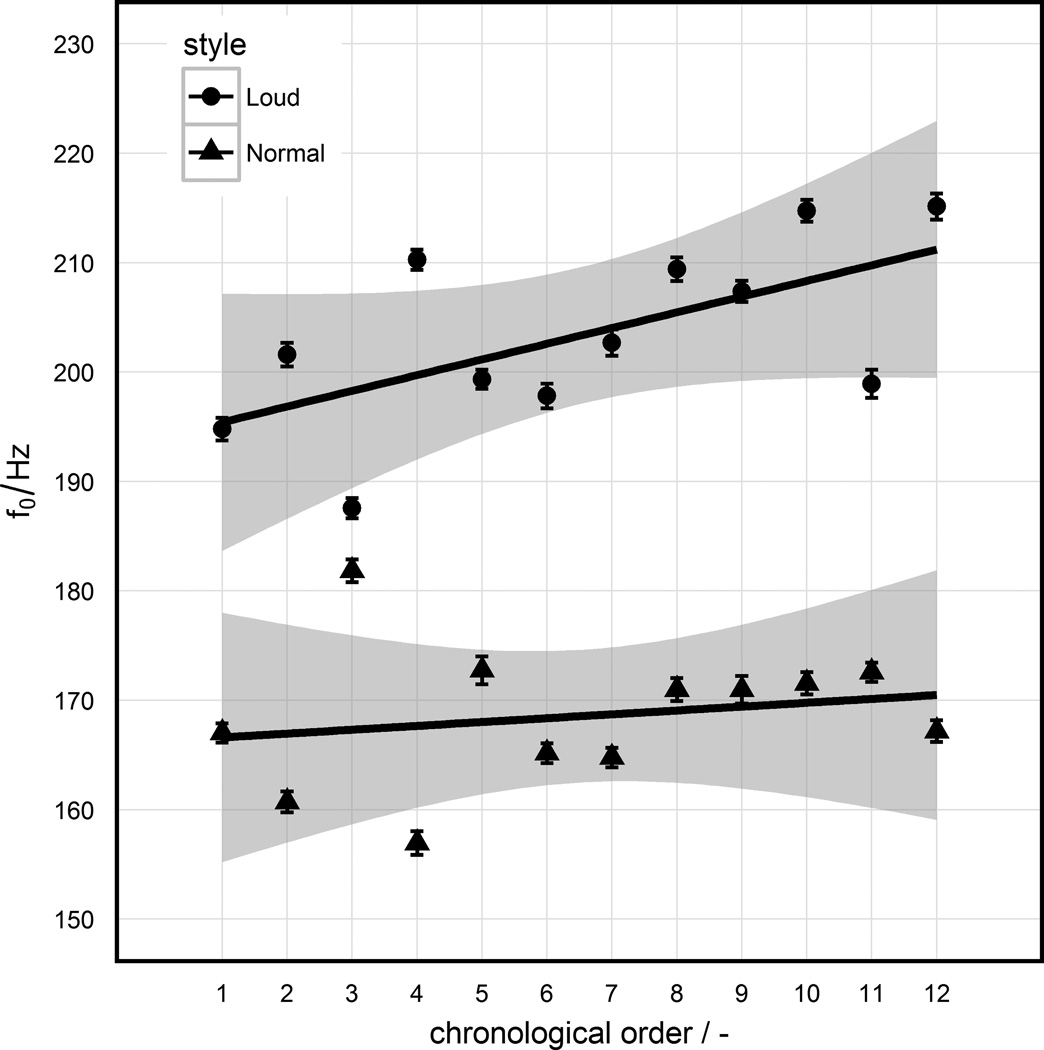
Figure 4 shows the mean values and the standard errors of fo in normal (upper) and loud styles (lower) with and without panels. Higher values of fo were measured in the loud style than in the normal style. The presence of panels did not change the fo in the normal style, while in the loud style lower values were measured when panels were present. Figure 5 displays fo means and standard errors in the three rooms for males and females. There was a decrease in fo with the increase in the reverberation time for both genders; however, fo in the anechoic and semi-reverberant rooms was similar for male subjects. Figure 6 shows fo mean values and standard errors over the 12 tasks in normal and loud styles, respectively. The solid lines show the best linear fit and the band represents the 99% confidence intervals. The slopes of regression lines, representing the effect of vocal fatigue on fo, were 0.35 Hz and 1.44 Hz in normal and loud styles, respectively. The full effect over the 12 tasks on fo was a 3.9 Hz increase in normal style and a 15.8 Hz increase in loud style.
FIG. 4.
Mean fo values recorded with and without reflective panels for normal (upper) and loud (lower) styles, with standard errors shown by error bars.
FIG. 5.
Mean fo values recorded in anechoic, semi-reverberant and reverberant rooms for females (upper) and males (lower), with standard errors shown by error bars.
FIG. 6.
Mean fo values over the 12 tasks in normal and loud style conditions, with standard errors shown by error bars. The solid lines show the best linear fit and the band represents the 99% confidence intervals.
Variation in Fundamental frequency
A linear mixed effect model was fitted with the response variable fo standard deviation (std_fo) and the terms (1) style, (2) gender, (3) order and a random effect term (subject). The reference levels were: Normal style and Female. The output of the model is reported in Table IV.
Table IV.
Linear mixed effect model output for response variable fundamental frequency standard deviation (std_fo) fitted by REML. The following three factors are considered: (1) Style, (2) Gender and (3) (chronological task) Order. For the intercept, for each fixed factor and interaction, the estimate, the standard error, the degrees of freedom, the test statistic, t and the p value are reported.
| std_fo | Estimate | Std. Error | df | t value | p value |
|---|---|---|---|---|---|
| (Intercept) | 35.59 | 2.41 | 19 | 14.80 | <0.0001 *** |
| Style Loud | 4.11 | 0.42 | 218 | 9.84 | <0.0001 *** |
| Gender Male | −16.11 | 3.34 | 18 | −4.82 | <0.0001 *** |
| Order | 0.24 | 0.06 | 218 | 4.04 | <0.0001 *** |
Signif. Codes: ’***’<0.001 ’**’<0.01 ’*’<0.05 ’.’<0.1
The estimate of the standard deviation of the random effect (subject) was 7.4 Hz, while the residual standard deviation was 3.2 Hz. The fixed effect coefficient for the intercept was 35.59 Hz. The estimate for std_fo in the loud style was 4.11 Hz higher than that in the normal style. The estimate for std_fo for males was 16.11 Hz lower than for females. The slope for std_fo – chronological order was 0.24 Hz and the full effect on std_fo over the 12 tasks was a 2.68 Hz increase.
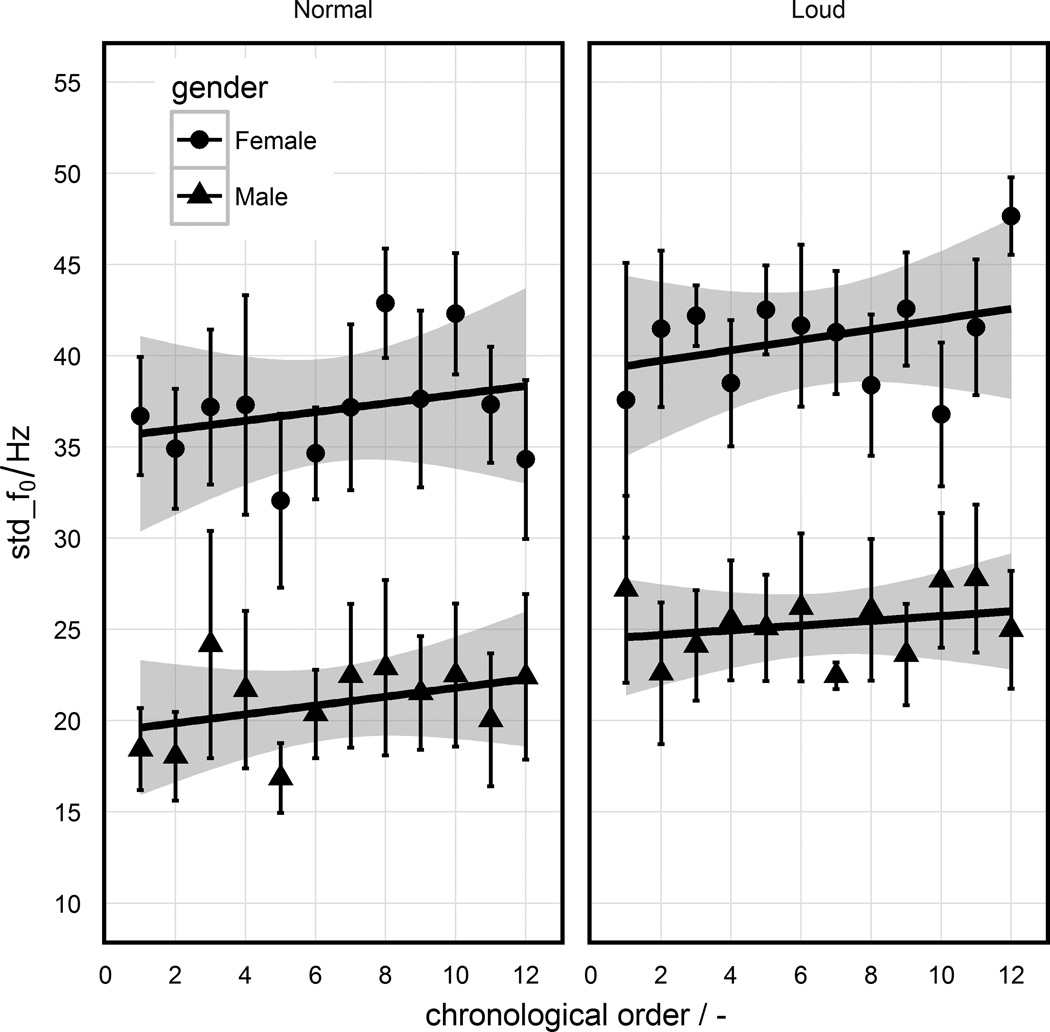
Figure 7 displays, for males and females, the mean values and the standard errors of std_fo over the 12 tasks in the normal and loud style, respectively. The solid lines show the best linear fit and the bands represent the 99% confidence intervals. The slopes of regression lines, representing the effect of vocal fatigue on std_fo, were 0.24 Hz and 0.28 Hz in the normal and loud styles, respectively for females; however, for males they were 0.24 Hz and 0.13 Hz in the normal and loud style, respectively. For females, the full effect of chronological order on std_fo was a 2.64 Hz increase in the normal style and a 3.08 Hz increase in the loud style. For males it was a 2.64 Hz increase in the normal style and a 1.43 Hz increase in the loud style. The magnitude of fo variation was larger for females than males and both genders increased fo variation in the loud style compared to the normal style.
FIG. 7.
Mean std_fo values over the 12 tasks for males and females in normal (left) and loud (right) style conditions, with standard errors shown by error bars. The solid line shows the best linear fit and the band represents the 99% confidence intervals.
Relationship between self-reported vocal effort and voice parameters
A linear mixed effect model was fitted with the response variable effort and the interaction between gender and (1) ΔSPL mean (ΔSPL), (2) ΔSPL standard deviation (std_ΔSPL) and (3) mean fundamental frequency (fo). The output of the model is reported in Table V. The acoustical vocal parameters not statistically significant were not included in the model.
Table V.
Linear mixed effect model output for response variable effort fitted by REML. The following factors are considered: the interaction between gender and (1) ΔSPL mean, (2) ΔSPL standard deviation (std_ΔSPL) and (3) fundamental frequency (fo). For the intercept, for each interaction, the estimate, the standard error, the degrees of freedom, the test statistic, t and the p value are reported.
| Effort | Estimate | Std. Error | df | t value | p value |
|---|---|---|---|---|---|
| (Intercept) | 14.33 | 22.30 | 62 | 0.64 | 0.523 |
| ΔSPL:Gender Female | 2.67 | 0.57 | 138 | 4.73 | <0.001*** |
| ΔSPL:Gender Male | 2.57 | 0.78 | 86 | 3.30 | 0.001** |
| std_ΔSPL:Gender Female | −3.45 | 1.46 | 202 | −2.36 | 0.019* |
| std_ΔSPL:Gender Male | −2.06 | 1.73 | 202 | −1.19 | 0.235 |
| fo:Gender Female | 0.25 | 0.11 | 67 | 2.21 | 0.030* |
| fo:Gender Male | 0.29 | 0.16 | 51 | 1.76 | 0.084. |
Significance Codes: ’***’<0.001 ’**’<0.01 ’*’<0.05 ’.’<0.1
The estimate of the standard deviation of the random effect (subject) was 13.26, while the residual standard deviation was 18.61. The fixed effect coefficient for the intercept was −48.72. The perception of vocal effort increased when the voice parameters ΔSPL and fo increased, while it corresponded to a decrease in voice modulation amplitude (std_ΔSPL).
In order to understand which predictors are more important in the modeling of the self-reported vocal effort, an analysis of the relative importance was performed. A simple linear model was fit with the response variable effort and the terms (1) ΔSPL, (2) std_ΔSPL and (3) fo. The proportion of variance explained by the model was 32% (F-statistic = 37, degree of freedom =236, p-value < 0.001). Using the metric lmg,19 the relative importance of the three predictors was 66% for ΔSPL, 4% for std_ΔSPL and 30% for fo.
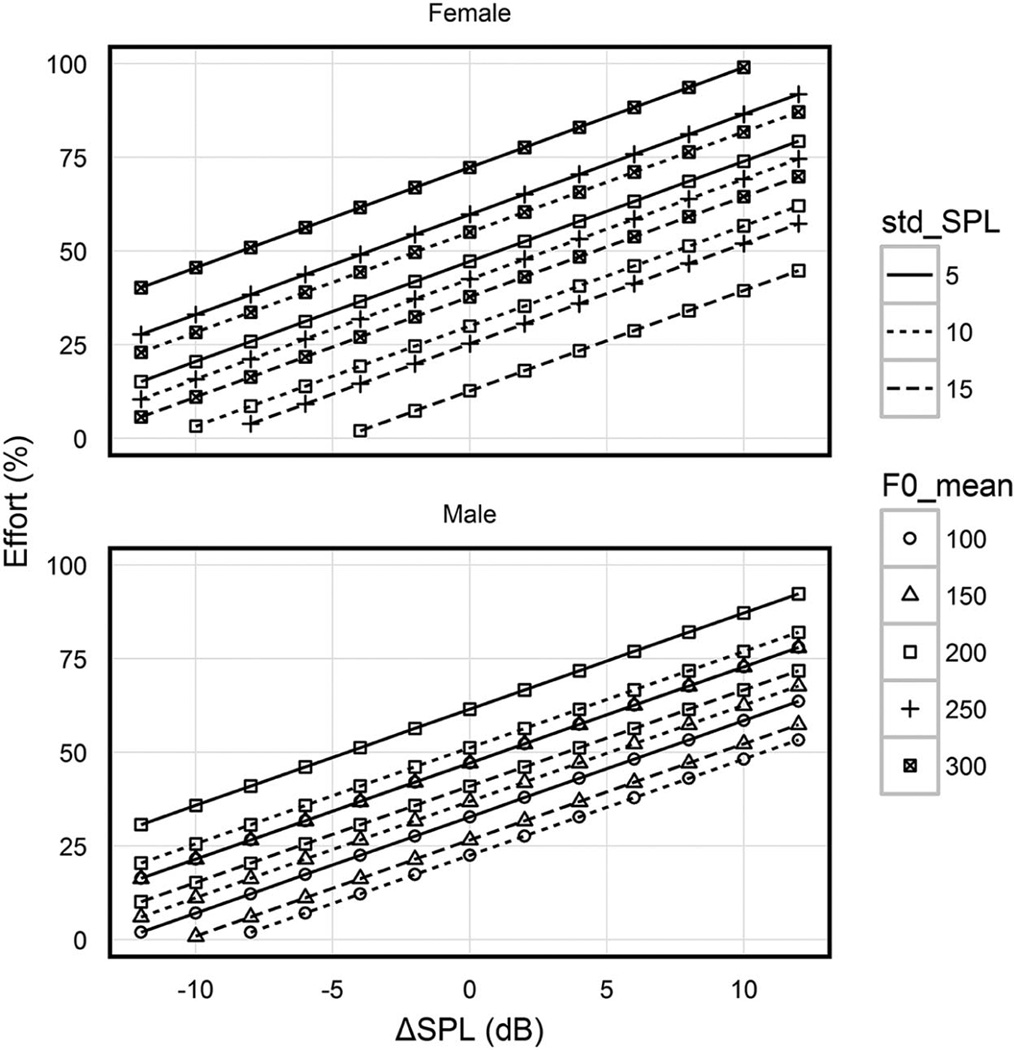
The perception of the vocal effort for gender, as function of ΔSPL, fo and std_ΔSPL is shown in Figure 8. The families of lines correspond to the combinations of three fo and three std_ΔSPL. A low, medium and high value of fo was chosen for males (100 Hz, 150 Hz and 200 Hz) and females (200 Hz, 250 Hz and 300 Hz), as well as a low, medium and high value of std_ΔSPL (5 dB, 10 dB and 15dB).
FIG. 8.
Perception of the vocal effort for gender, as function of ΔSPL, fo and std_ΔSPL. The families of lines correspond to the combinations of three fo and three std_ΔSPL. A low, medium and high value of fo was chosen for males (100 Hz, 150 Hz and 200 Hz) and females (200 Hz, 250 Hz and 300 Hz), as well as a low, medium and high value of std_ΔSPL (5 dB, 10 dB and 15dB).
DISCUSSION
Effect of speech style
The subjects of this study were asked to use two different speech styles: normal and loud. The instructions given for the styles were, “speak in your normal voice” (normal) and “imagine you are in a classroom and you want to be heard by all of the children” (loud).
The Dt_p mean value was higher in the loud style than in the normal style. With an increase in speech level (i.e. in the loud style), it is known that vowels tend to be prolonged and consonants shortened,20 leading to an increase in the number of voiced frames and the time dose.
The fo mean was higher in the loud style than in the normal style for both males and females. In the loud style, higher values of fo occurred, which is consistent with earlier research,21 and could reflect the increase in vocal fold amplitude vibration caused by the increase in lung pressure.5
In the loud style, higher variation in fo (std_fo) was observed for both males and females. In the loud voice, which involves higher lung pressure than the normal voice, less cricothyroid and thyroarytenoid muscle activity is required to achieve the same fo.5 Hence, with the same level of muscle activity, a larger magnitude of variation of fo is obtained in the loud style.
Effect of room acoustics
The Dt_p mean values increased together with the reverberation time. A similar trend was found by Astolfi et al.2, although in the present study higher Dt_p values were observed. In this study, the speech material was a read text, while Astolfi et al.2 used free speech. This difference in the speech material may have caused the differences in the range of Dt_p values.
The fo mean values decreased when the reverberation time increased. Both genders tended to increase fo in less reverberant environments, confirming the findings of Pelegrín-García et al.1 A difference between fo values in reverberant and anechoic rooms of 4–5 Hz was found in both studies. A more monotonous speech was produced in more reverberant rooms.
Effect of short term vocal fatigue
In the statistical models, the effect of the chronological order of the tasks, from task 1 to task 12, was evaluated. All three voice parameters (Dt_p, fo and std_fo) were shown to increase with chronological task order, which indicated an effect of vocal fatigue.
Rantala et al.6 reported that teachers demonstrated a decrease in Dt_p between the first and the last lesson within a single day by 0.8 %. Over 240 s of recording, voicing occurred for 80.6 s and 78.6 s, during the first and the last lesson, respectively. However, this result was not statistically significant. In the current study, the subjects accumulated longer time doses. Rantala et al.6 also found an increase between the first and last lesson in both fo and std_fo, which is consistent with the results of the present study.
The quantification of the vocal fatigue is still an open research topic today; different approaches have been used in the literature. Titze et al.22 studied the distributions of occurrences and accumulations of voicing and silence periods. They recognized that it is necessary to determine what rest period duration has a profound effect on vocal fatigue recovery. Boucher23 analysed the correlation between acoustic parameters and estimates of muscle fatigue using electromyography. He found that a brief rise in voice tremor corresponded to a critical change in laryngeal muscle tissues, which can be considered as a condition where continued vocal effort can increase the risk of lesions or others conditions affecting voice.
Titze4 hypothesized that an increase in vocal tissue viscosity occurs with vocal fatigue. Changes in the composition of fluids within the vocal folds can be caused by high vocal loads and these changes can result in higher fold viscosity and stiffness. According to Titze,5 increased tissue viscosity should result in proportionally greater friction and heat dissipation during vocal fold vibration. This reduction in phonatory efficiency would result in a requirement for greater energy input in order to initiate and sustain oscillation of the folds, i.e., higher phonation threshold pressure.
The hypothesis of Titze5 is consistent with findings of increasing time dose and fo values co-occurring with increased fatigue. The higher phonation threshold pressure, occurring with fatigue, will involve a longer damping of the vocal fold oscillation and an increased rate of vibration. A longer damping of vocal fold oscillation may result in a longer time dose while an increased rate of vibration may result in an increase in fo.
The present results can also be interpreted according to compensatory reactions to alterations in the voice. In the Introduction it was stated that speakers can adjust their voice to achieve the desired vocal output. The sensation of vocal fatigue and the related physiological changes in the vocal folds could cause compensatory hyperfunctional behavior. This behavior generally involves an increase in fold vibration and in the glottal adductory forces.24
Relationship between self-reported vocal effort and voice parameters
As it was hypothesized, the voice SPL strongly influenced the self-reported vocal effort, but it is not the only parameter that should be considered to assess vocal effort. The self-reported vocal effort was also influenced by the fundamental frequency and modulation in amplitude. As expected, the vocal parameter with the strongest influence on the effort was SPL, which contributed to 66% of the variance explained by the model, followed by fundamental frequency (30%) and modulation in amplitude (4%).
The perception of vocal effort increased when ΔSPL and fo increased. A similar result was found by Pelegrín-García et al.1 pertaining to the vocal effort introduced by change in talker-to-listener distance. Higher values of vocal effort have been associated with smaller variability in SPL. It can be argued that speech type, characterized by more fluctuation in amplitude, is associated to a lower perception of the vocal effort because the fluctuation allows for rest periods during speech.
The family of lines presented in Figure 8 can be used to estimate the vocal effort of talkers, starting from the SPL, the fo and standard deviation of SPL. These results can be interpreted and used by clinicians to give appropriate treatment recommendations to reduce vocal effort. As an example based on these results, if a female teacher during the lesson is talking with an SPL 6 dB higher than her typical voice intensity, with a mean fundamental frequency of 300 Hz, her self-reported vocal effort (ranging from 0% = not at all effortful to 100% = extremely effortful) will be equal to 88 % if her intensity modulation is 5 dB, 71% if it is 10 dB and 54% if it is 15. If the same teacher has a very low intensity modulation (for example 5 dB) and she is not able to modify that vocal behavior, the clinician can instruct her to lower her fundamental frequency. If the woman is able to change her fundamental frequency from 300 Hz to 200 Hz, her vocal effort would change from 88% to 63%.
CONCLUSIONS
The first aim of the present study was to analyze the effect of speech style and the acoustical environment on time dose and fundamental frequency, while taking into account the effect of short term vocal fatigue.
When subjects increased their voice levels, the three parameters analyzed (Dt_p, fo and std_fo) increased. It can be argued that the increases are associated with the tendency to prolong vowels in order to increase the voice power and to increase vocal fold amplitude vibration caused by the increase in lung pressure. Moreover, while using the loud voice, less cricothyroid and thyroarytenoid muscle activity is required to achieve the same f0.5 Hence, with the same level of muscle activity, a larger magnitude of variation in f0 is obtained in the loud style.
The talkers changed their speech differently in different reverberation times. With a goal of maintaining intelligibility, they increased the vowels duration in a more reverberant environment while they increased the articulation in a drier environment.
Short-term vocal fatigue was estimated by means of the changing in the voice over time, independently from the other conditions. The results are consistent with the hypothesis of Titze5 regarding the increase of phonation threshold pressure with the vocal fatigue.
The current study is in agreement with Titze5 in that increases in time dose and f0 values co-occur with an increase in vocal fatigue. The higher phonation threshold pressure, occurring with fatigue, will involve a longer damping of the vocal fold oscillation and an increased rate of vibration. A longer damping of the vocal fold oscillation may result in a longer time dose, while an increased rate of vibration may result in an increase in f0.
The second aim of the study is to understand which vocal parameters can predict self-reported vocal effort. The vocal parameter with the strongest influence on the effort is SPL, which contributes to 66% of the variance explained by the model, followed by fundamental frequency (30%) and modulation in amplitude (4%). The perception of vocal effort increased when the two voice parameters ΔSPL and fo increased and when the amplitude voice modulation (std_ΔSPL) decreased.
The limitations of this paper include a small sample size, the atypical environments and the fact that all the subjects were young and healthy. Future experiments should be conducted in more typical environments such as classrooms. Furthermore, a larger sample size should be used, including those with voice disorders.
Acknowledgments
The author would like to thank the members of the Voice Biomechanics and Acoustics Laboratory, Michigan State University and in particular Prof. E. J. Hunter Dr. S. Graetzer for their assistance. Additionally, he would like to express his gratitude to the subjects involved in the experiment. This research was funded by the National Institute on Deafness and other Communication Disorders of the National Institutes of Health under Award Number R01DC012315. The content is solely the responsibility of the authors and does not necessarily represent the official views of the National Institutes of Health.
Footnotes
Publisher's Disclaimer: This is a PDF file of an unedited manuscript that has been accepted for publication. As a service to our customers we are providing this early version of the manuscript. The manuscript will undergo copyediting, typesetting, and review of the resulting proof before it is published in its final form. Please note that during the production process errors may be discovered which could affect the content, and all legal disclaimers that apply to the journal pertain.
REFERENCES
- 1.Pelegrín-García D, Smits B, Brunskog J, Jeong C. Vocal effort with changing talker-to-listener distance in different acoustic environments. J Acoust Soc Am. 2011;129(4):1981–1990. doi: 10.1121/1.3552881. [DOI] [PubMed] [Google Scholar]
- 2.Astolfi A, Carullo A, Pavese L, Puglisi GE. Duration of voicing and silence periods of continuous speech indifferent acoustic environments. J Acoust Soc Am. 2015;137(2):565–579. doi: 10.1121/1.4906259. [DOI] [PubMed] [Google Scholar]
- 3.Hazan V, Baker R. Acoustic-phonetic characteristics of speech produced with communicative intent to counter adverse listening conditions. J Acoust Soc Am. 2011;130(4):2139–2152. doi: 10.1121/1.3623753. [DOI] [PubMed] [Google Scholar]
- 4.ISO 3382-2. Acoustics — Measurement of Room Acoustic Parameters, Part 2: Reverberation Time in Ordinary Rooms. Genève: International Organization for Standardization; 2008. [Google Scholar]
- 5.Titze IR. Principle of voice production. Second Printing. Iowa City: National Center for Voice and Speech; 2000. pp. 229–233.pp. 361–366. [Google Scholar]
- 6.Rantala L, Vilkman E, Bloigu R. Voice changes during working: subjective complaints and objective measurements for female primary and secondary schoolteachers. J Voice. 2002;16(4):344–355. doi: 10.1016/s0892-1997(02)00106-6. [DOI] [PubMed] [Google Scholar]
- 7.Bottalico P, Graetzer S, Hunter EJ. Effects of speech style, room acoustics and vocal fatigue on vocal effort. J Acoust Soc Am. 2016;139(5):2870–2827. doi: 10.1121/1.4950812. [DOI] [PMC free article] [PubMed] [Google Scholar]
- 8.ISO 9921. Ergonomics — Assessment of speech communication. Genève: International Organization for Standardization; 2003. [Google Scholar]
- 9.Shield B, Dockrell J. External and internal noise surveys of London primary schools. J Acoust Soc Am. 2004;115(2):730–738. doi: 10.1121/1.1635837. [DOI] [PubMed] [Google Scholar]
- 10.Titze IR, Švec JG, Popolo PS. Vocal Dose Measures: Quantifying Accumulated Vibration Exposure in Vocal Fold Tissues. J Speech Lang. Hear Res. 2003;46(6):919–932. doi: 10.1044/1092-4388(2003/072). [DOI] [PMC free article] [PubMed] [Google Scholar]
- 11.Boersma P. Accurate short-term analysis of the fundamental frequency and the harmonics-to-noise ratio of a sampled sound. Proceeding of the Institute of Phonetic Sciences. Amsterdam, Netherlands: 1993. [Google Scholar]
- 12.R Development Core Team. R Foundation for Statistical Computing. Vienna, Austria: 2011. [Accessed Sept 23, 2016]. R: A language and environment for statistical computing. http://www.R-project.org. [Google Scholar]
- 13.Bates D, Maechler M, Bolker B, Walker S. lme4: Linear mixed-effects models using Eigen and S4. [Accessed Sept 23, 2016];R package version 1.1-7. 2014 https://cran.r-project.org/web/packages/lme4/ [Google Scholar]
- 14.Kuznetsova A, Brockhoff PB, Christensen RHB. lmerTest: Tests in linear mixed-effects models. [Accessed Sept 23, 2016];R package version 2.0-20. 2014 https://cran.r-project.org/web/packages/lmerTest/ [Google Scholar]
- 15.Hothorn T, Bretz F, Westfall P, Heiberger RM, Schuetzenmeister A, Scheibe S. multcomp: Simultaneous Inference in General Parametric Models. [Accessed Sept 23, 2016];R package version 1.4-6. 2016 https://cran.r-project.org/web/packages/multcomp/ [Google Scholar]
- 16.Akaike H. A new look at the statistical model identification. IEEE transactions on automatic control. 1974;19(6):716–723. [Google Scholar]
- 17.Tukey JW. Components in regression. Biometrics. 1951;7(1):33–69. [PubMed] [Google Scholar]
- 18.Satterthwaite FE. An approximate distribution of estimates of variance components. Biometr. Bull. 1946;2(6):110–114. [PubMed] [Google Scholar]
- 19.Grömping U. Relative importance for linear regression in R: the package relaimpo. J Stat Softw. 2006;17(1):1–27. [Google Scholar]
- 20.Fonagy I, Fonagy J. Sound pressure level and duration. Phonetica. 1966;15:14–21. [Google Scholar]
- 21.Lieberman P, Knudson R, Mead J. Determination of the rate of change of fundamental frequency with respect to subglottal air pressure during sustained phonation. J Acoust Soc Am. 1969;45:1537–1543. doi: 10.1121/1.1911635. [DOI] [PubMed] [Google Scholar]
- 22.Titze IR, Hunter EJ, Švec JG. Voicing and silence periods in daily and weekly vocalizations of teachers. J Acoust Soc Am. 2007;121(1):469–478. doi: 10.1121/1.2390676. [DOI] [PMC free article] [PubMed] [Google Scholar]
- 23.Boucher VJ. Acoustic correlates of fatigue in laryngeal muscles: findings for criterion-based prevention of acquired voice pathologies. J Speech Lang Hear Res. 2008;51:1161–1170. doi: 10.1044/1092-4388(2008/07-0005). [DOI] [PubMed] [Google Scholar]
- 24.Villkman E, Lauri E-R, Alku P, Sala E, Sihvo M. Effects of prolonged oral reading on F0, SPL, subglottal pressure and amplitude characteristics of glottal flow waveforms. J Voice. 1999;13(2):303–312. doi: 10.1016/s0892-1997(99)80036-8. [DOI] [PubMed] [Google Scholar]


