Abstract
Interleukin 1 beta (IL-1β) is a pro-inflammatory cytokine that plays a major role in inflammatory diseases as well as cancer. The inflammatory response after Toll-like receptor (TLR) 4 activation is tightly regulated through phosphorylation of MAP kinases, including p38 and JNK pathways. The activation of MAP kinases is negatively regulated by MAPK phosphatases (MKPs). MKP-1 preferentially dephosphorylates p38 and JNK. IL-1β is regulated through the activation of MAPK, including p38 as well as several transcription factors. The oxygen-sensitive transcription factor HIF-1α is a known transcription factor for several inflammatory cytokines including IL-1β and IL-6. Here, we report that MKP-1 regulates HIF-1α expression in response to LPS. MKP-1 deficient bone marrow derived macrophages (BMDMs) exhibited increased reactive oxygen species (ROS) production and higher HIF-1α expression. In contrast, the expression of all three isoforms of prolyl hydroxylases (PHDs), which are important in destabilizing HIF-1α through hydroxylation, were significantly decreased in MKP-1 deficient BMDMs. LPS challenge of MKP-1 deficient BMDMs led to a substantial increase in IL-1β production. An inhibitor of HIF-1α significantly decreased LPS mediated IL-1β production both at the transcript and protein levels. Similarly, inhibition of p38 MAP kinase reduced LPS mediated pro-IL-1β and HIF-1α protein levels as well as ROS production in MKP-1 deficient BMDMs. These findings demonstrate a regulatory function for MKP-1 in modulating IL-1β expression through p38 activation, ROS production and HIF-1α expression.
Keywords: DUSPs, MKP-1, p38, HIF-1 α, IL-1 β, Macrophages, BMDMs
1. Introduction
In response to pathogen-associated molecular patterns (PAMPs) or danger-associated molecular patterns (DAMPs) multiple kinase cascades are activated including, mitogen activated protein kinase(s) (MAPKs) [1]. TLRs recognize microbial infections and initiate innate immune responses [2]. The response to LPS is mainly orchestrated by the TLR4 receptor. Docking of LPS to TLR4 recruits the adaptor protein MyD88, which initiates downstream signaling pathways, such as the nuclear factor κB (NF-κB) and mitogen-activated protein kinases (MAPKs), including extracellular signal-regulated kinase (ERK), c-Jun N-terminal kinase (JNK), and p38 [2]. This activates several cytokine including, IL-1β production. MAPK phosphatases (MKPs) dephosphorylate TXY motifs on MAPKs and negatively regulate inflammatory responses. MKP-1, also known as dual specificity phosphatase (DUSP)-1, preferentially dephosphorylates phospho p38 and phospho JNK [3]. MKP-1 controls the expression of numerous inflammatory genes and transcription factors through regulation of p38 and JNK.
IL-1β production in response to TLR activation is tightly regulated through several transcription factors. The oxygen-sensitive hypoxia-inducible factor (HIF)-1α is a critical transcriptional regulator for several inflammatory cytokines, including IL-1β and IL-6 [4–6]. During hypoxia, cytosolic HIF-1α is hydroxylated by prolyl-hydroxylases (PHD) providing a target for polyubiquitination and degradation via the von Hippel-Lindau (VHL) dependent pathway [7]. In addition to hypoxia, a variety of pathogen-derived molecules and inflammatory mediators are able to induce HIF-1α expression under normoxic conditions [6]. Several lines of evidence indicate that TLR4-mediated HIF-1α transcriptional activation is regulated through reactive oxygen species (ROS) [8–10]. Transactivation of HIF-1α is mainly controlled by its post-translational modifications, such as hydroxylation, ubiquitination, acetylation, and phosphorylation. However, it appears that bacterial endotoxins such as LPS also induce HIF-1α at the transcriptional level [5, 6, 11–13]. The LPS-mediated signaling cascade leading to accumulation of HIF-1α and IL-1β production is poorly understood. Activation of several pathways, including PI3 kinase, p38 and GSK3 β have been proposed to regulate HIF-1α [10, 11, 14–16].
In this report, we investigate the role of MKP-1 in LPS-mediated IL-1β production. Using BMDMs derived from wild type (WT) and MKP-1−/− mice, we show that MKP-1 deficient BMDMs exhibit an increased production of IL-1β. This is mechanistically regulated through lower PHDs expression and higher HIF-1α induction in response to LPS. Furthermore, MKP-1 deficient BMDMs exhibit significantly increased mitochondrial and cytoplasmic ROS production.
2. Materials and Methods
2.1. Chemicals and antibodies
LPS was purchased from Invivogen (San Diego, CA). Phospho-specific antibodies against the phosphorylated form of ERK1/2, p38, JNK, as well as total ERK1/2, JNK, and β-actin were purchased from Cell Signaling Technology (Beverly, MA). Total p38 antibody was purchased from Santa Cruz Biotechnology (Santa Cruz, CA). The IL-1 β antibody was purchased from R&D Systems (Minneapolis, MN). The HIF-1α antibody was purchased from Bioss Inc (Woburn, MA). Horseradish peroxidase (HRP)-conjugated anti-mouse and anti-rabbit IgG secondary antibodies were purchased from Cell Signaling Technology, and horseradish peroxidase (HRP)-conjugated anti-goat antibody was purchased from Santa Cruz Biotechnology.
2.2. Mice and Isolation of Bone Marrow Derived Macrophages (BMDMs)
Wild-type (WT) and MKP-1 knockout mice were generated as previously described [17]. Animal studies were approved by the Institutional Committee on Animal Use and Care of the Research Institute at Nationwide Children’s Hospital. BMDMs from mice were prepared as described previously [18]. Briefly, femurs and tibias from 6- to 12-week-old mice were dissected, and the bone marrow was flushed out. Macrophages were cultured with IMDM media containing glutamine, sodium pyruvate, 10% heat-inactivated fetal FBS, 30% L929 conditioned medium, and antibiotics for 5–7 days. BMDMs were re-plated at a density of 2×10⁶ cells/well the day before the experiment.
2.3. Protein extraction and immunoblotting
After the appropriate treatments, cells were washed with PBS and harvested in RIPA buffer (Millipore, Billerica, MA) containing protease inhibitor and anti-phosphatase cocktails, as previously described [19]. Equal amounts of proteins (15 μg) were mixed with the same volume of 2× sample buffer, separated on 10% SDS-polyacrylamide gel electrophoresis and transferred to a polyvinylidene di-fluoride (PVDF) membrane (Bio-Rad, Hercules, CA) at 18V for 1 hour using a semi dry transfer cell (Bio-Rad) as previously described [19]. The PVDF membrane was blocked with 5% dry milk in TBST (Tris-buffered saline with 0.1% Tween-20), rinsed, and incubated with primary antibody overnight. The blots were washed and incubated with HRP-conjugated secondary anti-IgG antibody. Membranes were washed and immunoreactive bands were visualized using a chemiluminescent substrate (ECL-Plus, GE Healthcare, Pittsburgh, PA). Images were captured on Hyblot CL film (Denville Scientific Inc, Metuchen, NJ). Optical density analysis of signals was performed using ImageQuant software (version 5, GE Healthcare).
2.4. Enzyme linked immunosorbent assay (ELISA)
IL-1β cytokine levels in cell culture supernatants were measured using ELISA DuoKits (R&D Systems) as previously described [20].
2.5. Mitochondrial reactive oxygen species measurements
BMDMs were stimulated with LPS (100 ng/mL) in the presence or absence of different inhibitors, Echinomycin (10 nM), SP600125 (20 μM), or SB203850 (10 μM) for 1 h. To measure ROS cells were incubated with 5 μM of CM-H2DCFDA (Invitrogen) for cytoplasmic ROS (cROS) or 1 μM of MitoSOX (Invitrogen) for mitochondrial ROS (mROS) in the dark for 20 min at 37 °C. BMDMs were washed three times in PBS, and immediately re-suspended in live cell imaging media (Invitrogen). CM-H2DCFDA Green fluorescence emission at 530 nm under 495 nm excitation was recorded using a Synergy microplate reader (Biotek, VT). MitoSOX Red fluorescence emission at 595 nm under 510 nm excitation was recorded using a microplate reader [18]. Experiments were performed at least in triplicate. Data presented as relative fluorescence intensity of CM-H2DCFDA or MitoSOX fluorescence.
2.6. RNA Extraction and Quantitative Reverse Transcriptase/Real Time-PCR
Total RNA was extracted using Stat 60 (Iso-Tex Diagnostics, Pearland, TX) and reverse-transcribed using the Reverse Transcription System (Promega, Madison, WI). The primers targeting (IL-1β, HIF-1α, and a reference gene, GAPDH) were used to amplify the corresponding cDNA by using iQ SYBR Green Supermix (Invitrogen). Quantitative analysis of mRNA expression was performed using the MX3000p instrument (Stratagene, La Jolla, CA). PCR amplification was performed in a total volume of 20 μl containing 2 μl of each cDNA preparation and 20 pg of primers (Invitrogen). The PCR amplification protocol was performed as described previously [19]. Relative mRNA levels were calculated after normalizing to GAPDH. The results were expressed as relative fold of change. The following primers were used in the PCR reactions: GAPDH, forward (5′-GTGAACGAGAAGGACTATAACCC-3′) and reverse (5′-GGCTGTGTACCAATGGACTG-3′); IL-1β, forward (5′-CGCAGCAGCACATCAACAAGAGC-3′) and reverse (5′-TGTCCT CATCCTGGAAGGTCCACG-3′); HIF-1α forward (5′-TCAAGTCAGCAACGTGGAG-3′) and reverse (5′-TATCGAGGCTGTGTCGACG-3′); PHD-1 forward (5′-CCGGAGGAAAAAGCT CGCC-3′) and reverse (5′-GGTCCCCAAGTCCACAGTTG-3′); PHD-2 forward (5′-CGC CAAGGTAAGTGGAGGTA-3′) and reverse (5′-TTGCGTACCTTGTGGCGTAT-3′); PHD-3 forward (5′-TGCGGATATTTCCGGAAGGG-3′) and reverse (5′-CATAGCGTACCTGGT GGCAT-3′).
2.7. Statistical analyses
Statistical analyses were performed using SPSS software, version 23.0 (SPSS Inc; Chicago, IL). One way and two way analysis of variance (ANOVA) test and post hoc repeated measure comparisons (least significant difference (LSD) was performed to identify differences between groups. ELISA results were expressed as mean ± SEM. For all analyses a paired two-tailed Student’s test was performed, and p-values of less than 0.05 were considered significant.
3. Results
3.1. MKP-1 deficient BMDMs exhibit higher IL-1β production in response to LPS challenge
IL-1β production is tightly regulated at various levels. Here we studied the effect of MKP-1 deficiency on pro-IL-1β expression, IL-1β transcript and released IL-1β. First, BMDMs derived from WT and MKP-1−/− mice were cultured side by side under equal conditions and challenged with LPS (100 ng/mL) for various time points as indicated. Whole cell lysates were immunoblotted using an antibody against pro IL-1β and equal loading was determined using β-actin antibody (Fig. 1A). The mean densitometric analysis is shown in Figure 1B. MKP-1 deficient macrophages responded to LPS challenge with a significantly higher pro-IL-1β expression (more than 2 fold) as compared to WT BMDMs. Next, we assessed mature IL-1β levels in response to LPS stimulation. BMDMs derived from WT and MKP-1−/− mice were challenged with LPS (100 ng/mL) side by side under equal conditions for 24 h. In response to LPS, MKP-1 deficient BMDMs exhibited increased mature IL-1β levels (Fig. 1C). To determine whether the increase in pro-IL-1β and mature IL-1β levels is associated with an increase in IL-1β transcript, BMDMs from WT and MKP-1 mice were challenged with LPS for 1h and IL-1β mRNA levels were measured using qRT-PCR. As shown in Figure 1D, LPS challenge led to a significant augmentation of IL-1β mRNA levels in MKP-1 deficient BMDMs as compared to WT BMDMs. These results indicate that LPS mediated IL-1β production is significantly enhanced in MKP-1 deficient macrophages at the mRNA, pro IL-1β protein as well as mature IL-1β levels.
Figure 1. MKP-1 deficient BMDMs exhibit enhanced pro-IL-1β expression in response to LPS.
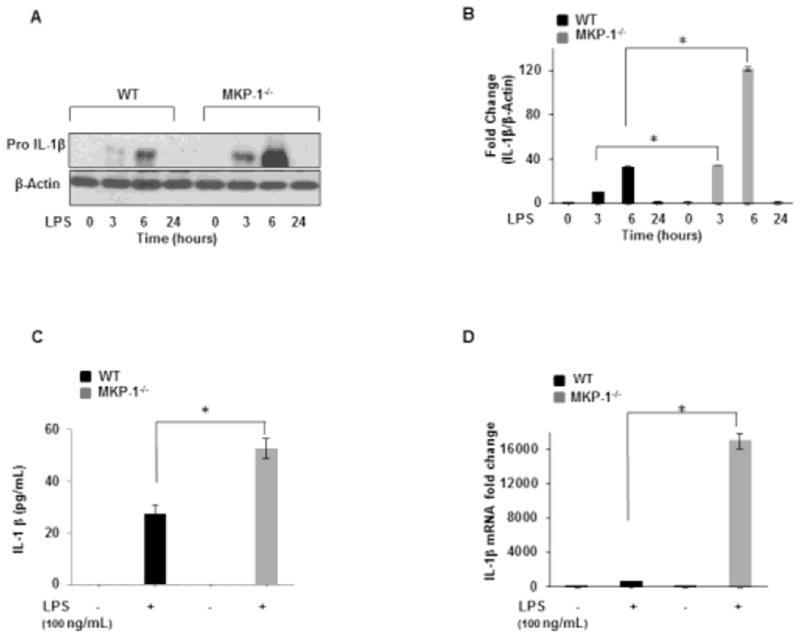
(A) BMDMs isolated from WT and MKP-1−/− mice were challenge with LPS (100 ng/mL) for 3h, 6h, and 24h. Whole cell extracts were prepared and 15 μg of proteins were subjected to SDS-gel electrophoresis and Western blot analysis using antibodies against pro-IL-1β. Equal loading was con rmed using an antibody against β-actin. (B) Densitometric values expressed as fold increase of the ratio of pro-IL-1β/β-actin (n=4). (C) BMDMs derived from WT and MKP-1−/− mice were treated with LPS for 24 h. Conditioned media were analyzed for IL-1β via ELISA. Data are presented as mean ± SEM (n=3), p< 0.001. (D) BMDMs obtained from WT and MKP-1−/− mice were cultured under similar conditions and activated with LPS for 1h. RNA was isolated and subjected to qRT-PCR to measure IL-1β gene expression. Values were normalized to GAPDH and are shown as fold changes. Data presented as mean of at least three independent experiments. Using ANOVA Mann-Whitney U test, a p-value <0.05 was considered significant and error bars indicate SEM.
3.2. LPS mediated p38 and JNK phosphorylation is enhanced in MKP-1 deficient BMDMs
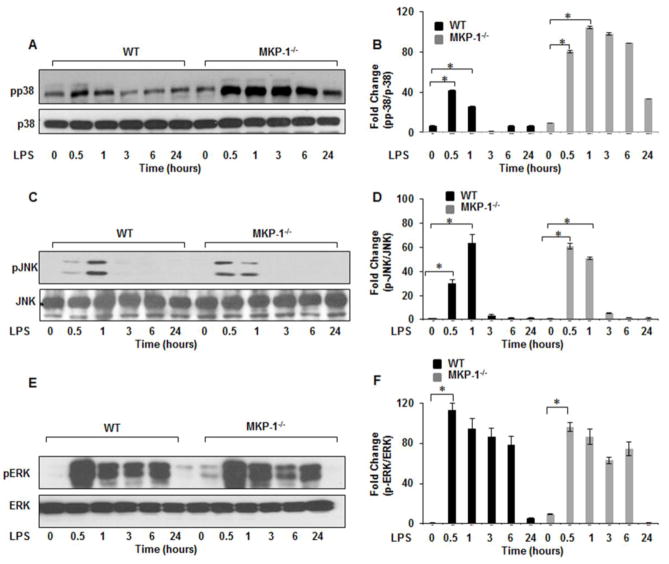
Dual specificity MAP kinase phosphatases play a pivotal role in the feedback regulation of MAP kinases [3]. To investigate the effect of MKP-1 deficiency on the phosphorylation of principal MAP kinases, we assessed the active forms of p38, JNK, and ERK MAP kinases. BMDMs derived from WT and MKP-1−/− mice were cultured side by side and challenged with LPS for various time periods. Whole cell lysates were first immunoblotted with phospho specific antibodies against p38 (Thr180/Tyr182), total p38 was used to confirm equal loading. The mean densitometric analysis of 3 independent experiments of the ratio of phospho p38/p38 is shown in Figure 2B. As shown in Figure 2A&B, MKP-1 deficient BMDMs exhibited a significantly higher p38 phosphorylation in response to LPS challenge as compared to WT BMDMs. Because MKP-1 not only de-phosphorylatesphospho p38 but also phospho JNK [17], we assessed JNK activity in both WT and MKP-1 deficient BMDMs. Whole cell lysates were immunoblotted with specific antibodies against the phosphorylated form of JNK (Thr183/Tyr185) and equal loading was confirmed using total JNK antibodies. The mean densitometric values of the ratio phospho JNK/JNK is shown in Figure 2D. MKP-1−/− BMDMs exhibited a higher phosphorylation of JNK 30 min after LPS challenge. However, the difference in JNK phosphorylation was less pronounced after 1h (Figs. 2C&D). On the other hand, we did not detect any significant differences in phosphorylation of ERK (Thr202/Tyr204) between WT and MKP deficient BMDMs (Figs. 2E&F). These results indicate that MKP-1 plays a major role in de-phosphorylation of pp38 and pJNK but not pERK1/2 in BMDMs in response to LPS challenge.
Figure 2. MKP-1−/− BMDMs exhibit higher p38 and JNK activation in response to LPS.
BMDMs from WT and MKP-1−/− mice were cultured and challenged with LPS (100 ng/mL) for 30 min, 1h, 3h, 6h, and 24h. Whole cell extracts were prepared and subjected to SDS-PAGE and Western blot analysis using phospho-specific antibodies against p38 (Thr180/Tyr182), ERK (Thr202/Tyr204) and JNK (Thr183/Tyr185). Equal loading was con rmed using the corresponding non-phosphorylated antibodies. As shown in (A) MKP-1−/− BMDMs exhibited higher activation of p38 after LPS stimulation as compared to WT. (B) Densitometric values expressed as fold changes of the ratio of phosphorylated p38/total values of p38. (C) Activation of JNK at baseline and after LPS stimulation in MKP-1 deficient mice. MKP-1−/− BMDMs exhibited higher phospho-JNK at baseline with an increase in phosphorylation in response to LPS challenge. (D) Densitometric values expressed as fold increase of the ratio of phosphorylated JNK/total values of JNK. (E) Activation of ERK after LPS stimulation was similar both in WT and MKP-1−/− BMDMs. (F) Densitometric values expressed as fold increase of the ratio of phosphorylated ERK/total values of ERK. All densitometric data represents mean+ SEM of at least 4 independent experiments. * Represents a p value < 0.05.
3.3. MKP-1 deficient BMDMs exhibit higher HIF-1α expression in response to LPS
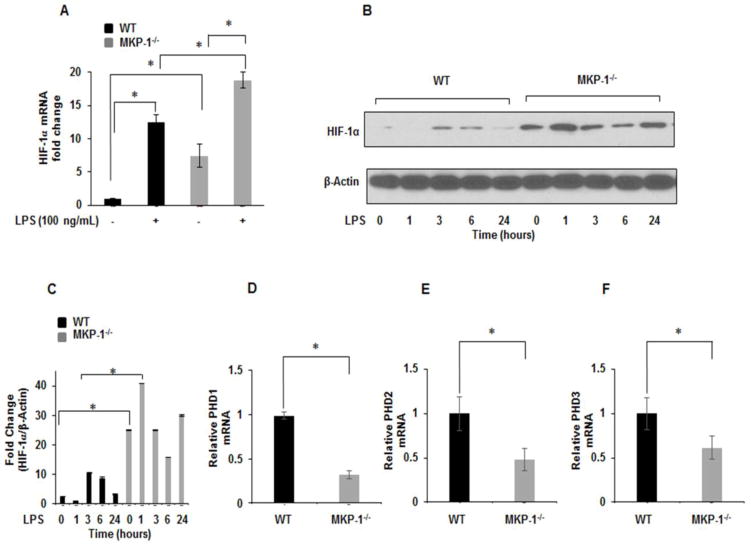
HIF-1α is recognized as the master regulator of the hypoxic response, activating the transcription of numerous genes [21]. Similar to HIF-1α, MKP-1 is a hypoxia responsive gene [13]. To examine the influence of MKP-1 deficiency on HIF-1α expression at the transcript level, BMDMs derived from WT and MKP-1−/− mice were cultured for 1h with and without LPS challenge. Total mRNA was isolated and subjected to qRT-PCR and data normalized to GAPDH. As shown in Figure 3A, basal HIF-1α mRNA levels were significantly increased in MKP-1 deficient BMDMs. LPS challenge led to a further increase in HIF-1α mRNA levels in WT as well as MKP-1 deficient BMDMs. Additionally, when measuring HIF-1α protein expression via immunoblotting we observed a significantly higher expression for HIF-1α protein in MKP-1−/− BMDMs as compared to WT BMDMs both at baseline and after LPS challenge for various time periods (Fig. 3B). Figure 3C shows the mean densitometric values of 4 independent experiments of the ratio HIF-1α/β-actin.
Figure 3. MKP-1−/− BMDMs exhibit higher HIF-1α expression.
(A) BMDMs derived from WT and MKP-1−/− mice were challenged with LPS (100 ng/mL) for 1h. RNA was isolated and subjected to qRT-PCR to measure HIF-1α gene expression. Values were normalized to GAPDH and are shown as fold changes. Data presented as mean of at least three independent experiments. Using ANOVA Mann-Whitney U test, a p value <0.05 was considered significant and error bars indicate SEM. LPS pretreatment significantly induced HIF-1α m-RNA levels in MKP-1−/− BMDMs as compared to WT. (B) WT and MKP-1 deficient macrophages were cultured under similar conditions and challenged with LPS for 1h, 3h, 6h, and 24h. Whole cell extracts were prepared and subjected to SDS-PAGE. Western blot analysis was performed using specific antibodies against HIF-1α, equal loading was confirmed using antibody against β-actin. (C) Densitometric values expressed as fold change of the ratio of HIF-1α/β-actin. Data represent mean + SEM of at least 4 independent experiments. * Represents a p value <0.05. (D–F) PHD 1–3 mRNA expression. Total RNA was isolated from cells and reverse-transcribed using the Reverse Transcription System. The primers targeting PHD1, PHD 2 and PHD3 were used to amplify cDNA using iQSYBR Green Supermix. Relative mRNA levels were calculated by normalizing to GAPDH. Data were analyzed using the paired, two-tailed Student’s t test, and the results were expressed as fold change ± SEM of at least 3 independent experiments * Represents a p value < 0.05.
Prolyl hydroxylases domain protein (PHD) 1–3 hydroxylate prolyl residues on HIF-1α that regulate its degradation by VHL ubiquitination pathway [22]. To further understand the increased expression of HIF-1α in MKP-1 deficient BMDMs, we determined the expression of three isoforms of PHDs (1–3). BMDMs derived from WT and MKP-1−/− were cultured for 1h and mRNA was isolated and subjected to qRT-PCR. As shown in Figures 3D–F; PHD1, PHD2, and PHD3 were significantly decreased in MKP-1 deficient BMDMs. Taken together, the increased levels of HIF-1α mRNA and protein in MKP-1 deficient macrophages at baseline and after LPS stimulation, suggest increased HIF-1α production and increased stability of the protein. This could be explained, at least in part, by decreased levels of all three PHDs in MKP-1 deficient BMDMs.
3.4. MKP-1 deficient BMDMs exhibits higher ROS production
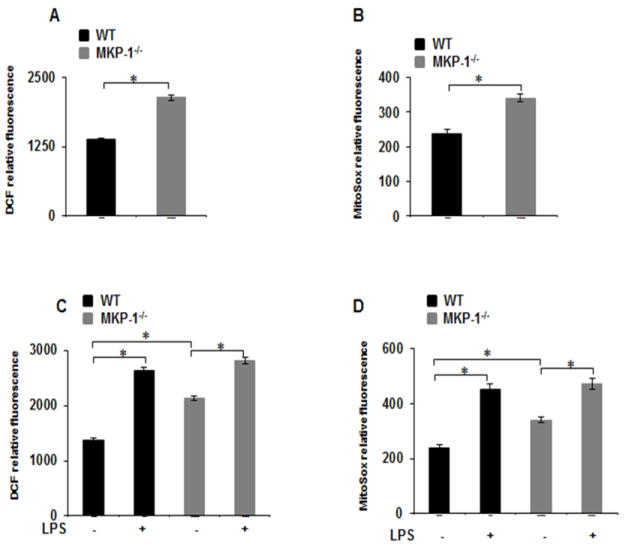
Reactive oxygen species (ROS), including superoxide, hydrogen peroxide (H2O2), and hydroxyl radicals modulate various biological processes and act as signaling molecules [23, 24]. ROS can be generated in the cytosol or via mitochondria and have been implicated in HIF-1α protein degradation or stabilization in response to endotoxin [10, 25–27]. Hence, we hypothesize that increased ROS production in MKP-1−/− macrophages may regulate HIF-1α expression. To address this, BMDMs from MKP-1−/− and WT mice were cultured for 1h in the presence and absence of LPS and evaluated for the production of cytosolic ROS (cROS) or mitochondrial ROS (mROS). A CM-H2DCFDA fluorescence probe was used as an indirect measurement for peroxide production to measure cROS, while the MitoSox fluorescence probe was used to indirectly measure superoxide as an indicator of mROS production[18]. As shown in Figures 4A&B, both cROS and mROS production were significantly increased (2 fold) at the basal level in MKP-1−/− BMDMs. Furthermore, LPS challenge induced ROS production to a similar extent in both WT and MKP-1−/− macrophages (Figs. 4C&D). We found no significant differences in ROS production (cROS and mROS) between WT and MKP-1 after 24h of LPS challenge (Data not shown).
Figure 4. MKP-1−/− BMDMs exhibit higher ROS production as compared to WT BMDMs.
(A&B) Basal ROS production was measured by H2DCFDA and MitoSOX fluorescence intensity in WT and MKP-1−/− BMDMs. ROS production is significantly higher in MKP-1−/− macrophages compared to WT macrophages. (C&D) WT and MKP-1−/− BMDMs were challenged with LPS (100 ng/mL) for 1 h followed by measurement of ROS production using H2DCFDA and MitoSOX fluorescence intensity. LPS challenge induced ROS production to a similar extent in both WT and MKP-1−/− macrophages.
3.5. HIF-1α blockade decreases IL-1β production in response to LPS
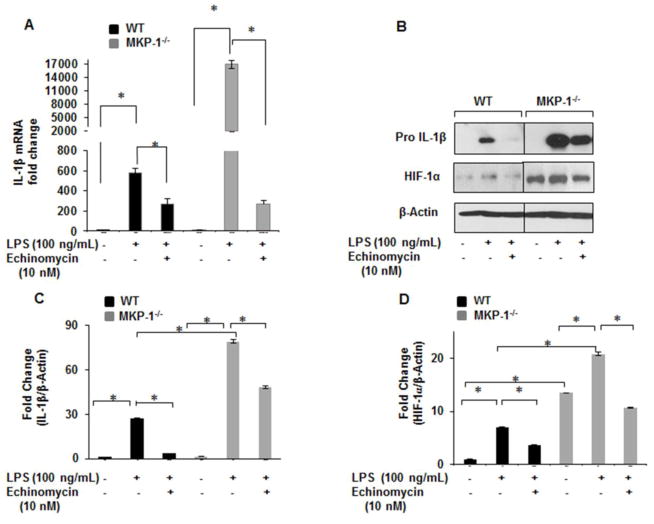
Echinomycin, a cyclic peptide of the family of quinoxaline antibiotics, has been shown to inhibit HIF-1α DNA binding activity and thus expression of its target genes [28]. To investigate whether increased IL-1β production in MKP-1−/− BMDMs is due to increased HIF-1α expression, we assessed the effects of echinomycin on IL-1β and HIF-1α mRNA levels. BMDMs derived from WT and MKP-1−/− mice were treated with echinomycin (10 nM) for 30 min followed by LPS (100 ng/mL) challenge for 1h. Figure 5A shows that LPS mediated IL-1β mRNA induction in MKP-1−/− BMDMs is reduced to basal levels in the presence of echinomycin. In addition, we determined protein levels of pro-IL-1β and HIF-1α after LPS treatment in the presence and absence of echinomycin. Whole cell lysates were obtained after the appropriate treatments and immunoblotted with antibodies against pro-IL-1β and HIF-1α. As shown, LPS mediated pro-IL-1β expression is completely blocked in the presence of echinomycin in WT BMDMs (Fig. 5B). Although we observed a significant reduction (3 fold) in pro-IL-1β in MKP-1−/− BMDMs after LPS challenge, echinomycin did not completely inhibit pro-IL-1β expression (Figs. 5B). Similarly, in the presence of echinomycin LPS mediated HIF-1α expression in MKP-1−/− BMDMs was partially inhibited (Fig. 5B). Figure 5C and D show the densitometric analysis of 3 independent experiments for pro-IL-1β and HIF-1α respectively.
Figure 5. HIF-1α inhibitor blocks LPS mediated IL-1β production in WT and MKP-1−/− BMDMs.
(A) BMDMs derived from WT and MKP-1−/− mice were cultured in the presence or absence of Echinomycin (10 nM) and challenged with LPS (100 ng/mL) for 1h. Total RNA was isolated and subjected to qRT-PCR to measure IL-1β and HIF-1α gene expression. Relative mRNA levels were calculated by normalizing to GAPDH. Data were analyzed using the paired, two-tailed Student’s t test, and results expressed as fold change ± SEM of at least 3 independent experiments. LPS mediated IL-1β mRNA induction in MKP-1−/− BMDMs is reduced to basal levels in the presence of echinomycin. (B) BMDMs derived from WT and MKP-1−/− mice were cultured in the presence absence of Echinomycin (10 nM) and challenged with LPS (100 ng/mL) for 3h. Western blot analysis was performed using antibodies against pro-IL-1β and HIF-1α, and equal loading was confirmed using β-actin antibody. (C) Densitometric values expressed as fold increase of the ratio of pro-IL-1β/β-actin values. (D) Densitometry values expressed as fold increase of the ratio of HIF-1α/β-actin values. Data were analyzed using the paired, two-tailed Student’s t test, and the results were expressed as fold change ± SEM of at least 3 independent experiments and * represents a p value < 0.05.
3.6. Inhibition of JNK phosphorylation has no effect on LPS mediated pro-IL-1β expression
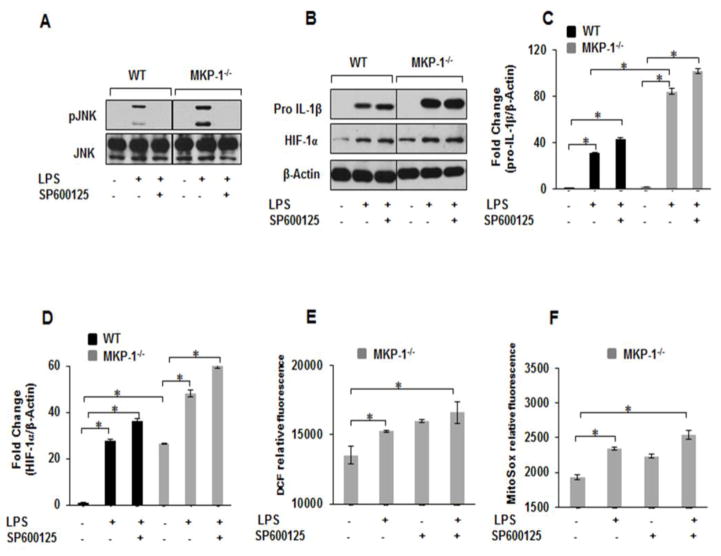
Because we observed increased JNK and p38 phosphorylation in response to LPS in MKP-1−/− BMDMs, we tested the effect of a specific JNK inhibitor (SP600125) on pro-IL-1β and HIF-1α expression in response to LPS. BMDMs derived from WT and MKP-1−/− mice were treated with SP600125 (20 μM) for 30 min prior to LPS stimulation for 3h. Whole protein lysates were immunoblotted with specific antibodies against pJNK (Thr183/Tyr185), pro-IL-1β and HIF-1α. As shown in Figure 6A, LPS mediated JNK phosphorylation was completely blocked in the presence of SP600125 in both WT and MKP-1−/− BMDMs. In contrast, SP600125 had no effect on LPS-induced pro-IL-1β and HIF-1α expression neither in WT nor MKP-1−/− BMDMs (Fig. 6B). Figure 6C and D show the densitometric analysis of at least 3 independent experiments for pro-IL-1β and HIF-1α respectively.
Figure 6. Inhibition of JNK MAP kinase has no effect on LPS mediated pro-IL-1β, HIF-1α protein levels as well as ROS production in WT and MKP-1−/− BMDMs.
BMDMs derived from WT and MKP-1−/− mice were challenged with LPS (100 ng/mL) for 3h in the absence and presence of SP600125 (20 μM) for 30 min. (A) Western blot analysis was performed using phospho-specific antibodies against JNK (Thr183/Tyr185) and equal loading was confirmed using total JNK antibody. LPS mediated JNK phosphorylation was completely blocked in the presence of SP600125 in both WT and MKP-1−/− BMDMs. (B) Western blot analysis was performed using pro-IL-1β and HIF-1α antibodies and equal loading was confirmed with β-actin. SP600125 had no effect on LPS-induced pro-IL-1β and HIF-1α expression neither in WT nor MKP-1−/− BMDMs (C) Densitometric values expressed as fold increase of the ratio of pro-IL-1β/β-actin. (D) Densitometric values expressed as fold increase of the ratio of and HIF-1α/β-actin values. Data were analyzed using the paired, two-tailed Student’s t test, and the results were expressed as fold change ± SEM of at least 3 independent experiments and * represents a p value < 0.05. (E&F) BMDMs derived from MKP-1−/− mice were pretreated with SP600125 inhibitor for 30 min prior LPS challenge (100 ng/mL) for 1h followed by the measurement of ROS production using H2DCFDA (E) and MitoSOX (F) fluorescence intensity. Results show that cytosolic and mitochondrial ROS production induced by LPS was not inhibited by SP600125 pretreatment in MKP-1−/− BMDMs.
LPS mediated ROS production has been implicated both in HIF-1α expression and IL-1β production [27]. Activation of both, p38 and JNK have been associated with increased HIF-1α expression [29, 30]. As we observed increased ROS production in MKP-1 deficient BMDMs, we investigated the effects of SP600125 on ROS production in response to LPS in MKP-1 deficient BMDMs. MKP-1 deficient BMDMs were treated with SP600125 (20 μM) for 30 min prior to LPS stimulation for 1 h. As expected LPS challenge led to increased cROS and mROS production. Surprisingly, pretreatment with SP600125 led to an enhanced cROS and mROS production at baseline and after LPS stimulation (Figs. 6E&F). These results collectively indicate that JNK activation in response to LPS is not involved in IL-1β and HIF-1α expression or ROS production in MKP-1 deficient BMDMs.
3.7. p38-inhibition decreases ROS production and pro-IL-1β as well as HIF-1α expression in response to LPS
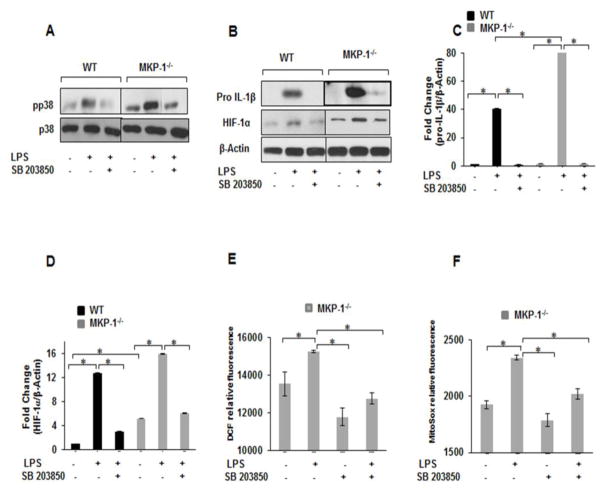
Using a specific p38 inhibitor (SB302580), we investigated the role of p38 MAPK on pro-IL-1β production and HIF-1α expression in response to LPS stimulation in BMDMs. BMDMs derived from WT and MKP-1−/− mice were cultured and pretreated with SB203580 (10 μM) for 30 min prior to LPS (100 ng/mL) challenge for 3h. Total cell lysates were immunoblotted with specific antibodies against phospho-p38 (Thr180/Tyr182), pro-IL-1β and HIF-1α. As shown in Figure 7A, pre-treatment with SB203580 significantly decreased p38 phosphorylation in response to LPS both in WT and MKP-1−/− BMDMs. Similarly, we assessed the effect of p38 inhibition on LPS-induced pro-IL-1β and HIF-1α expression. As shown in Figure 7B, pretreatment with SB203850 significantly decreased both pro-IL-1β and HIF-1α expression. The densitometric values of 3 independent experiments of the ratio of pro-IL-1β/β actin and HIF-1α/β actin are shown in Figs. 7C&D, respectively. Finally, we determined the effect of SB203850 on basal and LPS mediated ROS production in MKP-1−/− BMDMs. MKP-1 deficient macrophages were treated with SB203580 (10 μM) for 30 min prior to LPS stimulation for 1h. Figures 7E&F show that pretreatment with SB203850 decreased both basal and LPS mediated cROS and mROS production in MKP-1−/− BMDMs. However, pretreatment with p38 inhibitor did not lead to a complete blockade of ROS production. These results indicate that p38 activation is critical in the regulation of pro-IL-1β, HIF-1α and ROS production in response to LPS in MKP-1 deficient macrophages. Figure 8 shows a proposed model of the possible mechanisms involved in increased IL-1 β production in MKP-1 deficient macrophages.
Figure 7. Inhibition of p38 MAP kinase effectively blocks LPS mediated pro-IL-1β, and HIF-1α protein levels as well as ROS production in WT and MKP-1 deficient BMDMs.
(A) WT and MKP-1 deficient BMDMs were cultured in the presence or absence of SB203580 (10 μM, 30 min.) followed by a challenge with LPS (100 ng/mL) for 30 min. Whole cell extracts were prepared and 15 μg total proteins were subjected to SDS-PAGE and Western blot analysis using specific antibodies against phospho p38, equal loading was confirmed using an antibody against total p38. Pretreatment with SB203580 significantly decreased p38 phosphorylation in response to LPS both in WT and MKP-1−/− BMDMs. (B) WT and MKP-1 deficient BMDMs were cultured in the presence or absence of SB203850 (10 μM, 30 min.) followed by a challenge with LPS (100 ng/mL) for 3h. Whole cell extracts were prepared and 15 μg total proteins were subjected to SDS-PAGE and Western blot analysis using specific antibodies against pro-IL-1β and HIF-1α. Equal loading was confirmed with β-actin. Pretreatment with SB203850 significantly decreased both LPS-induced pro-IL-1β and HIF-1α expression (C) Densitometric values expressed as fold increase of the ratio of pro-IL-1β/β-actin. (D) Densitometric values expressed as fold increase of the ratio of HIF-1α/β-actin. (E&F) BMDMs derived from MKP-1−/− mice were pretreated with SB203850 inhibitor (10 μM) for 30 min prior to LPS (100 ng/mL) challenge for 1 h followed by the measurement of ROS production using (E) H2DCFDA and (F) MitoSOX fluorescence intensity. Results show that the cytosolic and mitochondrial ROS production induced by LPS was inhibited by SB203850 pretreatment in MKP-1−/− BMDMs (n=3).
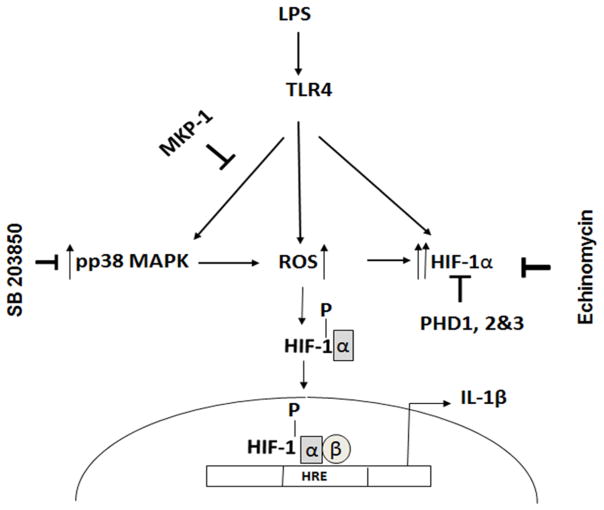
Figure 8. Proposed model of the regulatory role of MKP-1 in LPS mediated HIF-1α and IL-1β production.
Endotoxins such as LPS activate TLR 4 mediated signal transduction including phosphorylation of p38. This activation regulates ROS production and HIF-1α expression, which in turn regulates cytokine production including IL-1β. MKP-1 predominantly negatively regulates p38 phosphorylation on the TXY motifs. The lack of MKP-1 leads to an increase in p38 phosphorylation and higher mROS and cROS production. Additionally, the absence of hydroxylation due to PHD inhibition leads to increased HIF-1α stability and translocation to the nucleus through heterodimerization with HIF-1β and binds to hypoxia-response elements (HREs) in the regulatory regions of the IL-1β gene. In addition to increased HIF-1α stability, LPS increases HIF-1α mRNA levels leading to higher transcriptional activity of the HIF-1α gene. Inhibition of p38 or HIF-1α (Echinomycin) decreases IL-1β production in MKP-1 deficient BMDMs.
4. Discussion
HIF-1α is recognized as the master regulator of the hypoxic response, which activates the transcription of more than 100 genes. Under normoxic conditions, activation of TLR and several cytokine receptors can lead to the induction of HIF-1α [5, 31]. There are several mechanisms underlying the HIF-1α induction in response to LPS. TLR4 mediated induction of HIF-1α reflects a combination of increased HIF-1α transcription and decreased HIF-1α degradation (5).
MAP kinases including ERK, JNK, and p38 modulate the production of inflammatory cytokines, including IL-1β. MAPK phosphatases (MKPs) dephosphorylate MAPKs and negatively regulate inflammatory responses. MKP-1 (DUSP1) preferentially dephosphorylates p38 and JNK, while ERK is the preferred substrate of MKP3 (DUSP6) [3]. The functional roles of MKPs (e. g. MKP-1) in inflammation are still emerging and their role in diverse biological processes needs to be investigated. MKP-1 controls the expression of numerous inflammatory genes as well as transcription factors through regulation of p38 and JNK [3, 32, 33].
Upon activation of TLR4, the adaptor protein MyD88 is recruited to the receptor, which in turn triggers a cascade of signaling events leading to the activation of mitogen-activated protein kinases (MAPKs) [34]. The LPS mediated signaling leading to accumulation of HIF-1α and IL-1β production is still poorly understood. Yet, several pathways, including PI3 kinase, mTOR, p38 and JNK have been proposed to regulate HIF-1α [11, 14–16]. When we investigated the role of MKP-1 on PI3kinase, GSK3 as well as mTOR pathways, we did not observe major differences in response to LPS between MKP-1 deficient and WT BMDMs (data not shown). However, this study demonstrates that MKP-1 is a negative regulator of IL-1β production through p38 activation and HIF-1α expression. We show that LPS mediated IL-1β production is significantly enhanced in MKP-1−/− BMDMs as compared to WT BMDMs. Although there are some reports indicating the importance of MKP-1 in ERK de-phosphorylation in various cell types, including in osteoclasts [35], our results demonstrate that MKP-1−/− BMDMs exhibit higher activation of p38 and JNK MAPKs but no effect on ERK phosphorylation in response to LPS. Our current data corroborate other reports [36, 37].
HIF-1α has been implicated in the regulation of several inflammatory cytokines, including IL-1β and IL-6 [4–6]. Interestingly, we found that the basal levels of HIF-1α mRNA and protein were significantly higher in MKP-1−/− BMDMs compared to WT BMDMs. Additionally, the expression of all three PHDs that regulated the degradation of HIF-1α through hydroxylation were significantly decreased in MKP-1−/− BMDMs. Hydroxylase activity is dependent on ROS and NO as negative regulators, while cellular O2 positively regulates PHDs [38, 39]. In our system, under normoxic conditions as well as in response to LPS, we observed higher ROS and NO production in MKP-1 deficient BMDMs, while mRNA levels for all three PHDs were decreased. These results suggest that the increased stability of HIF-1α protein in MKP-1 deficient BMDMs, at least in part, may be due to lower expression of PHDs. However, basal levels (without LPS stimulation) of HIF-1α were significantly higher, suggesting increased HIF-1α stability through specific modifications such as phosphorylation. We speculate that lack of MKP-1 may lead to secondary modifications that stabilize HIF-1α or prevent its proteosomal degradation.
Another interesting finding of this study is that MKP-1 deficient BMDMs exhibit higher basal level of both cROS and mROS. In phagocytes the phagocytosis of microorganisms triggers the assembly and activation of NADPH oxidase complexes leading to enhanced ROS production. A number of protein kinases, including ERK1/2 and p38, but not JNK, have been shown to phosphorylate p47phox of the NADPH oxidase complexes, contributing to NADPH oxidase activation[40]. Thus it is not surprising that the p38 inhibitor, but not the JNK inhibitor, attenuates ROS production (Figs. 6&7). It is likely that LPS triggers ROS production in macrophages, at least in part, via the NADPH oxidase pathway. The increased ROS production in LPS-stimulated macrophages can be explained by increased p38 activity. ROS can oxidize the critical cysteine residue on the catalytic site of all tyrosine and dual specificity phosphatases, including MKP-1, leading to MAPK activation [41, 42]. Thus, it is plausible that ROS regulate HIF-1α [42] expression via p38 [43]. Previously, it has been shown that mitochondrial ROS production plays major role in IL-1β production[44]. Our results provide evidence that induction of IL-1β in response to LPS in MKP-1−/− involves a) increased ROS production b) enhanced activation of p38 and JNK MAPK as well as increased HIF-1α protein synthesis and stability.
The identification of small molecules that inhibit the sequence specific binding of transcription factors to DNA is an attractive approach for the regulation of gene expression. Echinomycin has been shown to inhibit HIF-1α DNA binding activity [45, 46]. Here, we show that echinomycin completely inhibits LPS induced IL-1β production and HIF-1α gene expressions in WT and MKP-1−/− BMDMs. Since there are other transcriptional factors, such as NF-κB, that regulate the transcription of IL-1β, it is not surprising that echinomycin only partially blocked the LPS mediated pro-IL-1β and HIF-1α protein expression. As p38 also stabilizes cytokine mRNA in addition to regulating IL-1β transcription, the inhibitory effects of echinomycin on IL-1β and HIF-1α are expected to be weaker in MKP-1−/− BMDMs than in WT BMDMs.
Our results demonstrate that SP600125, a specific inhibitor of JNK did not inhibit LPS induced pro-IL-1β or HIF-1α protein levels in MKP-1−/− BMDMs. Similarly, ROS production induced in MKP-1−/− BMDMs were not inhibited by SP600125. These results suggest that JNK activation is not involved in the regulation of IL-1β through HIF-1α. On the other hand, SB203850, a specific inhibitor of p38 MAPK decreased LPS induced pro-IL-β as well as HIF-1α protein levels in MKP-1−/− BMDMs. Similarly, ROS production in response to LPS is inhibited by SB203850 suggesting that p38 activation is involved in ROS production. Other studies have shown that activation of p38 and HIF-1α is dependent on the generation of mitochondrial reactive oxygen species [47].
Based on our results, we propose a model in which enhanced activation of p38 MAPK stabilizes HIF-1α protein through phosphorylation which in turn may be involved in the increased production of IL-1β in response to LPS in MKP-1−/− BMDMs (Fig. 8). This study provides evidence that MKP-1 regulates IL-1β production through stabilization of HIF-1α. The induction of HIF-1α protein in MKP-1 deficiency is partly due to p38 MAPK activation in response to LPS. Furthermore, the stabilization of HIF-1α protein in MKP-1−/− BMDMs may be due to its secondary modification such as phosphorylation.
Highlights.
Background
MAP kinase phosphatase-1 (MKP-1) plays a critical role in regulating inflammation in innate immunity.
Results
MKP-1 deficient macrophages responded to LPS challenge with increased IL-1β production. This was mechanistically linked to increased reactive oxygen species and a higher HIF-1α expression.
Conclusion
MKP-1 regulates LPS mediated IL-1β production through HIF-1α and ROS.
Significance
Modification of MKP-1 may provide a new target in HIF-1α regulated pathological processes, including inflammation and cancer.
Acknowledgments
This work was supported by the Department of Medicine and the Center for Molecular Medicine and Genetics, Wayne State University School of Medicine (L.S.) and R01 HL 113508 (L.S.).
Abbreviations
- TLR
toll like receptor
- MKP
MAP kinase phosphatase
- MAPK
mitogen activated protein kinase
- BMDM
bone marrow derived macrophage
- ROS
reactive oxygen species
- ANOVA
analysis of variance
- HIF-1α
hypoxia inducible factor 1 alpha
- DUSP
Dual specificity phosphatase
Footnotes
Conflict of interest
The authors declare that no conflict of interest exists.
Author contributions
H. T. and M. B. carried out the experiments. L. S and Y. L. conceived and coordinated the study. C. B and L. S. wrote the manuscript. All authors reviewed the results and approved the final version.
Publisher's Disclaimer: This is a PDF file of an unedited manuscript that has been accepted for publication. As a service to our customers we are providing this early version of the manuscript. The manuscript will undergo copyediting, typesetting, and review of the resulting proof before it is published in its final citable form. Please note that during the production process errors may be discovered which could affect the content, and all legal disclaimers that apply to the journal pertain.
References
- 1.Ghonime MG, Shamaa OR, Das S, Eldomany RA, Fernandes-Alnemri T, Alnemri ES, Gavrilin MA, Wewers MD. J Immunol. 2014;192:3881–3888. doi: 10.4049/jimmunol.1301974. [DOI] [PMC free article] [PubMed] [Google Scholar]
- 2.Gay NJ, Gangloff M, Weber AN. Nat Rev Immunol. 2006;6:693–698. doi: 10.1038/nri1916. [DOI] [PubMed] [Google Scholar]
- 3.Liu Y, Shepherd EG, Nelin LD. Nat Rev Immunol. 2007;7:202–212. doi: 10.1038/nri2035. [DOI] [PubMed] [Google Scholar]
- 4.Frede S, Stockmann C, Winning S, Freitag P, Fandrey J. J Immunol. 2009;182:6470–6476. doi: 10.4049/jimmunol.0802378. [DOI] [PubMed] [Google Scholar]
- 5.Peyssonnaux C, Cejudo-Martin P, Doedens A, Zinkernagel AS, Johnson RS, Nizet V. J Immunol. 2007;178:7516–7519. doi: 10.4049/jimmunol.178.12.7516. [DOI] [PubMed] [Google Scholar]
- 6.Tannahill GM, Curtis AM, Adamik J, Palsson-McDermott EM, McGettrick AF, Goel G, Frezza C, Bernard NJ, Kelly B, Foley NH, Zheng L, Gardet A, Tong Z, Jany SS, Corr SC, Haneklaus M, Caffrey BE, Pierce K, Walmsley S, Beasley FC, Cummins E, Nizet V, Whyte M, Taylor CT, Lin H, Masters SL, Gottlieb E, Kelly VP, Clish C, Auron PE, Xavier RJ, O’Neill LA. Nature. 2013;496:238–242. doi: 10.1038/nature11986. [DOI] [PMC free article] [PubMed] [Google Scholar]
- 7.Ivan M, Kondo K, Yang H, Kim W, Valiando J, Ohh M, Salic A, Asara JM, Lane WS, Kaelin WG., Jr Science. 2001;292:464–468. doi: 10.1126/science.1059817. [DOI] [PubMed] [Google Scholar]
- 8.Qutub AA, Popel AS. Molecular and cellular biology. 2008;28:5106–5119. doi: 10.1128/MCB.00060-08. [DOI] [PMC free article] [PubMed] [Google Scholar]
- 9.Chandel N, Maltepe E, Goldwasser E, Mathieu C, Simon M, Schumacker P. Proceedings of the National Academy of Sciences. 1998;95:11715–11720. doi: 10.1073/pnas.95.20.11715. [DOI] [PMC free article] [PubMed] [Google Scholar]
- 10.Oh YT, Lee JY, Yoon H, Lee EH, Baik HH, Kim SS, Ha J, Yoon KS, Choe W, Kang I. Neuroscience letters. 2008;431:155–160. doi: 10.1016/j.neulet.2007.11.033. [DOI] [PubMed] [Google Scholar]
- 11.Frede S, Stockmann C, Freitag P, Fandrey J. Biochem J. 2006;396:517–527. doi: 10.1042/BJ20051839. [DOI] [PMC free article] [PubMed] [Google Scholar]
- 12.Hirota SA, Beck PL, MacDonald JA. Recent patents on inflammation & allergy drug discovery. 2009;3:1–16. doi: 10.2174/187221309787158434. [DOI] [PubMed] [Google Scholar]
- 13.Liu C, Shi Y, Han Z, Pan Y, Liu N, Han S, Chen Y, Lan M, Qiao T, Fan D. Biochemical and biophysical research communications. 2003;312:780–786. doi: 10.1016/j.bbrc.2003.10.186. [DOI] [PubMed] [Google Scholar]
- 14.Treins C, Giorgetti-Peraldi S, Murdaca J, Semenza GL, Van Obberghen E. J Biol Chem. 2002;277:27975–27981. doi: 10.1074/jbc.M204152200. [DOI] [PubMed] [Google Scholar]
- 15.Flügel D, Görlach A, Michiels C, Kietzmann T. Molecular and cellular biology. 2007;27:3253–3265. doi: 10.1128/MCB.00015-07. [DOI] [PMC free article] [PubMed] [Google Scholar]
- 16.Liu FQ, Liu Y, Lui VC, Lamb JR, Tam PK, Chen Y. Experimental cell research. 2008;314:1327–1336. doi: 10.1016/j.yexcr.2008.01.007. [DOI] [PubMed] [Google Scholar]
- 17.Zhao Q, Wang X, Nelin LD, Yao Y, Matta R, Manson ME, Baliga RS, Meng X, Smith CV, Bauer JA, Chang CH, Liu Y. The Journal of experimental medicine. 2006;203:131–140. doi: 10.1084/jem.20051794. [DOI] [PMC free article] [PubMed] [Google Scholar]
- 18.Bauerfeld CP, Rastogi R, Pirockinaite G, Lee I, Huttemann M, Monks B, Birnbaum MJ, Franchi L, Nunez G, Samavati L. J Immunol. 2012;188:2847–2857. doi: 10.4049/jimmunol.1102157. [DOI] [PMC free article] [PubMed] [Google Scholar]
- 19.Rastogi R, Jiang Z, Ahmad N, Rosati R, Liu Y, Beuret L, Monks R, Charron J, Birnbaum MJ, Samavati L. J Biol Chem. 2013;288:33966–33977. doi: 10.1074/jbc.M113.492702. [DOI] [PMC free article] [PubMed] [Google Scholar]
- 20.Samavati L, Rastogi R, Du W, Huttemann M, Fite A, Franchi L. Mol Immunol. 2009;46:1867–1877. doi: 10.1016/j.molimm.2009.02.018. [DOI] [PubMed] [Google Scholar]
- 21.Liu W, Shen S-M, Zhao X-Y, Chen G-Q. 2012 [Google Scholar]
- 22.Weidemann A, Johnson R. Cell Death & Differentiation. 2008;15:621–627. doi: 10.1038/cdd.2008.12. [DOI] [PubMed] [Google Scholar]
- 23.D’Autréaux B, Toledano MB. Nature reviews Molecular cell biology. 2007;8:813–824. doi: 10.1038/nrm2256. [DOI] [PubMed] [Google Scholar]
- 24.Finkel T. The Journal of cell biology. 2011;194:7–15. doi: 10.1083/jcb.201102095. [DOI] [PMC free article] [PubMed] [Google Scholar]
- 25.Rezvani HR, Dedieu S, North S, Belloc F, Rossignol R, Letellier T, de Verneuil H, Taïeb A, Mazurier F. Journal of Biological Chemistry. 2007;282:16413–16422. doi: 10.1074/jbc.M611397200. [DOI] [PubMed] [Google Scholar]
- 26.West AP, Brodsky IE, Rahner C, Woo DK, Erdjument-Bromage H, Tempst P, Walsh MC, Choi Y, Shadel GS, Ghosh S. Nature. 2011;472:476–480. doi: 10.1038/nature09973. [DOI] [PMC free article] [PubMed] [Google Scholar]
- 27.Nishi K, Oda T, Takabuchi S, Oda S, Fukuda K, Adachi T, Semenza GL, Shingu K, Hirota K. Antioxidants & redox signaling. 2008;10:983–995. doi: 10.1089/ars.2007.1825. [DOI] [PubMed] [Google Scholar]
- 28.Kong D, Park EJ, Stephen AG, Calvani M, Cardellina JH, Monks A, Fisher RJ, Shoemaker RH, Melillo G. Cancer research. 2005;65:9047–9055. doi: 10.1158/0008-5472.CAN-05-1235. [DOI] [PubMed] [Google Scholar]
- 29.Hsu H-Y, Wen M-H. Journal of Biological Chemistry. 2002;277:22131–22139. doi: 10.1074/jbc.M111883200. [DOI] [PubMed] [Google Scholar]
- 30.Lee I-T, Shih R-H, Lin C-C, Chen J-T, Yang C-M. Cell Communication and Signaling. 2012;10:1. doi: 10.1186/1478-811X-10-33. [DOI] [PMC free article] [PubMed] [Google Scholar]
- 31.Koh MY, Spivak-Kroizman TR, Powis G. Trends in biochemical sciences. 2008;33:526–534. doi: 10.1016/j.tibs.2008.08.002. [DOI] [PubMed] [Google Scholar]
- 32.Zarubin T, Jiahuai H. Cell research. 2005;15:11–18. doi: 10.1038/sj.cr.7290257. [DOI] [PubMed] [Google Scholar]
- 33.Arthur JSC, Ley SC. Nature Reviews Immunology. 2013;13:679–692. doi: 10.1038/nri3495. [DOI] [PubMed] [Google Scholar]
- 34.Beutler B. Current opinion in immunology. 2000;12:20–26. doi: 10.1016/s0952-7915(99)00046-1. [DOI] [PubMed] [Google Scholar]
- 35.Mahalingam CD, Sampathi BR, Sharma S, Datta T, Das V, Abou-Samra AB, Datta NS. Journal of Endocrinology. 2013;216:315–329. doi: 10.1530/JOE-12-0372. [DOI] [PMC free article] [PubMed] [Google Scholar]
- 36.Zhao Q, Wang X, Nelin LD, Yao Y, Matta R, Manson ME, Baliga RS, Meng X, Smith CV, Bauer JA. The Journal of experimental medicine. 2006;203:131–140. doi: 10.1084/jem.20051794. [DOI] [PMC free article] [PubMed] [Google Scholar]
- 37.Hammer M, Mages J, Dietrich H, Schmitz F, Striebel F, Murray PJ, Wagner H, Lang R. Eur J Immunol. 2005;35:2991–3001. doi: 10.1002/eji.200526192. [DOI] [PubMed] [Google Scholar]
- 38.Metzen E, Zhou J, Jelkmann W, Fandrey J, Brüne B. Molecular biology of the cell. 2003;14:3470–3481. doi: 10.1091/mbc.E02-12-0791. [DOI] [PMC free article] [PubMed] [Google Scholar]
- 39.Chandel NS, McClintock DS, Feliciano CE, Wood TM, Melendez JA, Rodriguez AM, Schumacker PT. Journal of Biological Chemistry. 2000;275:25130–25138. doi: 10.1074/jbc.M001914200. [DOI] [PubMed] [Google Scholar]
- 40.El-Benna J, Dang PM-C, Gougerot-Pocidalo M-A, Marie J-C, Braut-Boucher F. Experimental & molecular medicine. 2009;41:217–225. doi: 10.3858/emm.2009.41.4.058. [DOI] [PMC free article] [PubMed] [Google Scholar]
- 41.McCubrey JA, LaHair MM, Franklin RA. Antioxidants & redox signaling. 2006;8:1775–1789. doi: 10.1089/ars.2006.8.1775. [DOI] [PubMed] [Google Scholar]
- 42.Son Y, Cheong Y-K, Kim N-H, Chung H-T, Kang DG, Pae H-O. Journal of signal transduction. 2011;2011 doi: 10.1155/2011/792639. [DOI] [PMC free article] [PubMed] [Google Scholar]
- 43.Chang S, Jiang X, Zhao C, Lee C, Ferriero DM. Neuroscience letters. 2008;441:134–138. doi: 10.1016/j.neulet.2008.06.005. [DOI] [PMC free article] [PubMed] [Google Scholar]
- 44.Schroder K, Zhou R, Tschopp J. Science. 2010;327:296–300. doi: 10.1126/science.1184003. [DOI] [PubMed] [Google Scholar]
- 45.Tang C-M, Yu J. Stress Response Pathways in Cancer. Springer; 2015. pp. 311–329. [Google Scholar]
- 46.Vlaminck B, Toffoli S, Ghislain B, Demazy C, Raes M, Michiels C. FEBS journal. 2007;274:5533–5542. doi: 10.1111/j.1742-4658.2007.06072.x. [DOI] [PubMed] [Google Scholar]
- 47.Emerling BM, Platanias LC, Black E, Nebreda AR, Davis RJ, Chandel NS. Molecular and cellular biology. 2005;25:4853–4862. doi: 10.1128/MCB.25.12.4853-4862.2005. [DOI] [PMC free article] [PubMed] [Google Scholar]


