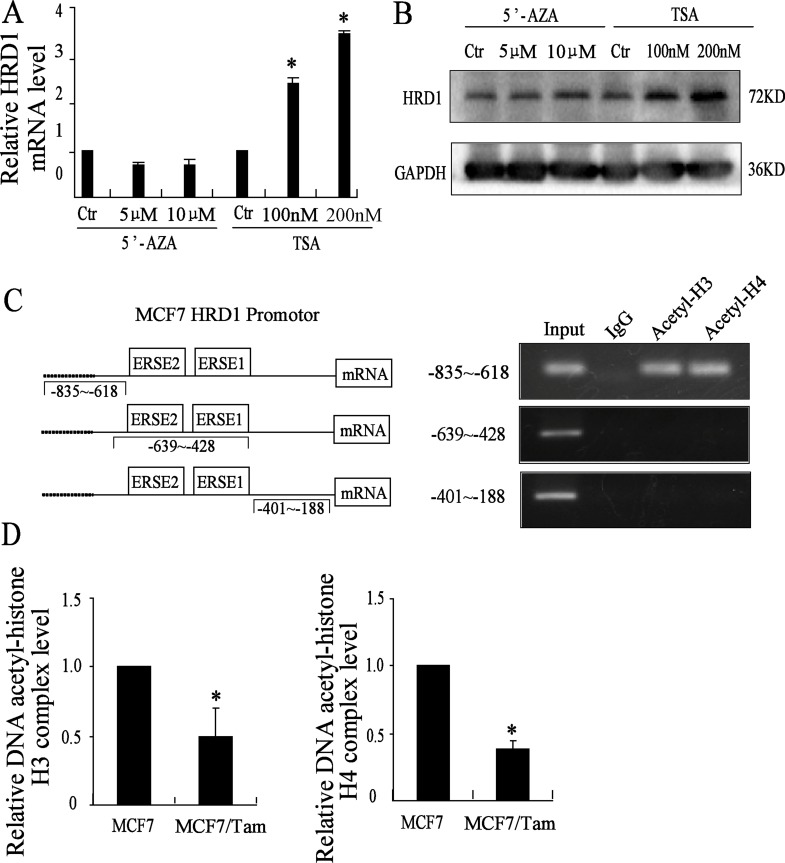
Figure 4. HRD1 is upregulated by acetylation of histone.
(A) Different concentration of 5′AZA and TSA used in the MCF7 cells for 72 h, expression of HRD1 protein level determined by Western blotting. (B) Different concentration of 5′AZA and TSA used in the MCF7 cells for 72 h, expression of HRD1 mRNA level determined by qRT-PCR. (C) The HRD1 promotor region mode pattern on the left. On the right, CHIP assay did with anti acetyl-histone H3 and H4 and negative control anti-IgG (Rabbit). A agarose gel (1%) of PCR products amplified with primers to the region of HRD1 promotor respectively (−835~−618, −639~−428, −401~−188). (D) qRT-PCR tests the Dna-Acetyl-histone H3 and H4 binding levels in both MCF7 cells and MCF7/Tam cells. All graphs show means ± S.D. of three independent experiments, *P < 0.05, compared to MCF7.

