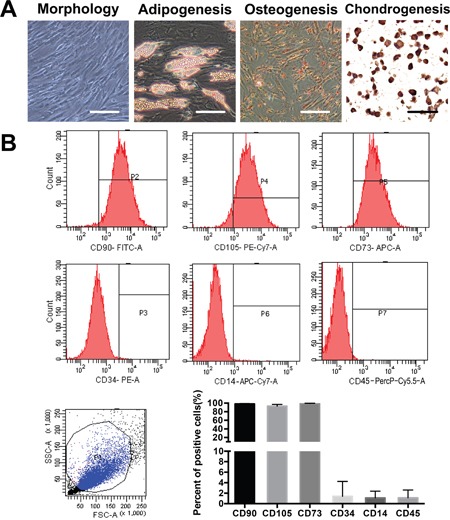
Figure 1. Isolation and characterization of ADSCs from adipose tissue surrounding the knee joint.

(A) Photomicrographs of primary ADSCs at passage 4 before and after achieving confluence are shown. The cells were examined for osteogenic, adipogenic, and chondrogenic differentiation. Scale bar=50 μm. (B) The purity of the isolated ADSCs was examined by flow cytometry; ADSCs express CD73, CD90 and CD105 and lack CD34, CD14 and CD45 expression. The quantification of three independent flow cytometry assays is shown.
