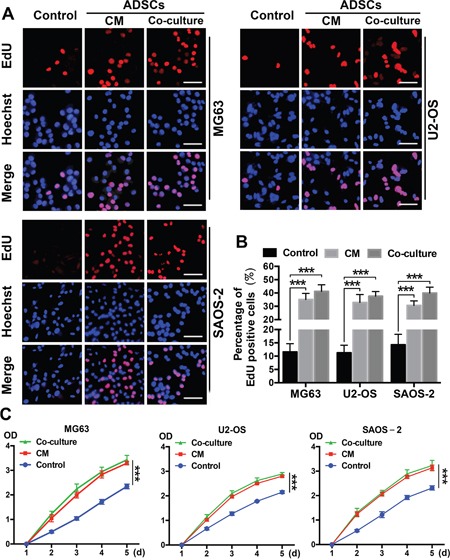
Figure 2. ADSCs trigger OS cell proliferation in vitro.

(A) Representative results of the EdU assay are shown. Dividing OS cells were labelled with EdU (red). All cells were counterstained with Hoechst 33342 (blue). (B) Quantitative analyses of the percentages of EdU-positive cells are shown below the images. Scale bar=25 μm. Error bars represent standard deviations. (C) The effects of ADSCs on OS cell proliferation were evaluated using the CCK8 assay. OS cells were treated with ADSC-conditioned medium, and the densities of both groups at 450 nm were analysed. Data from three separate experiments are shown. ***P<0.001.
