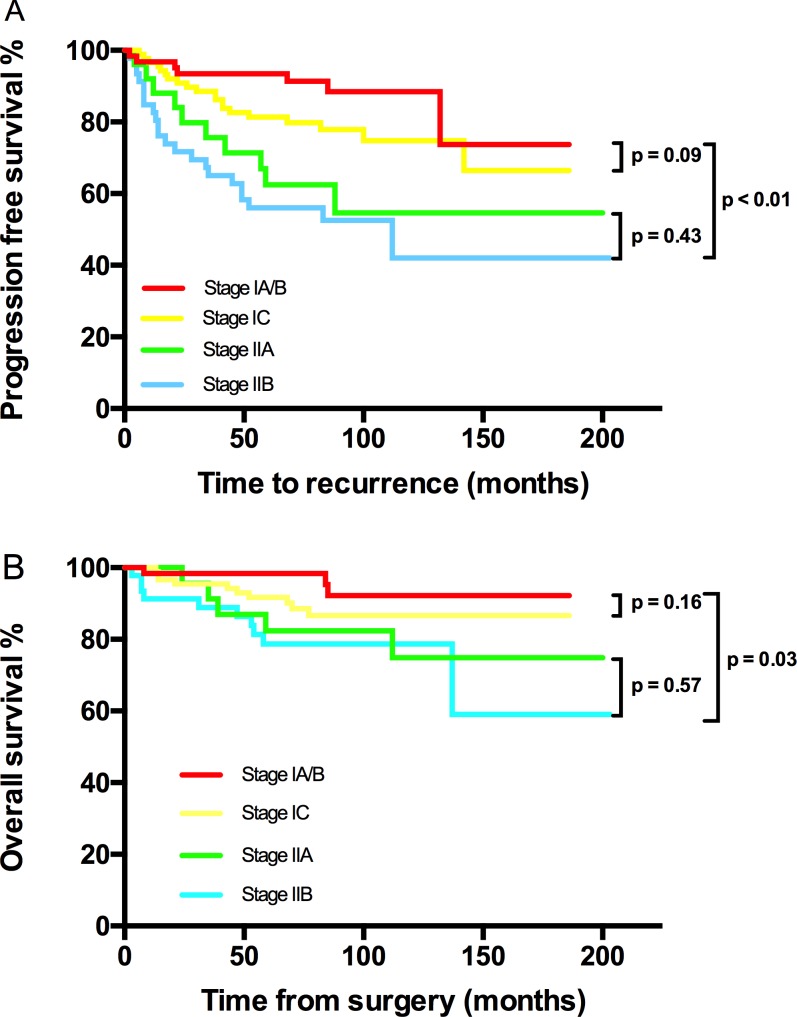
Figure 1. Kaplan-Meier estimated PFS and OS stratified by FIGO stage.
A. Progression free survival calculated by log-rank test. (stage IA/B vs stage IC vs stage IIA vs stage IIB, P < 0.01; stage IA/B vs stage IC, P = 0.091; stage IIA vs stage IIB, P = 0.43) and B. Overall survival calculated by log-rank test. (stage IA/B vs stage IC vs stage IIA vs stage IIB, P < 0.01; stage IA/B vs stage IC, P = 0.16; stage IIA vs stage IIB, P = 0.572).

