

Abstract
Hippocampal theta rhythm is believed to play a critical role in learning and memory. In animal models of temporal lobe epilepsy (TLE), there is evidence that alterations of hippocampal theta oscillations are involved in the cognitive impairments observed in this model. However, hippocampal theta frequency and amplitude at both the local field potential (LFP) and single unit level are strongly modulated by running speed, suggesting that the integration of locomotor information into memory processes may also be critical for hippocampal processing. Here, we investigate whether hippocampal speed-theta integration influences spatial memory and whether it could account for the memory deficits observed in TLE rats. LFPs were recorded in both Control (CTR) and TLE rats as they were trained in a spatial alternation task. TLE rats required more training sessions to perform the task at CTR levels. Both theta frequency and power were significantly lower in the TLE group. In addition, speed/theta frequency correlation coefficients and regression slopes varied from session to session and were worse in TLE. Importantly, there was a strong relationship between speed/theta frequency parameters and performance. Our analyses reveal that speed/theta frequency correlation with performance cannot merely be explained by the direct influence of speed on behavior. Therefore, variations in the coordination of theta frequency with speed may participate in learning and memory processes. Impairments of this function could explain at least partially memory deficits in epilepsy.
Keywords: Hippocampus, epilepsy, local field potentials, spatial alternation, theta rhythm
INTRODUCTION
There is substantial evidence that theta rhythms (5–12 Hz) in hippocampal local field potentials (LFPs) play a critical role in learning and memory (Jones and Wilson, 2005; Dragoi and Buzsaki, 2006; McNaughton et al., 2006; Jacobs et al., 2006; Robbe et al., 2006; Montgomery et al., 2009; Lega et al., 2011). In rodents, suppression of hippocampal theta activity abolishes spatial memory (Winson, 1978) and coordination of theta signals between hippocampus and connected structures increases with learning (Benchenane et al., 2010; Kleen et al., 2011). In humans, the power of theta oscillations present before the presentation of retrieval stimuli predicts whether these items elicit successful episodic memory retrieval (Addante et al., 2011). Hippocampal neuronal firing is also modulated at theta frequency. Each cell type preferentially fires at a specific theta phase (Klausberger and Somogyi, 2008) and the precise theta phase at which pyramidal cells fire action potentials (APs) (O’Keefe and Recce, 1993; Skaggs et al., 1996) is believed to provide the hippocampal system with additional encoding properties critical for the organization of information in episodic memory (Buzsaki, 2010).
Abnormal oscillatory properties of epileptic networks have been proposed as one mechanism responsible for cognitive impairments associated with epilepsy (Lenck-Santini and Holmes, 2008; Chauviere et al., 2009). Such memory impairments can adversely affect the individual’s quality of life, as is the case in temporal lobe epilepsy (TLE), the most common type of acquired epilepsy (Hermann et al., 1997; Helmstaedter, 2002; Helmstaedter and Kockelmann, 2006). As with patients, rodent models of TLE have deficits in learning and memory, particularly in spatial cognition (Liu et al., 2003a; Niessen et al., 2005; Lenck-Santini and Holmes, 2008; Tyler et al., 2012). In these models, abnormalities in hippocampal theta rhythm have been associated with decreased memory performance (Chauviere et al., 2009), and the theta phase relationship of a large proportion of hippocampal neurons is aberrant (Lenck-Santini and Holmes, 2008). However, theta activity in the hippocampus is modulated by locomotor activity (Vanderwolf, 1969), and it remains unknown whether the precision with which theta is modulated is important for spatial behavior.
Theta is present in hippocampal LFP recordings during voluntary movements (Yoshii et al., 1966; Pickenhain and Klingberg, 1967) but not during automatic movements such as licking, alert immobility, or grooming (Vanderwolf, 1969). Both theta frequency and power increase linearly with running speed (Vanderwolf, 1969; McFarland et al., 1975; Slawinska and Kasicki, 1998; Hinman et al., 2011), suggesting that the integration of sensory-motor information is a function of theta rhythm. It is not clear whether sensory-motor integration is the essential function of theta rhythm (Bland and Oddie, 2001) or whether theta is part of an episodic memory formation process directly influenced by sensori-motor information. Nevertheless, the strength of association between locomotor activity and theta rhythm strongly suggests that memory performance depends on this relationship. Interestingly, we recurrently found in our experimental epilepsy model that the degree by which theta increases with speed is highly variable and that this relationship can sometimes be absent. In this experiment, we document variations of speed-theta relationships and whether, as suggested by the current theories of theta rhythm function, speed-theta relationships are critical for memory performance (Jeewajee et al., 2008a; Jeewajee et al., 2008b). We hypothesized that variability in speed-theta relationships as rats perform a spatial alternation task would correlate with performance scores in both control (CTR) and TLE rats and that these relationships would be particularly altered in TLE rats.
METHODS
Sprague Dawley rats (300–350 g) were used in the study. All behavioral, pharmacological, and surgical procedures were done in accordance with NIH guidelines and approved by the Dartmouth College Institutional Animal Care and Use Committee. Rats were divided into a CTR (n = 12) and a TLE group (n = 9) and implanted with movable electrodes in the CA1 region of the hippocampus.
Seizure Induction
The lithium-pilocarpine model was used for this study. Lithium chloride (3 mEq/kg) was injected intraperitoneally (ip) 18 h before pilocarpine injections (10 mg/kg, ip) which were administered at P45. To prevent peripheral cholinergic effects, a subcutaneous injection of the peripheral muscarinic cholinergic receptor antagonist, methyl-scopolamine (1 mg/kg) was administered 30 min before pilocarpine. Isoflurane (3% for 1 h) was used to terminate the seizure after 1 h. For the control group, we administered saline i.p. 18 h before we administered an additional saline injection on day P45. For all rats, training sessions and recordings were started 2–4 weeks following pilocarpine or saline.
Training Apparatus
The figure-8 maze (Fig. 1) consisted of a 1-m-diameter circular track with a linear track in the center. Each arm was 10 cm wide and surrounded by 60 cm high walls. The walls located on the central arm and the inside of the circular arms were inclined 30° to ensure proper detection of the rat by the charge-coupled device (CCD) camera mounted on the ceiling. The maze was placed in the center of a 3 × 3 m2 room lit by four 60W bulbs equally spaced in the center of the ceiling. A food dispenser (Lafayette Instruments, IN) was located behind the west wall of the maze, opposite to the central stem junction. When the feeder was activated from an adjacent room, a 20 mg sucrose pellet was delivered in a cup placed in the central arm junction.
FIGURE 1.
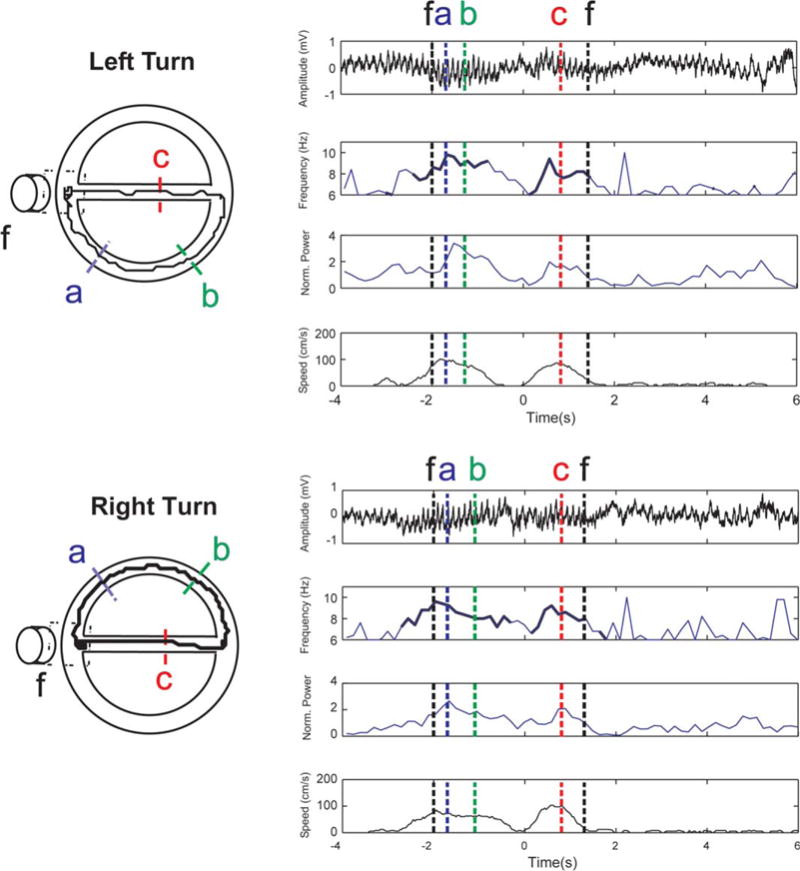
Apparatus, performance and EEG measurements. Examples of two consecutive trials in a session performed by a CTR rat are represented. The apparatus (left) contains and is surrounded by visual cues. Rats were trained to alternate continuously between left (top) and right (bottom) turns. For each trial, unfiltered hippocampal LFP (first plot from the top), instantaneous theta frequency power and instantaneous speed are represented. Theta characteristics where only performed during periods with speeds > 10cm/s (thicker lines in the frequency plots). Times at which the rat croses locations a,b,c and the feeder (f) are represented as color doted lines. Note the simultaneous increase in theta amplitude and frequency with increasing speed. [Color figure can be viewed in the online issue, which is available at wileyonlinelibrary.com.]
Behavioral Training
During the first 4 days, rats were handled daily for 20 min. During the same period their food was restricted to maintain them at 85% ad libitum weight. After this phase, each rat performed two sessions daily. During the habituation phase, rats were placed in the maze and allowed to explore for 15 min twice daily with 10 food pellets placed in the reward cup. If, at the end of the session, all pellets were eaten, training sessions were started. In the first step, the feeder was activated if the rat moved away from the feeder more than 50 cm, independently of which arm was being visited. The next step was only started if rewards were delivered 10 times during the trial. In the second step, the rat had to visit the semicircular arms and return to the center arm to get a reward. We defined the animals during these two steps as “untrained.” To transition from step 2 to step 3 (and step 3 to 4), rats had to receive at least 10 rewards in 15 min. In the third step, rats were rewarded after alternating between right and left turns from the feeding zone. Finally, the delay between trials was progressively increased by delivering more than one pellet per trial at intervals ranging from 1 to 10 s. Progressively, the intertrial interval was increased to reach between 20 and 40 s to promote hippocampal involvement (Ainge et al., 2007). The animals in these two steps were defined as being “trained.” Because another aim of this experiment was to record single units in this task, electrophysiological recordings were performed while single unit electrodes were lowered into CA1 and until they passed the CA1 layer. Therefore, recordings, lasting for 15 min, were performed during the training, immediately after the habituation phase.
For offline performance analyses, a trial was considered as the time separating exits and entrances to a 100 cm2 area surrounding the feeder. Each session lasted for 15 min and the number of trials varied from session to session, depending on the rat’s performance. Different types of errors were observed. One type of error consisted of two consecutive visits to the same arm. Other errors consisted of full circular turns (i.e., not entering the central arm) and aborted runs where the rat returns from the same arm it just visited instead of the center arm. Because there was a range of possible decisions after the initial decision of left or right at the feeder, each trial could be simultaneously considered a sample or a choice trial (for example, a left turn may be the first choice followed by the choice), performance cannot be quantified as percentage of errors. Rather, we developed a performance score that evaluates deviations from expected performance given the preceding trial. This performance score (Fig. 2) is computed on the basis of transition matrices derived from the series of rat choices in the maze (correct or incorrect left or right, full circular, etc). Transition matrices, also known as stochastic matrices, are composed of the probabilities of observing any transition in the rat choice (for example, right turn to left turn or right turn to right turn). One matrix (Obs) is based on the observed choices the rat made, and the second (Exp) is computed from the ideal. The Frobenius norm (F), or sum-of-squared-differences between the two matrices is then computed as follows: F = √(ΣijΣij(Obsij − Expij)2), where i and j index the rows and columns of the matrix, respectively. F values are divided by the maximum F over all sessions. This ratio is subtracted from one to yield the performance score. Therefore, scores ranged from 0 to 1 with 1 being a perfect performance.
FIGURE 2.

Performance Analysis. A: Example turn sequence made by a CTR rat and the expected sequence of alternating left and right turns. B: Performance matrices of observed and ideal sequences. Rows represent the previous turn and columns represent the current turn. Rows are normalized to sum to one to account for varying session lengths. C: F is the sum of squares of the difference between the observed and expected performance matrices. The rat’s score S is calculated relative to the best performing rat. [Color figure can be viewed in the online issue, which is available at wileyonlinelibrary.com.]
Rats were not tested if they had a seizure either during the session or within 2 h preceding the session.
Electrode Array and Implantation
The multielectrode array we used is manufactured in Robert U. Muller’s Laboratory (State University of New York, Downstate Medical Center, Brooklyn, NY). The version used had six independently drivable tetrodes (used for a parallel experiment on single units) and two 100μm single wire electrodes aimed to make differential recordings above and below the CA1 pyramidal cell layer. Electrode tips were surgically placed in the dorsal (septal) CA1 region of the hippocampus at the following coordinates: AP:-3.8; L:-2; DV:-1.5 mm to bregma (Paxinos and Watson, 1998). The septal CA1 region was studied because increases in theta frequency in relation to speed have been confirmed in studies examining the septal pole of the hippocampus (Hinman et al., 2011). Rats were anesthetized with 1.5% isoflurane in 1 l/min of oxygen and then placed in a stereotaxic frame. The skull was exposed and three anchor screws were placed over the left olfactory bulb, the right frontal cortex, and the right parietal cortex. A 2 mm hole was made in the left parietal bone, and the dura was removed to expose the brain surface. The electrode tips were then placed above CA1. Sterile petroleum jelly was applied to the exposed brain surface and the electrode guide tube. Grip cement was applied onto the skull, anchor screws, and around the electrode. Rats were given at least 4 days to recover before tetrode screenings for units commenced. One of the 100 μm EEG electrodes was lowered until single units were no longer observed in the signal. Then, the electrode was moved ∼300 mm to reach the CA1 stratum lacunosum moleculare layer.
Data Acquisition
Because one aim of these recordings was to analyze place cell activity in this task, EEG recordings were performed as soon as single units were detected. Therefore, recordings were done at different training levels. Supporting Information Table 1 illustrates the number of recordings performed at any given training state, for each rat. The signal from the electrodes was preamplified directly from the rat’s head by operational amplifiers mounted as followers (Gain = 1). The signal was transmitted via a cable, through a rotating commutator (Neuralynx, Bozeman, MT). Electrophysiological and position data were acquired on a DigitaLynx (Neuralynx, Bozeman, MT) recording system. Two red light emitting diodes (120° view angle) were mounted 3 cm apart (one on each side of the head stage) to track the animal location even during unusual head movements. Position data were sampled at 30 Hz by a CCD camera and digitized by a frame grabber (DataTranslation, Marlboro, MA). Sessions with more than 3% of position detection errors were discarded. LFP signals were recorded wide band (0.1–5000 Hz), amplified (gain = 100–1000) and digitized at 32 KHz.
Data Analysis
Instantaneous running speed was computed every 10 position samples (333 ms). For speed-theta analyses (Supporting Information Fig. 1), power-spectral density estimates of the hippocampal LFP in the theta range were performed using short-time Fourier transform on 1 s widows taken every 250 ms on a 0.1–1 KHz band-pass filtered LFP signal. A 1 s window was chosen to allow for accurate power spectral estimates. The computations with smaller windows (0.4 s, 250 ms overlap) were repeated ensuring a better time resolution and speed accuracy but poorer spectral estimates. Results provided by both methods are similar (see Results section), and we report the results from the 1 s windows. Theta power was computed as the mean power in the 6–12 Hz range, and theta frequency was estimated by the peak of the power spectrum in this range. Speed data was then linearly interpolated to fit the spectral data time range. For each session, the Pearson correlation coefficients (r) were computed between speed and theta power or speed and theta frequency for all collected data points. Periods of immobility or slow motion (Speed < 10 cm/s) were excluded from the analysis. The slope of speed-theta relationships was estimated by fitting a line in the data using a least squares linear regression (Polyfit.m in Matlab). For analyses separating putative correct and incorrect trials, theta phase (to estimate instantaneous theta frequency from its period) and power were determined using the Hilbert transform of the theta filtered LFP (bidirectional second order Chebichev filter).
All data analyses were performed using Matlab (Mathworks, Natick, MA, USA). Single unit recordings from this cohort of animals were used to assess single-unit functional network properties and were reported elsewhere (Tyler et al., 2012).
At the end of the experiment, rats were sacrificed with a lethal dose of sodium pentobarbital (65 mg/kg) and perfused transcardially with 200 ml of normal saline followed by 200 ml of 4% paraformaldehyde. The brains were removed, postfixed in 4% PFA for 24 h, and placed in 30% sucrose for 24 h or longer until the brains sank. Coronal sections along the entire extent of the hippocampus were cut at 20 μM on a freezing microtome and stained with neutral red.
Using a score previously described (Shatskikh et al., 2008), cell loss was scored in dorsal hippocampal sections from 2.8 mm posterior from the bregma to a point ∼3.8 mm posterior to the bregma. Only slides with adequate staining to assess cell loss were evaluated. Two sections on both sides per rat were scored. The loss of neurons in the CA1, CA3 of hippocampus and hilus was evaluated by scoring as normal = 0, mild = 1, moderate = 2, and severe = 3, whereby mild indicated a noticeable loss of neurons and gliosis, moderate indicated 20–50% cell loss, and severe indicated >50% estimated cell loss. In CA1, cell loss was evaluated at least 500 μm from the electrode to avoid assessing cell loss due to damage from the electrode. The specimens were coded by an investigator (GLH) blinded to rat number and treatment group.
Statistical Analysis
The current dataset contains data from multiple sessions in single animals. In this circumstance, the classical assumptions of statistics, such as independence of observations, are not valid. The observations within single animals are likely to be correlated, and these data can be represented as a cluster where the existence of a relationship between observations within an individual animal is assumed. Methods to deal with this issue have been developed with increasing availability of computer power (Ziegler et al., 1998). In this study, we use generalized estimating equations (GEE) which is a class of regression marginal model for investigating in a multivariable way the relationships between clustered response data and outcome measures. GEE also allows the assumption of the most appropriate distribution for the data. If the incorrect structure of the data is assumed, results from analysis can be misleading. Thus, all data distributions were visually assessed, and the most appropriate link function was used. Goodness of fit was determined using the corrected quasi likelihood under independence model criterion (QICC) and by the visual assessment of residuals (See Supporting Information Fig. 2, for example). Minimization of the QICC (when compared with the complete model) was used to identify the most appropriate model. All results are presented a marginal mean ± standard error with the standard error calculated from the model assuming clustered data. Main effects as well as two-way interactions were tested in all of the models.
Initial analyses were carried out to determine whether the TLE animals had differences in the speed-theta neural systems as parameterized by speed-theta r and speed-theta slopes. We then evaluated whether there was a relationship between performance of the rat and the above parameters in each of the groups. Because there may be many predictors of performance which could confound any identified relationship, we also investigated the effects of running speed, number of exposures to the environment, and whether the animal was in the CTR or TLE group. Finally, we evaluated whether any relationships identified were present in both trained and untrained sessions.
In the results section, the relationships between potential predictors and performance was documented using their slope (β) and standard errors. All statistical analyses were performed using SPSS v20 (Chicago, IL).
RESULTS
Behavior and LFP were recorded in 21 rats (TLE, n = 9; CTR, n = 12) for a total of 104 sessions. In the final analysis, there were 60 sessions from control animals and 44 from TLE animals.
Behavior
The rate of learning the alternation task differed between groups. CTR rats performance index increased more quickly than TLE rats (β for the group*number of exposures interaction term = 0.038 ± 0.017; P = 0.026). In addition, the number of sessions necessary for an animal to complete a training level is shown in Table 1. TLE rats required more training sessions to pass level 1 (exploration) and level 3 (alternation) than CTR rats. Running speed increased in both CTR and TLE rats as they learned the task (Table 2). However, there was no overall difference in mean running speed (speed > 10 cm/s) between CTR (53. ±.0 6 3.6 cm/s) and TLE rats (48.0 ± 4.5 cm/s. P = 0. 33). Similarly, the range of running speeds (>10 cm/s) in individual sessions did not differ between groups (CTR: 84 ± 8.7cm/s; TLE: 69 ± 6.3 cm/s; P = 0.17).
TABLE 1.
Number of Training Sessions Necessary to Reach Levels 2, 3, and 4 (Mean ± SEM)
| Group | To Level 2 | To Level 3 | To Level 4 |
|---|---|---|---|
| CTR | 1.80 ± 0.33 | 4.27 ± 0.59 | 2.22 ± 0.43 |
| TLE | 4.25 ± 0.70 | 4.75 ± 0.72 | 5.00 ± 1.49 |
TABLE 2.
Speed Performance (Mean ± SEM) as a Function of Training Level
| Group | 1 | 2 | 3 | 4 |
|---|---|---|---|---|
| CTR | 39.9 ± 2.1 | 48.3 ± 2.7 | 53. ± 6 4.2 | 63.5 ± 4.9 |
| TLE | N/A | 36.3 ± 3.7 | 50.0 ± 5.4 | 58.8 ± 4.1 |
Theta Characteristics
Given the differences between groups in the rate of learning, we next examined whether there were characteristics of theta that also differed between the groups. It is important to note that all analyses involving theta activity and/or speed were performed during periods of motion. Therefore, EEG samples recorded in the feeder zone or during periods of low speed (speed <10 cm/s) were discarded. In these conditions, theta frequency and theta power, unadjusted for running speeds, were significantly different between groups (Frequency: CTR = 7.5 ± 0.07 Hz, TLE = 7.2 ± 0.11 Hz. P = 0.025; Power: CTR = 68.1 ± 10.9 mV2/Hz, TLE = 41.9 ± 4.7 mV2/Hz; P = 0.013).
However, as mentioned above, theta characteristics are modulated by running speed. It is, thus, possible that failing to include speed in theta analyses would lead to incorrect biological inferences. As expected from the literature, we also found that both theta frequency and amplitude increased with speed. This is characterized by significant correlation coefficients and positive slopes in a majority of sessions (Fig. 3).
FIGURE 3.

Variability of speed-theta measurements (A) Examples of speed-theta Pearson correlation coefficients (r) and slopes for theta power (left) and frequency (right) in two recording sessions (same CTR animal). Each dot reprephasesents a 0.4 s sample (a sliding window was used). (B) Histograms showing the distribution of slopes (left) and correlation coefficients (right) for speed-theta power (top) and frequency (bottom) in recorded sessions. Note that slopes vary to a large extent for both speed-power and speed-frequency measurements. In contrast to speed-theta power, speed-theta frequency slopes are lower in TLE than in CTR. CTR: Control, TLE: Temporal Lobe Epilpesy. [Color figure can be viewed in the online issue, which is available at wileyonlinelibrary.com.]
Overall, for a substantial majority of sessions (Power: 58/60 sessions in CTR and 42/44 in TLE; Frequency: 58/60 session in CTR and 36/44), the correlation coefficients between speed and theta power and frequency were significant (Fig. 3B). However, the quality of this relationship varied from session to session and could be quite low in some of them. An example of this phenomenon is shown on Figure 3A illustrating speed vs. theta power (left panel) or speed vs. theta frequency (right panel) plots for two sessions recorded in the same rat. Although the speed-frequency slope is high on the first session, it is lower in the second. Overall, the mean Pearson correlation coefficient (r) of speed vs. theta frequency (Fig. 3B) was significantly lower in TLE (0.11 ± 0.02) than in CTR (0.23 ± 0.02: P < 0.001). Similarly, the mean slope of this relationship also differed between groups (CTR: 2.4 × 10⁻³ ±0.0002 Hz/cm.s−1; TLE: 0.8 × 10⁻³ ±0.0003 Hz/cm.s−1. P < 0.001). This relationship remains true if untrained (levels 1–2) or trained (Levels 3–4) sessions are considered separately.
In contrast, speed vs. theta power r or slopes did not differ between groups (r: CTR = 0.32 ± 0.03; TLE = 0.34 ± 0.03. P = 0.55. Slope: CTR = 0.16 ± 0.005 mV2.Hz−1/cm.s−1; TLE = 0.16 ± 0.015 mV2.Hz−1/cm.s−1. P = 0.45). However, it should be noted that theta power is highly dependent upon electrode placement and as described later, variability of electrode placement within the stratum radiatum and stratum lacunosum moleculare was noted.
Behavioral Correlates of Speed-Theta Relationships
In summary, we observed clear differences between the groups in two frequency parameters (speed-theta frequency r and speed-theta frequency slope) and in behavioral performance. To investigate how these parameters related to behavior, we performed regression analyses between behavioral scores and each parameter in each group separately. In each case, there was a significant relationship (Fig. 4). For this set of analyses, as in the previous ones, we only considered EEG and speed samples recorded outside of the feeding zone and with running speeds > 10 cm/s.
FIGURE 4.
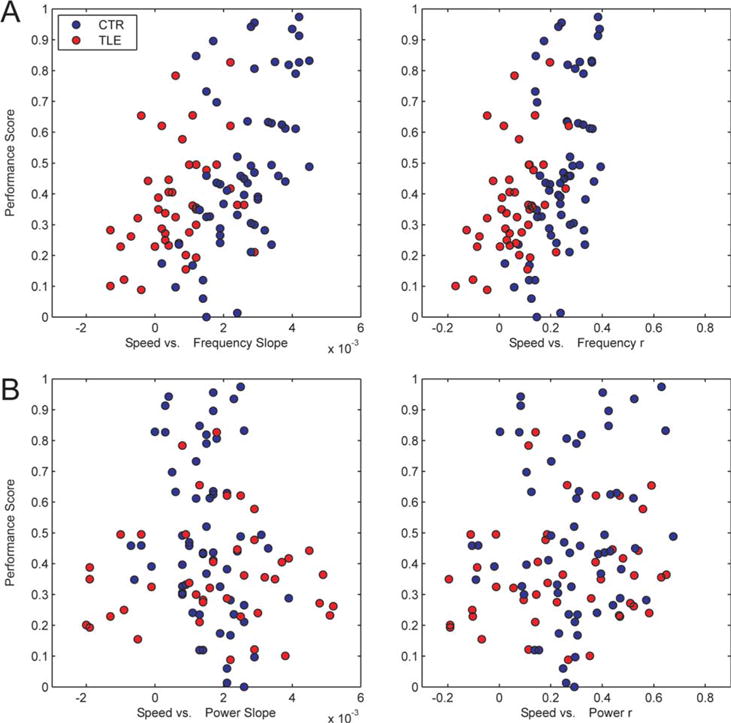
Speed-theta frequency, but not power relationships correlate with performance. A: Speed-theta Frequency slope (left) and correlation coefficients (r, right) for each session are plotted against the performance score in the session. B: Speed-theta Power slope (left) and r (right) vs. performance score in the same session. Each dot represents a recording session. CTR rats are represented in blue, TLE rats in red. [Color figure can be viewed in the online issue, which is available at wileyonlinelibrary.com.]
Although we found significant relationships between each speed-theta frequency parameter and behavior, it is possible that these findings were confounded by other parameters. Behavioral scores could also be influenced by other variables such as running speed, the number of exposures to the environment, experimental group (CTR or TLE) or interaction of these variables with speed-theta correlations. To investigate this, we took a multivariable regression approach in a GEE framework to take into account clustered data from individual animals. After adjusting for confounders, there was still a significant relationship between speed-theta frequency r and performance (β = 0.86 ± 0.17, P = 0.001). This effect is independent of the other significant predictors of performance; number of exposures to the environment (β = 0.007 ± 0.003, P = 0.01), Group (β = −0.24 ± 0.11, P = 0.03), and the effect of running speed, which predicted performance differently in the two groups of animals (Group*speed β = 0.004 ± 0.002, P = 0.012). Supporting Information Figure 3 shows speed-theta r vs. score in four individual rats (two CTR, two TLE) and reveals that the relationship with performance can also be observed in individual rats. In a separate model, we investigated the effect of speed-theta frequency slopes on performance adjusting for confounders. There remained a significant relationship between speed-theta frequency slope and performance (β = 35.9 ± 13.8, P <0.001). Other significant predictors of performance were Group (β = −0.2 ± 0.01, P = 0.05) and number of exposures to the environment (β = 0.008 ± 0.002, P = 0.001). There was a trend toward significance in the interaction between group and running speed (β = 0.003 ± 0.002, P = 0.08). As expected, the estimated βs for the confounding variables are very similar in both models, i.e., speed-theta r and speed-theta slope are not influencing the relationships between the confounding variables and performance, but remain strong predictors of performance themselves. It is possible that the effect between speed-theta frequency relationships and performance are only present in only untrained or trained trials. We, therefore, repeated the above analyses in these subgroups independently and found that the relationships between speed-theta frequency and performance remained significant in all groups (P < 0.003 for all analyses; see also Supporting Information Fig. 4).
Finally, we asked whether variations of speed/theta frequency could be changing on a trial to trial basis and correlated to the rat performance on preceding or following trials. We, therefore, regrouped EEG and speed data recorded during trials preceding or during correct trials vs. error trials. This analysis was performed in sessions with a sufficient amount (n > 10) of EEG/speed sampling points for either type of trials (100 sessions, CTR: n = 52, TLE: n = 48 sessions). Speed-theta frequency r and slopes were then compared between the two sets of data (correct vs. incorrect). Using a standard paired t-test approach, speed-frequency correlation coefficients were significantly higher during correct trials than during error trials (r during correct: 0.217 ± 0.025; r during error: 0.169 ± 0.025. paired t-test t(99)= 2.39, P <0.02). However, no statistical significance was reached if we used the more conservative GEE approach we applied in our other analyses (P = 0.11). All other parameters were similar (paired t-tests, r before error/correct: t(99) = −0.53; P = 0.59; slope before error/correct: t(99)= 0.15; P = 0.87; slope during error/correct: t(99) = 0.01; P = 0.98). Thus, further experiments are required to clearly establish whether, on a trial per trial basis, speed-theta vs. performance relationships can be linked to performance. It is also important to mention that such trial dissociation may not be ideal given that the same trial could be considered at the same time as a choice trial and as a sample trial (Fig. 2).
As mentioned in the methods section, to improve the time resolution, the same analyses were performed on spectral estimates established on a smaller, 400 ms, sliding window (250 ms steps). There is no difference in frequencies estimated using these two window sized (paired sample t-test: t(103) = −0.1, P = 0.95; Correlation: r = 0.99). Similar results were obtained both for theta power and frequency and their relationships with speed and performance.
Histology
Considerable cell loss (Fig. 5) was noted in the TLE rats in all three regions of the hippocampus (CA1 = 2.35 ± 0.23; CA3 = 2.70 ± 0.20; Hilus = 2.75 ± 0.25), whereas no cell loss was seen in the controls. The electrode tip was found to be in the stratum radiatum/stratum lacunosum moleculare.
FIGURE 5.
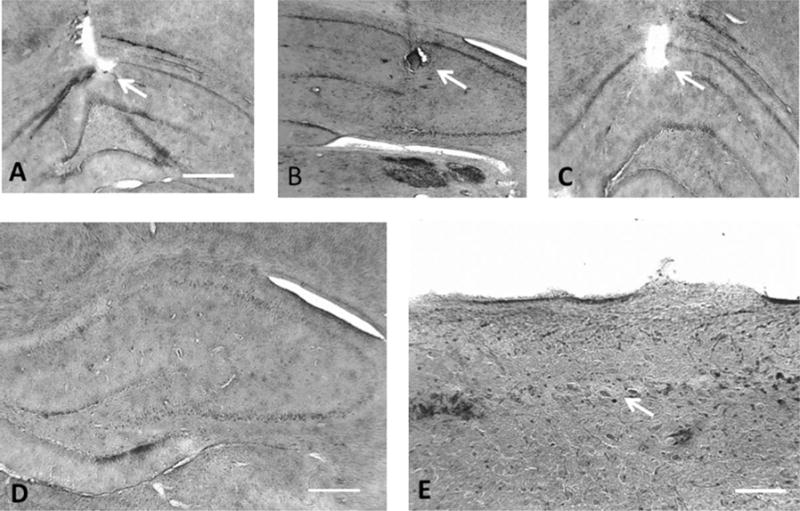
Histology and electrode placement. A–C demonstrates electrode placement in three rats (arrows). The electrode tip was seen in the struatum radiatum/stratum lacunosum moleculare in all animals. D demonstrates wide spread cell loss in one TLE rat. In E a region of CA1 from a TLE shows cell loss (arrow). Photomicrogaphs modified with Abobe Photoshop© to eliminate nonmorphological artifact. Scale = 1 mm (A–D), 400 μm for E.
To summarize, we found that (1) TLE and CTR rats differ in the rate of learning a spatial alternation task; (2) Speed/theta frequency (but not power) correlations and regression slopes were lower in TLE rats than in CTR; (3) there was a strong relationship between speed/theta frequency parameters and performance and these relationships were not affected by a number of potential confounding variables.
DISCUSSION
In this study, we show that the relationship between running speed and theta frequency varies between sessions and that the quality of this relationship was less robust in TLE rats. Importantly, there was a strong correlation between the quality of the speed-frequency relationships and performance in both groups.
Before discussing these results, it is important to mention that the correlation between speed/theta frequency and performance cannot be interpreted by a bias in EEG samples between groups or performance types. Because theta could be absent during immobility (and make speed-theta computations meaningless), EEG samples corresponding to slow or no displacements were excluded from the analysis. During error trials and sessions with poor performance, rats continued to run in straight lines and rarely came to a halt. Furthermore, although speed/theta frequency parameters differed between TLE and CTR, mean running speeds were not significantly different, suggesting that another factor was influencing these parameters. Also, regression analyses (GEE) show that the correlation between speed/theta frequency parameters and performance was still significant, independently of the speed contribution on performance.
The main finding of this study is that memory performance during the acquisition of a delayed alternation task correlates with the quality of hippocampal speed-theta relationships. The relationship between speed and theta frequency is recognized as an important process in information processing. At faster running speeds place cells are active for fewer theta cycles but oscillate at a higher frequency and emit more APs (Geisler et al., 2007). As a result, the phase shift of APs is faster, yet spatial-phase precession stays unchanged. Thus, speed-correlated acceleration of place cell assembly oscillation is responsible for the phase-distance invariance of hippocampal place cells (Geisler et al., 2007). Grid cell firing frequency also increases with running speed (Jeewajee et al., 2008a). The oscillatory interference model of grid cell firing provides an algorithmic level description of path integration and an implementation level description of grid cells and their inputs (Burgess, 2008). The distance travelled along a specific direction is encoded by the phase of a velocity-controlled oscillator and the intrinsic firing frequency of grid cells increased with running speed (Jeewajee et al., 2008a).
Our results could be interpreted in two ways: either speed-theta frequency coordination is important for information processing/mnemonic functions involved in this task (causality hypothesis) or alterations in behavior/learning affect speed-theta frequency relationships (effect hypothesis). From the literature, several arguments go in favor of the causality hypothesis. The relationship between locomotor activity and theta has been recognized for decades (Yoshii et al., 1966; Pickenhain and Klingberg, 1967; Vanderwolf, 1969). This observation led to the hypothesis that theta rhythm was critical for sensory-motor integration (Bland and Oddie, 2001). In this hypothesis, the systems responsible for theta rhythm generation are involved in a process comparing voluntary motor information and the feedback from the effect of this system via sensory inputs. With this theory in mind, one could interpret our results as caused by transient abnormalities in sensory-motor integration resulting in poor memory encoding. An alternative view, still in favor of the causality hypothesis consists of considering theta oscillations as an encoding process essential for the coordination of neuronal firing during information processing. In this view, information is conveyed and processed by neurons in a phase- and frequency-dependent manner. The theta phase at which neuronal stimuli reach hippocampal neurons is believed to be critical for both consolidation processes (Hyman et al., 2003) and organization of information amongst cell assemblies (Lisman and Redish, 2009; Buzsaki, 2010). Therefore, any discordance between the frequency of internal theta pace maker(s) and the expected flow of sensory inputs (estimated by the rat speed) could lead to processing failure. We suggest that such a process is at the origin of the association between speed-theta relationship and performance. The other, effect hypothesis proposes that poor performance alters speed-theta dynamics. For instance, the lack of reinforcement in sessions with poor performance could cause emotional or altered attention that in turn, affect theta. Because with poor performance reinforcements were not provided, it is possible that attention deficits or motivating factors altered the speed-theta dynamics.
The second finding is that the relationship between speed and theta is not consistent between sessions and that variation is even observed in control rats. The mechanisms at the origin of these variations are not clear. One possibility is that the subcortical networks influencing hippocampal theta activity are under the modulation of attention processes that affect rats differently from session to session. It would be valuable to determine whether this variability is present in all the structures involved in the generation of theta or whether it is only observed in part of the network, like the medial septum or the hippocampus. In parallel to changes in theta-speed relationships, memory performance also varied from session to session. Such erratic behavior is commonly observed in rats and particularly salient in rat models of epilepsy. Here again, little is known about the origins of such fluctuations. However, one can speculate that factors such as learning, stress, sleep quality, or environmental distractions could be responsible. Nevertheless, the existence of strong association between speed-theta variations and performance suggest that theta activity and its modulation may be involved in these behavioral fluctuations.
The fact that speed-theta relationships with performance are only observed with frequency but not power suggests that theta power and frequency may depend on separate networks and serve different functions. This possibility has been defended by Kirk (1998), who proposed that amongst the structures involved in theta generation, the supramammilary nucleus was involved in controlling theta frequency, whereas the posterior hypothalamus was involved in the amplitude modulation of theta. Furthermore, it has been observed that theta power increases linearly as a function of speed at electrode sites in the septal hippocampus but that the strength of this relationship diminishes with distance from the septal pole, whereas theta frequency increases linearly as a function of speed throughout the hippocampus (Hinman et al., 2011). We propose that theta frequency is related to the timing of information flow in the hippocampus, whereas changes in theta amplitude reflect the strength of inputs to the hippocampus, i.e., the amount of information conveyed in the structure.
The quality of speed-theta frequency relationships was weaker in TLE rats. This could be explained by a disruption of one or several structures involved in theta. For example, septal GABAergic neurons that project in the hippocampus burst at theta frequency and drive theta oscillations in the hippocampal formation (Hangya et al., 2009). Garrido Sanabria et al. (2006) showed a significant loss of GABAergic neurons in the medial septum in the pilocarpine model of TLE rats.
The impairment of speed-theta frequency relationships provides a mechanism accounting for cognitive impairment in the rodent models of TLE. Alterations of theta rhythm in TLE rats have been previously documented (Chauviere et al., 2009), and our finding adds a further dimension to this phenomenon. The quality and stability of place cells in TLE rats are abnormal (Liu et al., 2003b), as is the relationship between place cell firing and theta activity (Lenck-Santini and Holmes, 2008). We also found that TLE pyramidal neurons recorded during this spatial alternation task displayed excessive neuronal synchrony and less neuronal reactivation during rest compared to CTR (Tyler et al., 2012). Both findings were predictive of performance in the task. Overall, these findings support the interpretation that cognitive impairment in TLE may be related, at least in part, to abnormalities in speed-theta frequency abnormalities.”
CONCLUSIONS
Although the relationship between speed and hippocampal theta power and frequency has been documented for decades, little is known about the relevance of such relationship to performance. In this study, we show that speed-theta frequency correlation coefficients and slopes are strongly associated with performance in a spatial alternation task. The relevance of such behavioral relationship is strengthened by the fact that it is still observed in a rat model of TLE where both theta and cognitive impairments were previously documented. These results suggest that, in addition to oscillations themselves, the coordination of oscillatory activity with behavioral variables such as speed, may also play an important role in learning and memory processes. Interventions improving such coordination could help improve cognitive deficits in neurological disorders such as epilepsy.
Supplementary Material
Acknowledgments
Grant sponsor: National Institute of Health grants; Grant numbers: MH086833, R01NS076763 (PPLS); 1R01NS074450 (GLH), and R01NS075249 (RS); Grant sponsor: Great Ormond Street Hospital Children’s Charity.
Footnotes
Additional Supporting Information may be found in the online version of this article.
References
- Addante RJ, Watrous AJ, Yonelinas AP, Ekstrom AD, Ranganath C. Prestimulus theta activity predicts correct source memory retrieval. Proc Natl Acad Sci USA. 2011;108:10702–10707. doi: 10.1073/pnas.1014528108. [DOI] [PMC free article] [PubMed] [Google Scholar]
- Ainge JA, van der Meer MA, Langston RF, Wood ER. Exploring the role of context-dependent hippocampal activity in spatial alternation behavior. Hippocampus. 2007;17:988–1002. doi: 10.1002/hipo.20301. [DOI] [PubMed] [Google Scholar]
- Benchenane K, Peyrache A, Khamassi M, Tierney PL, Gioanni Y, Battaglia FP, Wiener SI. Coherent theta oscillations and reorganization of spike timing in the hippocampal-prefrontal network upon learning. Neuron. 2010;66:921–936. doi: 10.1016/j.neuron.2010.05.013. [DOI] [PubMed] [Google Scholar]
- Bland BH, Oddie SD. Theta band oscillation and synchrony in the hippocampal formation and associated structures: The case for its role in sensorimotor integration. Behav Brain Res. 2001;127:119–136. doi: 10.1016/s0166-4328(01)00358-8. [DOI] [PubMed] [Google Scholar]
- Burgess N. Grid cells and theta as oscillatory interference: theory and predictions. Hippocampus. 2008;18:1157–1174. doi: 10.1002/hipo.20518. [DOI] [PMC free article] [PubMed] [Google Scholar]
- Buzsaki G. Neural syntax: cell assemblies, synapsembles, and readers. Neuron. 2010;68:362–385. doi: 10.1016/j.neuron.2010.09.023. [DOI] [PMC free article] [PubMed] [Google Scholar]
- Chauviere L, Rafrafi N, Thinus-Blanc C, Bartolomei F, Esclapez M, Bernard C. Early deficits in spatial memory and theta rhythm in experimental temporal lobe epilepsy. J Neurosci. 2009;29:5402–5410. doi: 10.1523/JNEUROSCI.4699-08.2009. [DOI] [PMC free article] [PubMed] [Google Scholar]
- Dragoi G, Buzsaki G. Temporal encoding of place sequences by hippocampal cell assemblies. Neuron. 2006;50:145–157. doi: 10.1016/j.neuron.2006.02.023. [DOI] [PubMed] [Google Scholar]
- Garrido Sanabria ER, Castaneda MT, Banuelos C, Perez-Cordova MG, Hernandez S, Colom LV. Septal GABAergic neurons are selectively vulnerable to pilocarpine-induced status epilepticus and chronic spontaneous seizures. Neuroscience. 2006;142:871–883. doi: 10.1016/j.neuroscience.2006.06.057. [DOI] [PubMed] [Google Scholar]
- Geisler C, Robbe D, Zugaro M, Sirota A, Buzsaki G. Hippocampal place cell assemblies are speed-controlled oscillators. Proc Natl Acad Sci USA. 2007;104:8149–8154. doi: 10.1073/pnas.0610121104. [DOI] [PMC free article] [PubMed] [Google Scholar]
- Hangya B, Borhegyi Z, Szilagyi N, Freund TF, Varga V. GABAergic neurons of the medial septum lead the hippocampal network during theta activity. J Neurosci. 2009;29:8094–8102. doi: 10.1523/JNEUROSCI.5665-08.2009. [DOI] [PMC free article] [PubMed] [Google Scholar]
- Helmstaedter C. Effects of chronic epilepsy on declarative memory systems. Prog Brain Res. 2002;135:439–453. doi: 10.1016/S0079-6123(02)35041-6. [DOI] [PubMed] [Google Scholar]
- Helmstaedter C, Kockelmann E. Cognitive outcomes in patients with chronic temporal lobe epilepsy. Epilepsia. 2006;47:96–98. doi: 10.1111/j.1528-1167.2006.00702.x. [DOI] [PubMed] [Google Scholar]
- Hermann BP, Seidenberg M, Schoenfeld J, Davies K. Neuropsychological characteristics of the syndrome of mesial temporal lobe epilepsy. Arch Neurol. 1997;54:369–376. doi: 10.1001/archneur.1997.00550160019010. [DOI] [PubMed] [Google Scholar]
- Hinman JR, Penley SC, Long LL, Escabi MA, Chrobak JJ. Septotemporal variation in dynamics of theta: Speed and habituation. J Neurophysiol. 2011;105:2675–2686. doi: 10.1152/jn.00837.2010. [DOI] [PubMed] [Google Scholar]
- Hyman JM, Wyble BP, Goyal V, Rossi CA, Hasselmo ME. Stimulation in hippocampal region CA1 in behaving rats yields long-term potentiation when delivered to the peak of theta and long-term depression when delivered to the trough. J Neurosci. 2003;23:11725–11731. doi: 10.1523/JNEUROSCI.23-37-11725.2003. [DOI] [PMC free article] [PubMed] [Google Scholar]
- Jacobs J, Hwang G, Curran T, Kahana MJ. EEG oscillations and recognition memory: Theta correlates of memory retrieval and decision making. Neuroimage. 2006;32:978–987. doi: 10.1016/j.neuroimage.2006.02.018. [DOI] [PubMed] [Google Scholar]
- Jeewajee A, Barry C, O’Keefe J, Burgess N. Grid cells and theta as oscillatory interference: Electrophysiological data from freely moving rats. Hippocampus. 2008a;18:1175–1185. doi: 10.1002/hipo.20510. [DOI] [PMC free article] [PubMed] [Google Scholar]
- Jeewajee A, Lever C, Burton S, O’Keefe J, Burgess N. Environmental novelty is signaled by reduction of the hippocampal theta frequency. Hippocampus. 2008b;18:340–348. doi: 10.1002/hipo.20394. [DOI] [PMC free article] [PubMed] [Google Scholar]
- Jones MW, Wilson MA. Theta rhythms coordinate hippocampal-prefrontal interactions in a spatial memory task. PLoS Biol. 2005;3:e402. doi: 10.1371/journal.pbio.0030402. [DOI] [PMC free article] [PubMed] [Google Scholar]
- Kirk IJ. Frequency modulation of hippocampal theta by the supramammillary nucleus, and other hypothalamo-hippocampal interactions: Mechanisms and functional implications. Neurosci Biobehav Rev. 1998;22:291–302. doi: 10.1016/s0149-7634(97)00015-8. [DOI] [PubMed] [Google Scholar]
- Klausberger T, Somogyi P. Neuronal diversity and temporal dynamics: The unity of hippocampal circuit operations. Science. 2008;321:53–57. doi: 10.1126/science.1149381. [DOI] [PMC free article] [PubMed] [Google Scholar]
- Kleen JK, Wu EX, Holmes GL, Scott RC, Lenck-Santini PP. Enhanced oscillatory activity in the hippocampal-prefrontal network is related to short-term memory function after early-life seizures. J Neurosci. 2011;31:15397–15406. doi: 10.1523/JNEUROSCI.2196-11.2011. [DOI] [PMC free article] [PubMed] [Google Scholar]
- Lega BC, Jacobs J, Kahana M. Human hippocampal theta oscillations and the formation of episodic memories. Hippocampus. 2011;22:748–761. doi: 10.1002/hipo.20937. [DOI] [PubMed] [Google Scholar]
- Lenck-Santini PP, Holmes GL. Altered phase precession and compression of temporal sequences by place cells in epileptic rats. J Neurosci. 2008;28:5053–5062. doi: 10.1523/JNEUROSCI.5024-07.2008. [DOI] [PMC free article] [PubMed] [Google Scholar]
- Lisman J, Redish AD. Prediction, sequences and the hippocampus. Philos Trans R Soc Lond B Biol Sci. 2009;364:1193–1201. doi: 10.1098/rstb.2008.0316. [DOI] [PMC free article] [PubMed] [Google Scholar]
- Liu H, Kaur J, Dashtipour K, Kinyamu R, Ribak CE, Friedman LK. Suppression of hippocampal neurogenesis is associated with developmental stage, number of perinatal seizure episodes, and glucocorticosteroid level. Exper Neruol. 2003a;184:196–213. doi: 10.1016/s0014-4886(03)00207-3. [DOI] [PubMed] [Google Scholar]
- Liu X, Muller RU, Huang LT, Kubie JL, Rotenberg A, Rivard B, Cilio MR, Holmes GL. Seizure-induced changes in place cell physiology: Relationship to spatial memory. J Neurosci. 2003b;23:11505–11515. doi: 10.1523/JNEUROSCI.23-37-11505.2003. [DOI] [PMC free article] [PubMed] [Google Scholar]
- McFarland WL, Teitelbaum H, Hedges EK. Relationship between hippocampal theta activity and running speed in the rat. J Comp Physiol Psychol. 1975;88:324–328. doi: 10.1037/h0076177. [DOI] [PubMed] [Google Scholar]
- McNaughton N, Ruan M, Woodnorth MA. Restoring theta-like rhythmicity in rats restores initial learning in the Morris water maze. Hippocampus. 2006;16:1102–1110. doi: 10.1002/hipo.20235. [DOI] [PubMed] [Google Scholar]
- Montgomery SM, Betancur MI, Buzsaki G. Behavior-dependent coordination of multiple theta dipoles in the hippocampus. J Neurosci. 2009;29:1381–1394. doi: 10.1523/JNEUROSCI.4339-08.2009. [DOI] [PMC free article] [PubMed] [Google Scholar]
- Niessen HG, Angenstein F, Vielhaber S, Frisch C, Kudin A, Elger CE, Heinze HJ, Scheich H, Kunz WS. Volumetric magnetic resonance imaging of functionally relevant structural alterations in chronic epilepsy after pilocarpine-induced status epilepticus in rats. Epilepsia. 2005;46:1021–1026. doi: 10.1111/j.1528-1167.2005.60704.x. [DOI] [PubMed] [Google Scholar]
- O’Keefe J, Recce M. Phase relationships between hippocampal place units and the EEG theta rhythm. Hippocampus. 1993;3:317–330. doi: 10.1002/hipo.450030307. [DOI] [PubMed] [Google Scholar]
- Paxinos G, Watson C. The Rat Brain in Stereotaxic Coordinates. San Diego: Academic Press; 1998. p. 1. [Google Scholar]
- Pickenhain L, Klingberg F. Hippocampal slow wave activity as a correlate of basic behavioral mechanisms in the rat. Prog Brain Res. 1967;27:218–227. doi: 10.1016/S0079-6123(08)63101-5. [DOI] [PubMed] [Google Scholar]
- Robbe D, Montgomery SM, Thome A, Rueda-Orozco PE, McNaughton BL, Buzsaki G. Cannabinoids reveal importance of spike timing coordination in hippocampal function. Nat Neurosci. 2006;9:1526–1533. doi: 10.1038/nn1801. [DOI] [PubMed] [Google Scholar]
- Shatskikh T, Zhao Q, Zhou JL, Holmes GL. Effect of topiramate on cognitive function and single units from hippocampal place cells following status epilepticus. Epilepsy Behav. 2008;6:529–536. doi: 10.1016/j.yebeh.2008.09.030. [DOI] [PubMed] [Google Scholar]
- Skaggs WE, McNaughton BL, Wilson MA, Barnes CA. Theta phase precession in hippocampal neuronal populations and the compression of temporal sequences. Hippocampus. 1996;6:149–172. doi: 10.1002/(SICI)1098-1063(1996)6:2<149::AID-HIPO6>3.0.CO;2-K. [DOI] [PubMed] [Google Scholar]
- Slawinska U, Kasicki S. The frequency of rat’s hippocampal theta rhythm is related to the speed of locomotion. Brain Res. 1998;796:327–331. doi: 10.1016/s0006-8993(98)00390-4. [DOI] [PubMed] [Google Scholar]
- Tyler AL, Mahoney JM, Richard GR, Holmes GL, Lenck-Santini PP, Scott RC. Functional network changes in hippocampal CA1 after status epilepticus predict spatial memory deficits in rats. J Neurosci. 2012;32:11365–11376. doi: 10.1523/JNEUROSCI.1516-12.2012. [DOI] [PMC free article] [PubMed] [Google Scholar]
- Vanderwolf CH. Hippocampal electrical activity and voluntary movement in the rat. Electroencephalogr Clin Neurophysiol. 1969;26:407–418. doi: 10.1016/0013-4694(69)90092-3. [DOI] [PubMed] [Google Scholar]
- Winson J. Loss of hippocampal theta rhythm results in spatial memory deficit in the rat. Science. 1978;201:160–163. doi: 10.1126/science.663646. [DOI] [PubMed] [Google Scholar]
- Yoshii N, Shimokochi M, Miyamoto K, Ito M. Studies on the neural basis of behavior by continuous frequency analysis of EEG. Prog Brain Res. 1966;21:217–250. doi: 10.1016/s0079-6123(08)62979-9. [DOI] [PubMed] [Google Scholar]
- Ziegler A, Kastner C, Blettner M. The generalised estimating equations: An annotated bibliography. Biomed J. 1998;40:115–139. [Google Scholar]
Associated Data
This section collects any data citations, data availability statements, or supplementary materials included in this article.