Abstract
Purpose
To assess whether acquisition with 32 receiver coils rather than the vendor-recommended 12 coils provides significantly improved performance in 3D dynamic contrast-enhanced MRI (DCE-MRI) of the prostate.
Materials
The study was approved by the institutional review board and was compliant with HIPAA. 50 consecutive male patients in whom prostate MRI was clinically indicated were prospectively imaged in March 2015 with an accelerated DCE-MRI sequence in which image reconstruction was performed using 12 and 32 coil elements. The two reconstructions were compared quantitatively and qualitatively. The first was done using signal-to-noise ratio (SNR) and g-factor analysis to assess sensitivity to acceleration. The second was done using a five-point scale by two experienced radiologists using criteria of perceived SNR, artifact, spatial resolution, and overall preference. Significance was assessed with the Wilcoxon signed rank test. Extension to T2-weighted spin-echo and diffusion sequences was assessed in phantom studies.
Results
Reconstruction using 32 vs. 12 coil elements provided improved performance in DCE-MRI based on intrinsic SNR (18% higher) and g-factor statistics (14% higher), with a median 32% higher overall SNR within the prostate volume over all subjects. Reconstruction using 32 coils was qualitatively rated significantly improved (p<.001) vs. 12 coils on the basis of perceived SNR and radiologist preference and equivalent for spatial resolution and artifact. Phantom studies suggested the improvement in intrinsic SNR could extend to T2-weighted spin-echo and diffusion sequences.
Conclusions
Reconstruction of 3D accelerated DCE-MRI studies of the prostate using 32 independent receiver coils provides improved overall performance vs. using 12 coils.
Keywords: prostate MRI, DCE-MRI, multi-element receiver coil
INTRODUCTION
MR imaging of the prostate is commonly performed using a multi-parametric approach in which multiple sequences are used to aid in radiologic interpretation [1–3]. In addition to T2-weighted spin-echo (T2SE) and diffusion-weighted image (DWI) a pulse sequence typically used within this exam is three-dimensional (3D) dynamic contrast-enhanced MRI (DCE-MRI) [4–6] in which a contrast agent is administered intravenously, and images are acquired of the prostate to observe washin and washout of the contrast-enhanced blood over the entire prostate volume. DCE-MRI continues to be used in the context of the PI-RADS version 2 reporting system for prostate cancer for treatment-naïve prostate glands [7]. Further, recurrence of prostate cancer after definitive treatment has been reported to be in the 15 to 40% range [8, 9], and in such cases DCE-MRI has been shown to be of high value [10, 11]. Because the desired spatiotemporal resolution of the DCE-MRI sequence typically pushes the limits of signal-to-noise ratio (SNR), the need for good performance of the receiver coils is important [12].
For prostate MRI the coil usage reported in the literature is highly variable. One significant choice is whether an endorectal (ER) coil should be used, and several studies have compared ER with non-ER acquisition [13–16]. However, whether an ER coil is used or not, in contemporary prostate MRI some kind of multi-element receiver coil is generally used. A sampling of the recent literature shows use of multi-element coils having four [17], six [18], eight [11, 15, 19], 12 to 15 [6], and 18 [20] elements, or with the number of elements not explicitly given [4, 5].
For many contemporary MRI systems the number of receiver channels available is 32 or more. Also, coil arrays with literally dozens of elements are now embedded within the patient table. Although both of these factors can greatly facilitate the usage of a large number of elements for a given exam, it is not clear what the number or combination of elements should be for prostate MRI. If an ER coil is not used, then it is important to have a multicoil setup which provides high SNR in the region of the prostate. The results of Ref. [16] indicated superior performance for the combination of an ER coil and a 16-element multicoil vs. use of a six-element multicoil alone. However, separation of the improvement due to the change of the multicoil vs. use of the ER coil was not determined.
Prostate MRI at our institution is principally performed using a wide-bore 3T MRI system with features similar to those described above. The vendor-recommended, default coil selection for prostate DCE-MRI calls for 12 channels of data acquisition to be used of the 32 available on the system. These 12 channels include eight active elements from the array contained within the table posterior to the supine patient and four active elements used from a 16-element array placed anteriorly. In investigating to what extent the DCE-MRI sequence could be accelerated, we considered whether additional coil elements could be used. To fully exploit the capability of the MRI system, the option for use of all 32 channels was considered. Thus, the specific hypothesis of this work was that the use of 32 vs. 12 independent receiver coils would provide improved performance in DCE-MRI of the prostate. The feasibility of improved performance for other sequences of a multi-parametric prostate MRI exam was also assessed with phantom studies.
MATERIALS AND METHODS
This study was approved by the institutional review board which waived the need for written consent. The study was compliant with HIPAA.
Subjects
50 consecutive male subjects for whom a prostate MRI exam was clinically indicated and who gave their assent for their exam results to be used for research purposes were prospectively enrolled in the study over the period March 10–27, 2015. The age, weight, and body mass index (BMI) ranges were 51 to 86 years, 63.5 to 155.1 kg, and 22.5 to 46.8, respectively. Forty-four of the 50 had intact prostates; six were evaluated post-prostatectomy. Other information on the patient cohort, including radiological interpretation, is shown in Table 1. Of note is that 34% (17/50) of the patients were imaged as followup to previous treatment for prostate cancer.
Table 1.
Summary of patient information and radiological interpretation. Interpretation was based on the full multi-parametric MRI exam, not just the DCE-MRI sequence.
| Patients With No Prior Treatment | Number | Interpretation: | Interpretation: | |
| No Suspicion of | Suspicion of | |||
| Significant | Significant | |||
| Prostate Cancer | Prostate Cancer | |||
| 33 | 16 | 17 | ||
| Patients With Prior Treatment | Number | Interpretation: | Interpretation: | |
| No Worrisome | Worrisome | |||
| Lesion | Lesion | |||
| Radical Prostatectomy | 6 | 2 | 4 | |
| Radiation Therapy (external beam or | 10 | 2 | 8 | |
| brachytherapy, including with possible | ||||
| adjuvant hormonal therapy) | ||||
| Hormonal Therapy Only | 1 | 0 | 1 | |
| Total (Patients with Prior Treatment) | 17 | 4 | 13 | |
| Total (All Patients) | 50 | 20 | 30 |
MRI Acquisition
All studies were performed on either of two identical 3.0 T MRI scanners (Discovery MR750w, GE Healthcare, Waukesha WI) utilizing an institutional clinical exam protocol. Each machine has a 70 cm diameter bore, a vendor-provided 40-element receiver coil array (Geometry Embracing Method “GEM” array) embedded within the patient table, and 32 receiver channels. Each patient exam included a localizer, T2-weighted spin-echo, and diffusion-weighted sequences, followed by a DCE-MRI study performed with intravenous contrast administration. Details of the RF-spoiled gradient echo DCE-MRI sequence are shown in Table 2. Contrast material (Dotarem, Guerbet, Paris, France) was administered into an arm vein at a rate of 3 ml/sec followed by a 20 ml saline flush at 3 ml/sec. The contrast dose was 0.1 mmol/kg,with a maximum of 20 ml for patients weighing 100 kg or more.
Table 2.
Parameters for 3D RF-spoiled gradient echo prostate DCE-MRI sequence. Acquisition of coil calibration images used the same sequence applied once with phase resolution reduced from 384 to 192.
| Parameter | Value |
|---|---|
| Repetition time (TR) | 5.3 msec |
| Echo time (TE) | 2.2 msec |
| * Field of View | 220 × 440 × 114 mm3 |
| * Sampling Resolution | 256 × 384 × 38 |
| * Spatial Resolution | 0.86 × 1.15 × 3.0 mm3 |
| Acceleration | 2.49 (RY) × 1.12 (RZ) = 2.78 |
| Frame Time | 6.6 sec |
| Temporal Footprint | ≈ 19 sec |
| Number of Frames | 33 |
| Scan Time | ≈ 3.5 min |
These parameters are all expressed as (frequency × phase × slice) = (A/P × L/R × S/I).
The impetus for this study was to push the acceleration of the DCE-MRI sequence for improved spatiotemporal resolution. The sequence used is based on one developed for time-resolved contrast-enhanced MR angiography (CE-MRA) using two-dimensional (2D) SENSE acceleration [21] and view sharing [22]. For this work the slab orientation was approximately axial but with slight forward tilting to align the slab select direction with the central axis of the prostate gland as determined in the sagittal localizer. SENSE acceleration factors of 2.49 and 1.12 were applied along the left/right (L/R) phase encode and approximate superior/inferior (S/I) slice encode directions, respectively, yielding a net acceleration factor of R = 2.78. DCE-MRI acquisition was initiated 20 sec prior to the start of contrast injection, the frame time was approximately 6.6 sec, and a total of 33 time frames were collected. Versions of the sequence with higher accelerations were considered for shorter frame times; e.g. R=5.0 for 4.0 sec frame time, but for the same spatial resolution the SNR loss was considered too severe.
Selection of Receiver Coil Elements
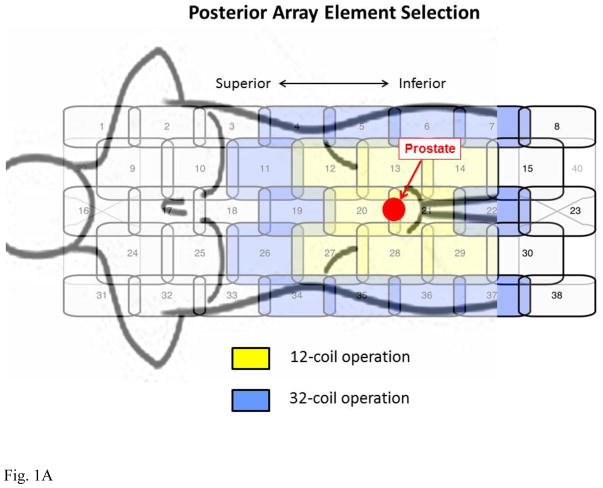
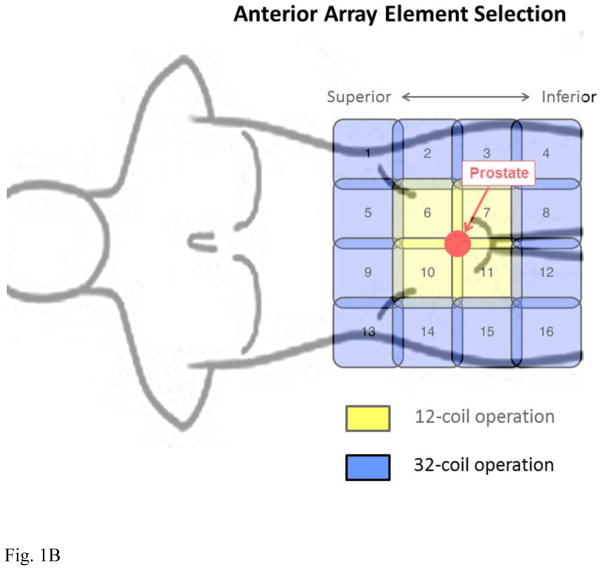
This work made use of the 40-element GEM receiver coil array shown schematically in Figure 1A with a male torso and prostate shown approximately to scale. The array consists of five columns of elements oriented longitudinally within the patient table which for the supine patient are located posteriorly. Also used was a 16-element coil array placed anteriorly consisting of four longitudinally oriented columns each comprised of four elements (Fig. 1B). In both figures an approximate 75 cm3 sphere, simulating the prostate gland, is shown in red to give a sense of scale of typical gland size to extent of coil coverage.
Figure 1.
Schematics of coil elements and element selection for 12-coil and 32-coil operation. (A) 40-element GEM array contained within the patient table and located posterior to the supine patient. (B) Schematic of 16-element array placed anteriorly to the supine patient. For 12-channel operation the coil elements shown in yellow are selected, eight from the posterior array and four from the anterior array. For 32-channel operation all coils in yellow and additionally those in blue are selected. For the posterior GEM array signals from the lateral-most elements are paired (4 with 34, 5 with 35, etc.) and combined in hardware into one virtual coil per pair. For 32-channel operation all 16 elements of the anterior array are used.
The combinations of coil elements available for usage are limited by the vendor, and recommendations are made according to the type of exam. For prostate MRI this calls for 12 active receiver coil elements, eight from the GEM array and four from the anterior array. These are highlighted in yellow in Figs. 1A and B, respectively. The elements selected from the GEM array (A) are the two central-most elements which encompass the S/I extent of the prostate, as identified from the sagittal scout images, and the three elements from the next closest columns on each side. For the anterior coil (B) the two central elements from the two rows which similarly encompass the S/I extent of the prostate are selected. All other coil elements from both arrays are electronically disabled during acquisition, and data from the 12 elements are individually digitized and used in reconstruction.
To attempt to exploit the full 32-channel capability of the MRI systems for accelerated DCE-MRI, we next considered use of the vendor-allowed 16 elements from each array. This is also depicted in Figs. 1A–B. Coil elements used for the 12-element case were expanded to include those shown in blue. For the GEM coil (A) the two central-most elements best aligned with the S/I prostate extent are selected as before. The lateral rows containing those elements are supplemented with the rows of elements next positioned superiorly and inferiorly. For each row the leftmost and rightmost elements (e.g. elements 6 and 36 of Fig. 1A) are automatically combined in vendor hardware prior to digitization, in effect forming one virtual coil from two coil elements. Thus, the 20 elements contained within the four selected rows of the GEM coil are encoded in 16 individual coils, with four of these being two-element combinations. For the anterior array all 16 elements are used (B). It is noted that the channels used for the 12-coil acquisition are a subset of those used for the 32-coil reconstruction. The remaining 20 coil elements located at the ends of the GEM array are electronically disabled during the 32-coil acquisition.
Image Reconstruction
Reconstruction was performed offline with standard SENSE unfolding [23] using a custom-built computing system described in [24]. To avoid the complications and potential variability of performing two separate DCE-MRI studies on each subject, we investigated if a single 32-coil acquisition could be done and the 12-coil acquisition accurately simulated by using only the appropriate 12 data sets for reconstruction. The risk with this approach is that the electronically active but unused 20 coil elements in the 32-active-element acquisition would interfere through undesirable coupling with the 12 elements selected for reconstruction. To assess this we first performed test scans in a volunteer in which separate acquisitions were done with the 12-active-coil and 32-active-coil approaches using the accelerated DCE-MRI sequence without contrast injection. Unaccelerated coil calibration image sets were also acquired with both approaches. Data from the 32-coil acquisition were reconstructed two ways: (i) using all 32 coils; and (ii) using data from only the same 12 coils as for the 12-active-coil acquisition. Reconstruction (iii) was done using all 12 coils of the 12-active-coil acquisition.
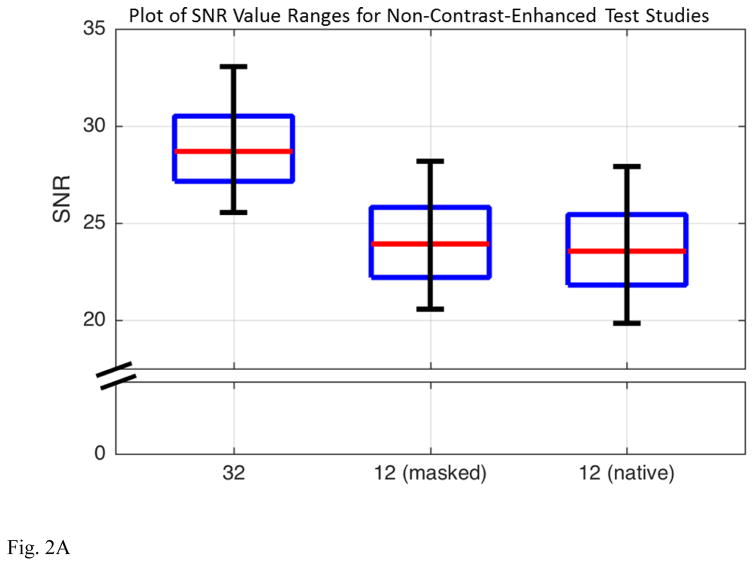
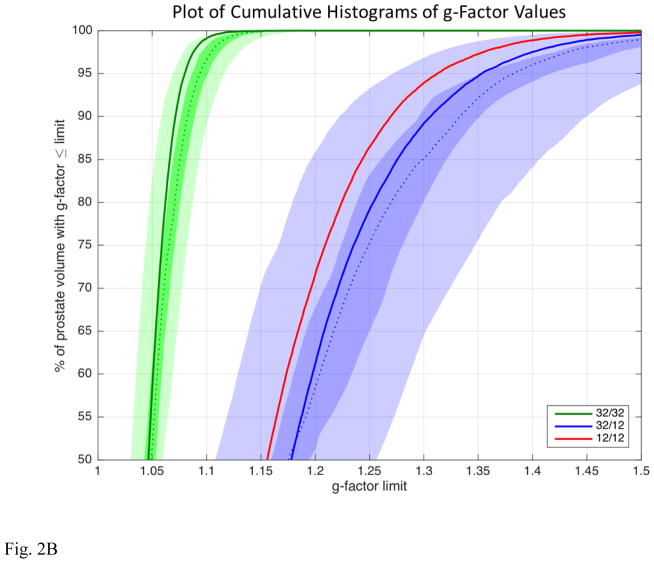
The images from reconstructions (i), (ii), and (iii) were compared in two ways. First, images of absolute SNR were formed from data sets (i), (ii), and (iii) using the method of Refs. [25, 26]. As the coil sensitivity profiles used in these calculations were estimated empirically via the root-sum-of-square demodulation, these SNR values are quantitatively approximate. Reconstructed SNR values were taken of a 3D volume just encompassing the prostate, in this case approximately 65 cm3 and comprised of more than 20,000 pixels. Second, using the coil calibration data and assuming the acceleration factors of the DCE-MRI sequence in Table 2, images were formed of the g-factor, a mathematical measure of the ability of a receiver coil array to retain SNR in accelerated MR acquisition [23]. These comparisons, shown in Figure 2, indicated that the SNR (A) and g-factor statistics (B) of reconstructions (ii) and (iii) were essentially indistinguishable, and both were different from results for reconstruction (i). Consequently, results for the 12-coil reconstruction were generated in the patient study by selecting data only from those 12 elements from the 32-active-coil acquisition and reconstructing that data. Comparisons were then made with the reconstruction using the full 32-coil data set.
Figure 2.
(A) Box and whisker plots of the reconstructed SNR values from the non-contrast-enhanced test case evaluating reconstructions (i) 32-coil acquisition with 32-coil reconstruction, (ii) 32-coil acquisition with 12-coil reconstruction (“masked”), and (iii) 12-coil acquisition with 12-coil reconstruction (“native”). Each figure shows the median, ±25% values (box boundaries), and ±45% boundaries (whiskers). Median values are 28.7, 23.9, and 23.5 (a.u.). (B) Plot of the cumulative g-factor statistics for the 32-channel acquisition with 32-coil (green lines and curves) and 12-coil (blue lines and curves) reconstructions and for the 12-channel acquisition with 12-coil reconstruction (solid red line). The three solid curves are for the non-contrast-enhanced test scans. The shaded green and blue zones show the ranges of g-factor values measured across the 32-coil and 12-coil reconstructions for all 50 patient studies, respectively. The dotted green and blue lines correspond to the median values, the dark shaded zones to ±12.5% about the median and the light shaded zones to ±37.5% about the median. For all plots the statistics are measured over the 3D volume encompassing the prostate.
Radiological Evaluation
For each of the 50 patient studies the 32-coil DCE-MRI sequence was reconstructed, and images were zero padded by a factor of 2 and cropped to effectively magnify the region surrounding the prostate. An observer not performing the radiological evaluation selected an axial partition midway through the S/I extent of the prostate at the time frame closest to 50 sec post injection. This typically corresponded to a time 10 to 20 sec after peak contrast enhancement of any rapidly enhancing lesions in the prostate. The magnified 32-coil and 12-coil images from this partition and time frame were then placed side-by-side randomly and in blinded fashion for each study. This set of 50 composite images was then provided to each reviewer.
The two radiologist reviewers (ATF, six years experience in prostate MRI; AK, 20 years experience) then independently graded each image pair using a five-point scale (−2 = left (L) image significantly better than right (R) image; −1 = L slightly better than R; 0 = L and R images equivalent; +1 = R slightly better than L; +2 = R significantly better than L). This was done for each of the four criteria of perceived SNR, level of artifact, sharpness, and overall preference.
In addition, images of absolute SNR were made for the 32-coil and 12-coil reconstructions for each of the studies using the coil calibration images as described previously for the volunteer study. For this analysis images from the six of the 50 patients who were imaged post-prostatectomy were excluded. For each study the 3D rectangular volume was identified on the reconstructed images which just encompassed the prostate, histograms of the SNR values were generated for all voxels within the volume for the two reconstructions, and the ratio of median values of the 32-coil vs. 12-coil histograms was taken as a measure of SNR improvement for that study. These volumes ranged from 28 to 265 cm3 with a median of 101 cm3, typically including several tens of thousands of pixels. This process was repeated for the g-factor for the acceleration used in the DCE-MRI run, and the ratio of median g-factor values determined.
Statistical Significance
For the radiological evaluation after accounting for the blinded presentation, significant (defined as p<0.05) difference from the null hypothesis of equivalent performance was assessed with the Wilcoxon signed rank test.
Extension to Other Pulse Sequences for Prostate MRI
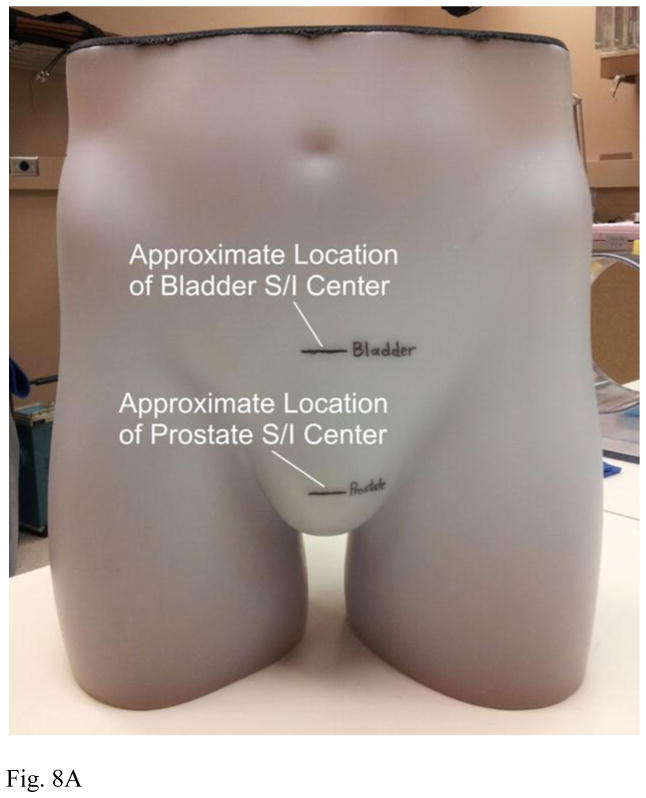
After having demonstrated improved performance in prostate DCE-MRI, it was of interest to assess potential improvement in the other sequences of multi-parametric prostate MRI, namely T2-weighted spin-echo (T2SE) and diffusion-weighted imaging (DWI). This was not possible with the 50 patient studies described previously. To study this in a controlled manner a phantom was used, consisting of a plastic, male-like pelvic shell filled with B-gel, sorbic acid, and salt dissolved in water which upon congealing mimics soft tissue. During the pouring two inclusions were added, one a 50 cc balloon to mimic the bladder and the second a 40 cc balloon to mimic the prostate. For both balloons the B-gel concentration was adjusted to provide slight but discernible signal differences vs. background. A photograph of the phantom is shown in Figure 8A. Based on phantom size, it corresponds to a BMI of approximately 24.
Figure 8.
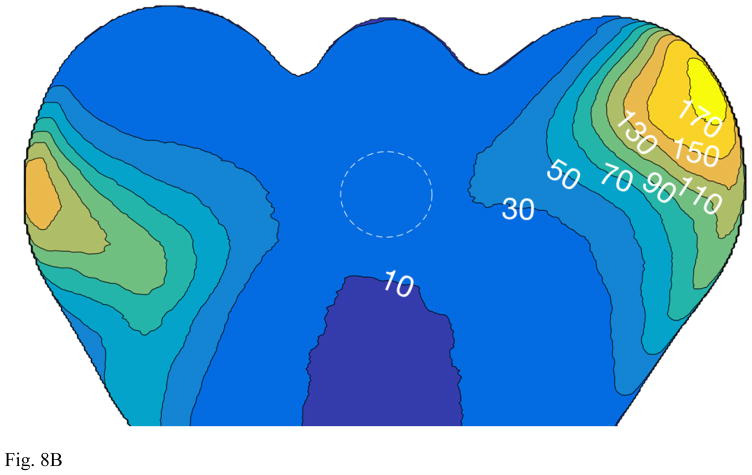
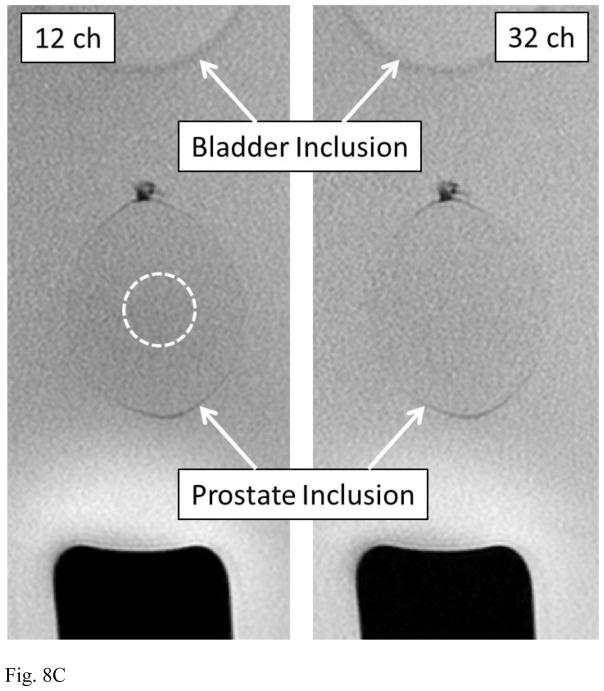
(A) Photograph of phantom used for assessment of prostate MRI. Superior/inferior levels of bladder and prostate inclusions are noted. (B) Axial image of the phantom at the level of prostate inclusion (dashed circle) showing relative percent improvement in SNR of 32- vs. 12-coil acquisition. (C) Coronal T2SE images of the phantom acquired using 12- (left) and 32-coil (right) acquisitions. The observed 9.7% SNR increase is difficult to visualize, but the images show the size and location of the prostate inclusion. ROI used for SNR measurement is indicated as dashed ellipse (left image).
The phantom was imaged with the 12- and 32-coil arrangements using the sequences: (i) DCE-MRI described above, (ii) coronal T2SE, (iii) full lateral-FOV “conventional” axial DWI, and (iv) limited-lateral-FOV axial DWI [27]. Sequence parameters are shown in Table 3. The DCE-MRI data was used to reconstruct 3D images of absolute SNR as described previously, and the ratio between the 32- vs. 12-coil images taken as a measure of absolute intrinsic SNR improvement. Each of the other sequences was run twice, the same gain settings for both runs. For each sequence an image from one of the runs was selected of a section midway through the prostate inclusion. The signal S was taken as the mean over a circular, approximate 2 cm2 region-of-interest (ROI) within the inclusion. Noise σ was assessed by forming the difference image between the two acquired images of the same anatomic section, measuring the standard deviation in the same ROI as used for signal, and dividing the result by √2 to account for the subtraction. SNR was then defined as S/σ, and the ratio of SNRs of 32- and 12-coil acquisition determined.
Table 3.
Technical parameters of T2SE and DWI pulse sequences used for phantom-based SNR analysis.
| Parameter | T2SE | Conventional | Limited-FOV |
|---|---|---|---|
| DWI | DWI | ||
| Format | Coronal | Axial | Axial |
| Field of View (mm2) | 220 x 220 | 360 × 360 | 260 × 130 |
| (FOVX × FOVY) | |||
| Acquisition Matrix | 320 × 320 | 192 × 192 | 144 × 72 |
| (X × Y) | |||
| Inplane Resolution (mm2) | 0.688 × 0.688 | 1.875 × 1.875 | 1.8 × 1.8 |
| (X × Y) | |||
| Slice Thickness / Spacing | 3 / 3.3 | 3 / 0 | 4 / 0 |
| (mm for both) | |||
| TR (msec) | 4951 | 5888 | 3925 |
| TE (msec) | 96 | 70 | 75 |
| Number of Slices | 26 | 23 | 16 |
| b-values (sec/mm2) | - | 100/1000 | 100/1000 |
| Number of Averages | 1 | 1 | 1 |
The T2SE sequence used a fast-spin-echo readout with an echo train length of 4.
RESULTS
Figure 2B shows the cumulative histograms of the g-factor values for the 32-coil and 12-coil reconstructions. The solid green, blue, and red lines are for the unenhanced test scans of the volunteer. The green shaded region shows the cumulative g-factor histogram for the 32-coil reconstruction based upon all 50 patient studies. The dashed green line is the median value; the dark green zone encompasses the central 25%, and the light green zone the central 75% at that cumulative percentage. Similarly, the blue shaded region shows analogous results for the 12-coil reconstruction. The more rapid approach to 100% of the green 32-coil reconstruction indicates the overall smaller g-factor values and better retention of SNR vs. the two 12-coil reconstructions (blue curves and blue regions and red curve). This distinction between curves is maintained across all 50 patient studies in that the shaded green and blue regions are well separated. The close match of the blue regions and red curve indicates the equivalence in performance of reconstruction (ii) and (iii).
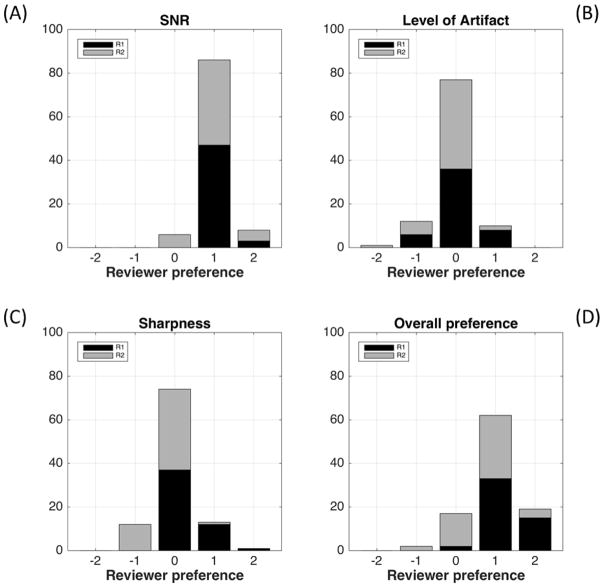
Figure 3 shows results from the qualitative evaluation of the two radiologists. 32-coil reconstruction (positive scores) was evaluated as significantly superior (p<.001) to 12-coil reconstruction using the criteria of SNR (A) and overall preference (D) by both reviewers individually and in aggregate. 32-coil and 12-coil reconstructions were evaluated as equivalent for the criteria of level of artifact (B) and sharpness (C) by both reviewers individually and in aggregate. For perceived SNR the two reviewers’ scores matched in 38/50 cases and were within one value on the five-point −2 to +2 scale in all 50/50. For artifact these corresponding results were 34/50 and 50/50; for sharpness 27/50 and 46/50; for overall preference 22/50 and 47/50.
Figure 3.
Histograms showing the results of the radiological review for perceived SNR (A), level of artifact (B), sharpness (C), and overall preference (D). For SNR (A) and overall preference (D) the preference for the 32-coil reconstruction (positive scores) was significant (p<.001) for both reviewers individually and in aggregate. For artifact (B) and sharpness (C) there was no significant preference.
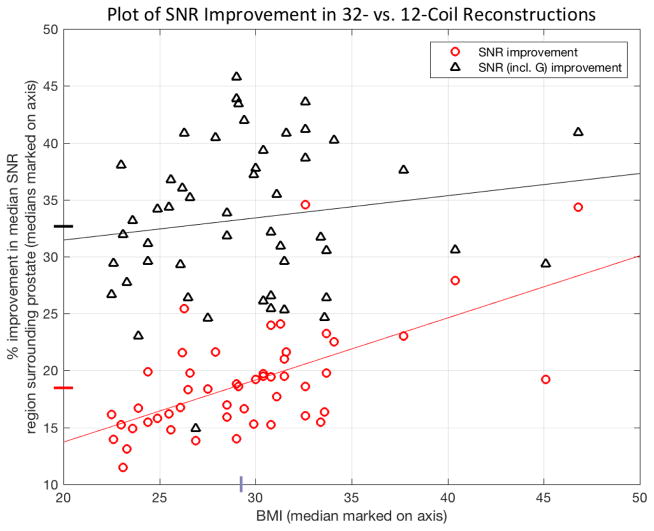
Figure 4 shows the percent improvement in SNR values provided by the 32-coil vs. 12-coil reconstruction plotted vs. the BMI of the patient. The red circles show the case with no acceleration, as determined from the images of SNR using the coil calibration data. The median increase (18%) over the 45 studies is noted with the red hashmark on the ordinate axis, and the trend line, determined by least squares regression, shown in red. The triangles show the case when acceleration is additionally used at the acceleration factors employed in this study with analogous median (32%) and trend lines shown in black. The median BMI (29.1) for the 50 studies is also noted as a hashmark on the abscissa.
Figure 4.
Plot of the ratio of median reconstructed SNR values without (red circles) and with (black triangles) the additional effect of g-factor improvements for the 32-coil and 12-coil reconstructions plotted vs. BMI of the patient. In each case values were computed from a volume encompassing the prostate. The median increase for each is shown in the corresponding colored hashmark on the ordinate, and trend lines of each with BMI, as determined from least square regression, are also noted.
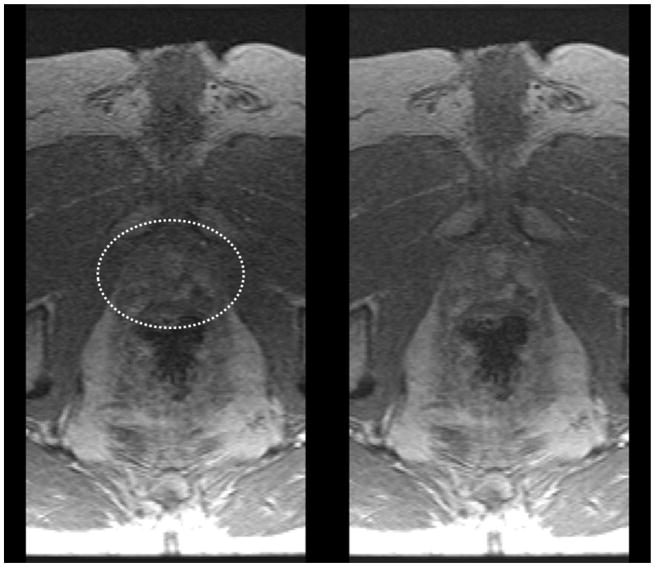
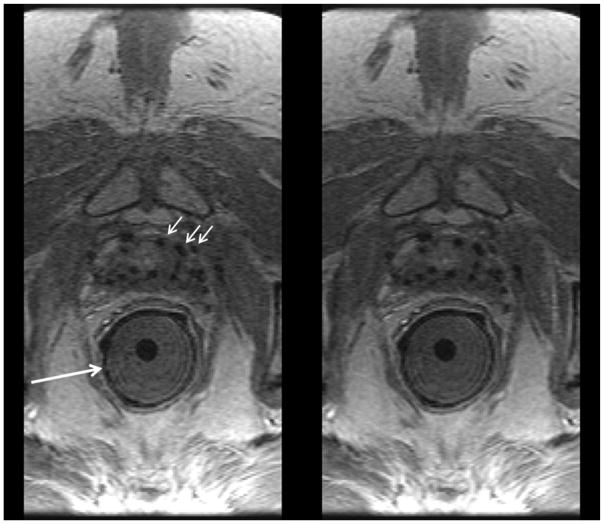
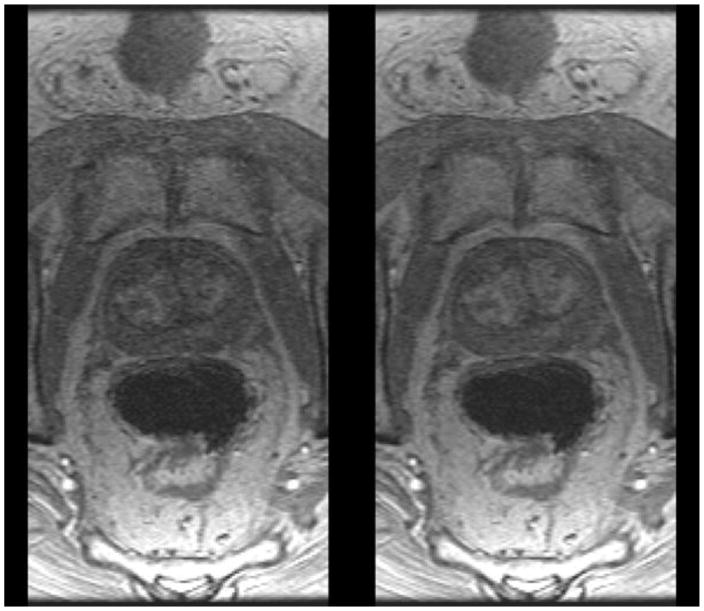
Figure 5–7 show sample results from three patient studies in which the 32-coil and 12-coil reconstructions are compared. Video V1 compares all 31 time frames for 12- vs. 32-coil reconstructions for the study presented in Figure 5.
Figure 5.
Comparison of 12-coil (left) and 32-coil (right) reconstructions of prostate DCE-MRI in a patient with BMI 26.6. Prostate is identified within the white ellipse. Radiologists #1 and #2 both assigned scores of (+2, 0, 0, +2) for (perceived SNR, artifact level, sharpness, overall preference) where positive scores reflect preference for the 32-coil result.
Figure 7.
Comparison of 12-coil (left) and 32-coil (right) reconstructions of prostate DCE-MRI in a patient with BMI 33.4 and with implanted seeds for brachytherapy (black dropouts, e.g. short white arrows). In this exam an endorectal coil used for sequences other than DCE-MRI was applied within a gel-filled insert (long white arrow) but not active for the DCE-MRI sequence. Radiologists #1 and #2 assigned scores of (+1, 0, 0, +1) and (0, 0, 0, 0).
Table 4 summarizes results for relative SNR for the phantom studies which show an SNR increase ranging from 9.7% for T2SE to 34.3% for the b-1000 conventional DWI. Figure 8B is a axial image of the phantom showing the SNR increase determined from the DCE-MRI coil calibration data. The position of the prostate inclusion is designated by the dashed circle. Figure 8C is a side-by-side comparison of unsubtracted coronal T2SE images of the phantom using 12- (left) and 32-coil (right) acquisition illustrating the size and placement of the bladder and prostate inclusions.
Table 4.
Relative SNR of 32- vs. 12-coil acquisition as measured in prostate phantom.
| Comparison | Sequence | Relative SNR | |
|---|---|---|---|
| 1 | T2SE | 1.097 | |
| 2 | Conventional DWI | 1.163 | |
| (b = 100 sec/mm2, 1 average) | |||
| 3 | Conventional DWI | 1.346 | |
| (b = 1000 sec/mm2, 1 average) | |||
| 4 | Limited-FOV DWI | 1.116 | |
| (b = 100 sec/mm2, 1 average) | |||
| 5 | Limited-FOV DWI | 1.338 | |
| (b = 1000 sec/mm2, 1 average) |
DISCUSSION
For the same level of acceleration, the acquisition and reconstruction of data from 32 receiver coils encompassing the pelvis provides superior measured and perceived SNR in dynamic-contrast-enhanced prostate MRI vs. use of the vendor-recommended 12 receiver coils. The median improvement in overall measured SNR was 32% over the volume of the prostate. Although the placement of the 12 receiver elements used already encompasses the full lateral and superior/inferior extent of the prostate, the incorporation of data from additional coils can provide improved performance without generation of artifact related to the increase in number of elements.
There are possible disadvantages in the use of additional receiver coils in image reconstruction. When done on the vendor system, the reconstruction time for a 32-coil DCE-MRI run is 50 sec vs. 15 sec on our custom hardware. Lacking high speed computational hardware, reconstruction time can possibly be reduced by grouping coil elements together before digitization to reduce the overall number of data channels [28, 29]. However, as commercial systems continue to improve in the future, reconstruction times are expected to decrease and make this less of an issue.
Another possible disadvantage in the use of incremental coils located somewhat distantly from the FOV of interest is that motion of distant objects might alias into the reconstructed FOV owing to the high sensitivity of the incremental coils to the moving object. The evaluation performed in this work indicated that this was not a significant problem. If artifact were present and could be associated with some specific distant body region, then conceivably the reconstruction could be repeated with data from the coils nearby to that region excluded.
In this work data from each 32-coil DCE-MRI acquisition were reconstructed two ways, the first using all 32 coils and the second using only 12 coils, and the results compared. This study design eliminated the additional uncertainty and expense associated with a study in which each subject would have been imaged twice with contrast material, once with each coil set. We validated this approach by comparing 12-coil reconstruction from 32- and 12-coil acquisitions and showed negligible difference in SNR and g-factor.
This study evaluated two vendor-provided configurations of the coil arrays available with the MRI system. It is possible that other configurations might provide improved performance. Specifically, acceleration applied along a particular direction benefits from coil elements which tend to face each other along that direction. Electrically combining the two most lateral elements of the GEM array into one virtual coil, as done by the vendor, might not be optimal for this array for L/R acceleration. Also, other styles of receiver coil arrays may provide improved performance, such as arrays placed in better proximity or wrapped around the pelvis. Incorporation of an endorectal coil can be expected to provide some improvement in SNR near that coil. In this work although an endorectal coil was placed in some subjects as seen in Figure 7, it was active only for sequences other than DCE-MRI.
The quantitative analysis distinguished between SNR improvement solely due to the increase in the number of coils in an unaccelerated scan (red dots of Figure 4) as well as that due to improvement in g-factor statistics (increment between red dot and black triangle for each patient) at the specific acceleration factor used. The first of these should benefit any sequence. The 32-coil array provided improvement in both SNR and in g-factor statistics vs. the 12-coil array. Both are important in acquisitions such as DCE-MRI in which acceleration is used. It is interesting that the level of improvement of SNR (red circles of Fig. 4) appeared to correlate positively with BMI.
Extending this to sequences beyond DCE-MRI, the phantom study results in Table 4 indicate that both T2SE and DWI are expected to benefit with improved SNR with 32-coil acquisition. Consistent with the results shown, sequences which are particularly signal-starved, such as high-b value DWI, might in practice benefit more from the SNR increase. This can potentially be used to reduce the level of averaging commonly done in DWI.
The benefit of increased SNR can be used for DCE-MRI in various ways. As stated, we initially investigated but opted not to go to faster frame rates. We have developed a version for assessment of biochemical recurrence with higher spatial resolution (0.76 × 0.87 × 2.24 mm3 vs. the 0.86 × 1.15 × 3.0 mm3 of this work) with a 15 sec vs. 6.6 sec frame time.
In addition to the above-described extended reconstruction time and possible motion artifact from distant objects, another limitation of this work is that further study is necessary to determine whether prostate lesion detection and characterization are improved with 32-coil DCE-MRI. Also, study of the impact in T2SE and DWI sequences should be extended to a detailed patient series for a more complete assessment.
In summary, for the same level of acceleration, the acquisition and reconstruction of data from 32 receiver coils encompassing the pelvis provides superior measured and perceived SNR in dynamic-contrast-enhanced prostate MRI vs. use of 12 receiver coils.
Figure 6.
Comparison of 12-coil (left) and 32-coil (right) reconstructions of prostate DCE-MRI in a patient with BMI 30.4. Radiologists #1 and #2 assigned scores of (+1, 0, 0, +1) and (+1, 0, 0, +2).
Acknowledgments
Funding: NIH EB000212, EB017840, RR018898; DOD W81XWH-15-1-0341; NSF CIF:1818347
We acknowledge the assistance of Brent A. Warndahl in performing the studies. The work was supported by National Institutes of Health grants EB000212 and RR018898 and by Department of Defense Grant W81XWH-15-1-0341.
Footnotes
Publisher's Disclaimer: This is a PDF file of an unedited manuscript that has been accepted for publication. As a service to our customers we are providing this early version of the manuscript. The manuscript will undergo copyediting, typesetting, and review of the resulting proof before it is published in its final citable form. Please note that during the production process errors may be discovered which could affect the content, and all legal disclaimers that apply to the journal pertain.
References
- 1.Delongchamps NB, Rouanne M, Flam T, et al. Multiparametric magnetic resonance imaging for the detection and localization of prostate cancer: combination of T2-weighted, dynamic contrast-enhanced and diffusion-weighted imaging. BJU International. 2010;107:1411–8. doi: 10.1111/j.1464-410X.2010.09808.x. [DOI] [PubMed] [Google Scholar]
- 2.Dickinson L, Ahmed HU, Allen C, et al. Magnetic resonance imaging for the detection, localization, and characterization of prostate cancer: recommendations from a European consensus meeting. Eur Urology. 2011;59:477–94. doi: 10.1016/j.eururo.2010.12.009. [DOI] [PubMed] [Google Scholar]
- 3.Barentz JO, Richenberg J, Clements R, et al. ESUR prostate MR guidelines 2012. Eur Radiol. 2012;22:746–57. doi: 10.1007/s00330-011-2377-y. [DOI] [PMC free article] [PubMed] [Google Scholar]
- 4.Franiel T, Hamm B, Hricak H. Dynamic contrast-enhanced magnetic resonance imaging and pharmacokinetic models in prostate cancer. Eur Radiol. 2011;21:616–26. doi: 10.1007/s00330-010-2037-7. [DOI] [PubMed] [Google Scholar]
- 5.Verma S, Turkbey B, Muradyan N, et al. Overview of dynamic contrast-enhanced MRI in prostate cancer diagnosis and management. AJR. 2012;198:1277–88. doi: 10.2214/AJR.12.8510. [DOI] [PMC free article] [PubMed] [Google Scholar]
- 6.Rosenkrantz AB, Geppert C, Grimm R, et al. Dynamic contrast-enhanced MRI of the prostate with high spatiotemporal resolution using compressed sensing, parallel imaging, and continuous golden-angle radial sampling: preliminary experience. J Magn Reson Imag. 2015;41:1365–73. doi: 10.1002/jmri.24661. [DOI] [PMC free article] [PubMed] [Google Scholar]
- 7.Weinreb JC, Barentsz JO, Choyke PL, et al. PI-RADS Prostate imaging - Reporting and Data System: 2015, Version 2. Eur Urology. 2016;69:16–40. doi: 10.1016/j.eururo.2015.08.052. [DOI] [PMC free article] [PubMed] [Google Scholar]
- 8.Han M, Partin AW, Zahurak M, Piantadosi S, Epstein JI, Walsh PC. Biochemical (prostate specific antigen) recurrence probability following radical prostatectomy for clincally localized prostate cancer. J Urol. 2003;169:517–23. doi: 10.1097/01.ju.0000045749.90353.c7. [DOI] [PubMed] [Google Scholar]
- 9.Trock BJ, Han M, Freedland SJ, et al. Prostate cancer-specific survival following salvage radiotherapy vs. observation in men with biochemical recurrence after radical prostatectomy. JAMA. 2010;299:2760–9. doi: 10.1001/jama.299.23.2760. [DOI] [PMC free article] [PubMed] [Google Scholar]
- 10.Rouviere O, Vitry T, Lyonnet D. Imaging of prostate cancer local recurrences: why and how? Eur Radiol. 2010;20:1254–66. doi: 10.1007/s00330-009-1647-4. [DOI] [PubMed] [Google Scholar]
- 11.Kitajima K, Hartmann RP, Froemming AT, Hagen CE, Takahashi N, Kawashima A. Detection of local recurrence of prostate cancer after radical prostatectomy using endorectal coil MRI at 3T: addition of DWI and dynamic contrast enhancement to T2-weighted MRI. AJR. 2015;205:807–16. doi: 10.2214/AJR.14.14275. [DOI] [PubMed] [Google Scholar]
- 12.Attenberger UI, Ingrisch M, Dietrich O, et al. Time-resolved 3D pulmonary perfusion MRI: comparison of different k-space acquisition strategies at 1. 5 and 3 T. Invest Radiol. 2009;44:525–31. doi: 10.1097/RLI.0b013e3181b4c252. [DOI] [PubMed] [Google Scholar]
- 13.Park BK, Kim B, Kim CK, Lee HM, Kwon GY. Comparison of phased-array 3.0-T and endorectal 1. 5-T magnetic resonance imaging in the evaluation of local staging accuracy for prostate cancer. J Comput Assist Tomogr. 2007;31(4):534–8. doi: 10.1097/01.rct.0000250108.85799.e1. [DOI] [PubMed] [Google Scholar]
- 14.Heijmink SW, Futterer JJ, Hambrock T, et al. Prostate cancer; body-array versus endorectal coil MR imaging at 3 T - comparison of image quality, localization, and staging performance. Radiology. 2007;244(1):184–95. doi: 10.1148/radiol.2441060425. [DOI] [PubMed] [Google Scholar]
- 15.Mazaheri Y, Vargas HA, Nyman G, Shukla-Dave A, Akin O, Hricak H. Diffusion-weighted MRI of the prostate at 3. 0 T: comparison of endorectal coil (ERC) and phased-array coil (PAC) MRI - teh impact of SNR on ADC measurement. Eur J Radiol. 2013;82:e515–e20. doi: 10.1016/j.ejrad.2013.04.041. [DOI] [PubMed] [Google Scholar]
- 16.Turkbey B, Merino MJ, Gallardo EC, et al. Comparison of endorectal coil and nonendorectal coil T2W and diffusion-weighted MRI at 3 Tesla for localizing prostate cancer: correlation with whole-mount histopathology. J Magn Reson Img. 2014;39:1443–8. doi: 10.1002/jmri.24317. [DOI] [PMC free article] [PubMed] [Google Scholar]
- 17.Hotker AM, Mazaheri Y, Aras O, et al. Assessment of prostate cancer aggressiveness by use of the combination of quantitative DWI and dynamic contrast-enhanced MRI. AJR. 2016;206:756–63. doi: 10.2214/AJR.15.14912. [DOI] [PMC free article] [PubMed] [Google Scholar]
- 18.Ocak I, Bernardo M, Metzger G, et al. Dynamic contrast-enhanced MRI of prostate cancer at 3 T: a study of pharmokinetic parameters. AJR. 2007;189:W192–W201. doi: 10.2214/AJR.06.1329. [DOI] [PubMed] [Google Scholar]
- 19.Fennessy FM, Fedorov A, Penzkofer T, et al. Quantitative pharmokinetic analysis of prostate cancer DCE-MRI at 3 T: comparison of two arterial input functions on cancer detection with digitized whole mount histopathological validation. Magn Reson Img. 2015;33:886–94. doi: 10.1016/j.mri.2015.02.008. [DOI] [PMC free article] [PubMed] [Google Scholar]
- 20.Cho E, Chung DJ, Yeo DM, et al. Optimal cut-off value of perfusion parameters for diagnosing prostate cancer and for assessing aggressiveness associated with Gleason score. Clinical Img. 2015;39:834–40. doi: 10.1016/j.clinimag.2015.04.020. [DOI] [PubMed] [Google Scholar]
- 21.Haider CR, Hu HH, Campeau NG, Huston J, III, Riederer SJ. 3D high temporal and spatial resolution contrast-enhanced MR angiography of the whole brain. Magn Reson Med. 2008;60:749–60. doi: 10.1002/mrm.21675. [DOI] [PMC free article] [PubMed] [Google Scholar]
- 22.Riederer SJ, Tasciyan T, Farzaneh F, Lee JN, Wright RC, Herfkens RJ. MR fluoroscopy: technical feasibility. Magn Reson Med. 1988;8:1–15. doi: 10.1002/mrm.1910080102. [DOI] [PubMed] [Google Scholar]
- 23.Pruessmann KP, Weiger M, Scheidegger MB, Boesiger P. SENSE: sensitivity encoding for fast MRI. Magn Reson Med. 1999;42:952–62. [PubMed] [Google Scholar]
- 24.Borisch EA, Trzasko JD, Froemming AT, et al. Faster-than-acquisition 4D sparse reconstruction for Cartesian 2D SENSE-type acquisition. 23rd Annual Mtg, ISMRM; Toronto. 2015. p. 1580. [Google Scholar]
- 25.Kellman P, McVeigh ER. Image reconstruction in SNR units: a general method for SNR measurement. Magn Reson Med. 2005;54:1439–47. doi: 10.1002/mrm.20713. [DOI] [PMC free article] [PubMed] [Google Scholar]
- 26.Kellman P, McVeigh ER. Erratum to Kellman P, McVeigh ER. Image reconstruction in SNR units: a general method for SNR measurement. Magn Reson Med, 2005, 54: 1439–1447. Magn Reson Med. 2007;58:211–2. doi: 10.1002/mrm.20713. [DOI] [PMC free article] [PubMed] [Google Scholar]
- 27.Feng Z, Min X, Kumar Sah V, et al. Comparison of field-of-view (FOV) optimized and constrained undistorted single shot (FOCUS) with conventional DWI for the evaluation of prostate cancer. Clinical Img. 2015;39:851–5. doi: 10.1016/j.clinimag.2015.03.004. [DOI] [PubMed] [Google Scholar]
- 28.Buehrer M, Pruessmann KP, Boesiger P, Kozerke S. Array compression for MRI with large coil arrays. Magn Reson Med. 2007;57:1131–9. doi: 10.1002/mrm.21237. [DOI] [PubMed] [Google Scholar]
- 29.Beatty PJ, Chang S, Holmes JH, et al. Design of k-space channel combination kernels and integration with parallel imaging. Magn Reson Med. 2014;71:2139–54. doi: 10.1002/mrm.24883. [DOI] [PMC free article] [PubMed] [Google Scholar]


