Significance
Tripeptidyl peptidase II (TPPII) is a key player in protein catabolism. It is common among eukaryotes and believed to act downstream of the 26S proteasome. The giant exopeptidase shows a pronounced polymorphism in vitro; that is, its state of assembly is dependent on protein concentration. In situ structural studies by cryo-electron tomography with the Volta phase plate allow assessment of TPPII supramolecuar organization in a physiological setting. Moreover, cryo-electron tomography allows researchers to probe the spatial association of TPPII with proteasomes. This spatial association is consistent with biochemical data suggesting that TPPII acts as a postproteasomal protease. Our results suggest that the spatial association facilitates sequential protein breakdown by physical proximity.
Keywords: primary cultured neuronal cell, 26S proteasome, Volta phase plate, cryo-electron tomography, subtomogram averaging
Abstract
Tripeptidyl peptidase II (TPPII) is a eukaryotic protease acting downstream of the 26S proteasome; it removes tripeptides from the degradation products released by the proteasome. Structural studies in vitro have revealed the basic architecture of TPPII, a two-stranded linear polymer that assembles to form a spindle-shaped complex of ∼6 MDa. Dependent on protein concentration, TPPII has a distinct tendency for polymorphism. Therefore, its structure in vivo has remained unclear. To resolve this issue, we have scrutinized cryo-electron tomograms of rat hippocampal neurons for the occurrence and spatial distribution of TPPII by template matching. The quality of the tomograms recorded with the Volta phase plate enabled a detailed structural analysis of TPPII despite its low abundance. Two different assembly states (36-mers and 32-mers) coexist as well as occasional extended forms with longer strands. A distance analysis of the relative locations of TPPII and 26S proteasomes confirmed the visual impression that these two complexes spatially associate in agreement with TPPII’s role in postproteasomal degradation.
The ubiquitin-proteasome system (UPS) is the main pathway of intracellular protein degradation in eukaryotic cells (1). In the UPS, the 26S proteasome, a 2.5-MDa multisubunit complex, degrades ubiquitylated proteins into oligopeptides with a size range of 4–25 residues (2, 3). The oligopeptides released by the 26S proteasome are further degraded by postproteasomal proteases (4, 5). One of the postproteasomal proteases that degrades oligopeptides longer than 15 residues is tripeptidyl peptidase II (TPPII) (6, 7). TPPII is a cytosolic serine protease of the subtilisin class (8) with an exopeptidase activity that removes tripeptides from free N-termini of peptides (9). TPPII has also been reported to be endowed with endopeptidase activity, but this activity is very low compared with its exopeptidase activity (10). Previously, only unfolded peptides had been reported to be degraded by TPPII (11). Tripeptides produced by TPPII are thought to be hydrolyzed further by an array of aminopeptidases (12). In addition to protein turnover, a role in MHC class 1 antigen presentation has also been proposed as one of the cellular functions of TPPII, but is still a subject of some controversy [for a review see Rockel et al. (11)]. A membrane-associated version of TPPII functions as a neuropeptidase inactivating the satiety hormone cholecystokinin-8 (CCK-8) by degrading into CCK-5 in the rat brain (13).
Structural studies of isolated and purified TPPII revealed the existence of large (∼6 MDa) spindle-shaped complexes comprising two linear arrays of 20 monomers each in Drosophila melanogaster (14) and 18 monomers each in Homo sapiens (15). High-resolution structures of Drosophila TPPII (16) and human TPPII (15) have been obtained by hybrid approaches combining X-ray crystallography and EM single-particle analysis. The basic building block is a dimer with a hemispherical catalytic chamber; two dimers need to become stacked together to form a full and active catalytic chamber. In biochemical experiments it was shown that the activity of TPPII dimers with different stacking numbers increases with increasing lengths of the TPPII strands (17). Although the terminal contacts of two strands within a spindle, termed the “double clamp” (14), stabilize the spindle form to some extent, TPPII is nevertheless a linear protein array, which shows the expectable dependence of strand length on concentration. Thus, single or double strands can extend to beyond 10 dimeric subunits per strand at high protein concentrations, and, conversely, spindles can decay into smaller oligomers at lower concentrations. Because TPPII complexes previously have not been characterized in vivo, the actual assembly state of this complex in cellular environments has remained unknown.
Cryo-electron tomography (CET) has unique potential to visualize macromolecules and supramolecule structures in situ under near-native conditions with spatial resolutions in the low nanometer range (18). The Volta phase plate (VPP) has been developed to improve the signal-to-noise ratio of cryo-electron microscopic images (19). By using the VPP in CET, molecular features in plunge-frozen primary cultured neuronal cells can be visualized (20). The improvement in image contrast by the VPP enables in situ structural studies of macromolecular complexes such as proteasomes and ribosomes (21, 22). Furthermore, it allows the spatial distribution of these macromolecular complexes in cells to be analyzed with nanometer precision and without the need of labeling (21, 22). Here, we scrutinized existing tomograms of rat primary cultured neuronal cells (21) by template matching for the occurrence and location of TPPII. A detailed structural analysis of TPPII was achieved by reference-free subtomogram averaging. The spatial relationship of TPPII and 26S proteasome particles was evaluated by a distance analysis.
Results
Detection of TPPII Complex in Situ.
TPPII is a low-abundance protein (11), but it has been reported that brain tissue has a higher TPPII activity than most other tissues (13). A tomographic dataset of primary cultured hippocampal neuronal cells comprising a total of 70 tomograms was therefore subjected to an in-depth analysis focused on TPPII.
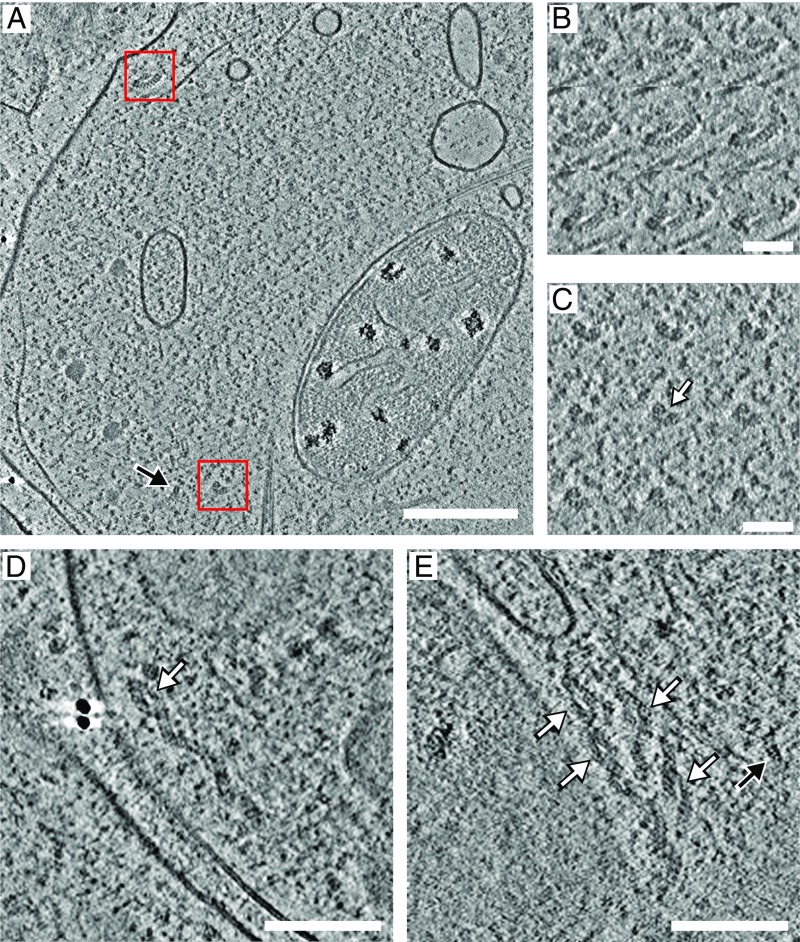
Fig. 1A shows a representative tomographic x–y slice from a tomogram of a neuronal cell. A horizontally oriented TPPII particle can be discerned by visual inspection (Fig. 1A, top red square) as well as a vertically oriented one (Fig. 1A, bottom red square). The latter is, moreover, in close proximity to a single-capped 26S proteasome (Fig. 1A, black arrow). The two TPPII particles (spotted here directly in their cellular environment) are distinctly spindle-shaped and resemble the structures observed in vitro (14, 15). To further analyze the in situ structure of the TPPII complex, a combination of data mining by template matching and subtomogram averaging was used.
Fig. 1.
Detection of TPPII in situ. (A) Representative tomographic x–y slice from a tomogram of a neuronal cell (four times binned). A horizontally oriented TPPII complex (top) and a vertically oriented TPPII complex (bottom) are indicated by red squares. The latter is, moreover, in close proximity to a single-capped 26S proteasome (black arrow). (B and C) Consecutive slices (with an interval of five slices) of horizontally and vertically oriented TPPII complexes from unbinned subtomograms low-pass filtered to 25 Å are shown corresponding to the TPPII particles in A (red squares). (D and E) “Extended” TPPII complexes with either one or both strands longer than in the 32- or 36-mer assemblies are shown. White arrows point at the two-strand part in extended TPPII complexes. (Scale bars: 200 nm in A; 50 nm in B and C; and 100 nm in D and E.)
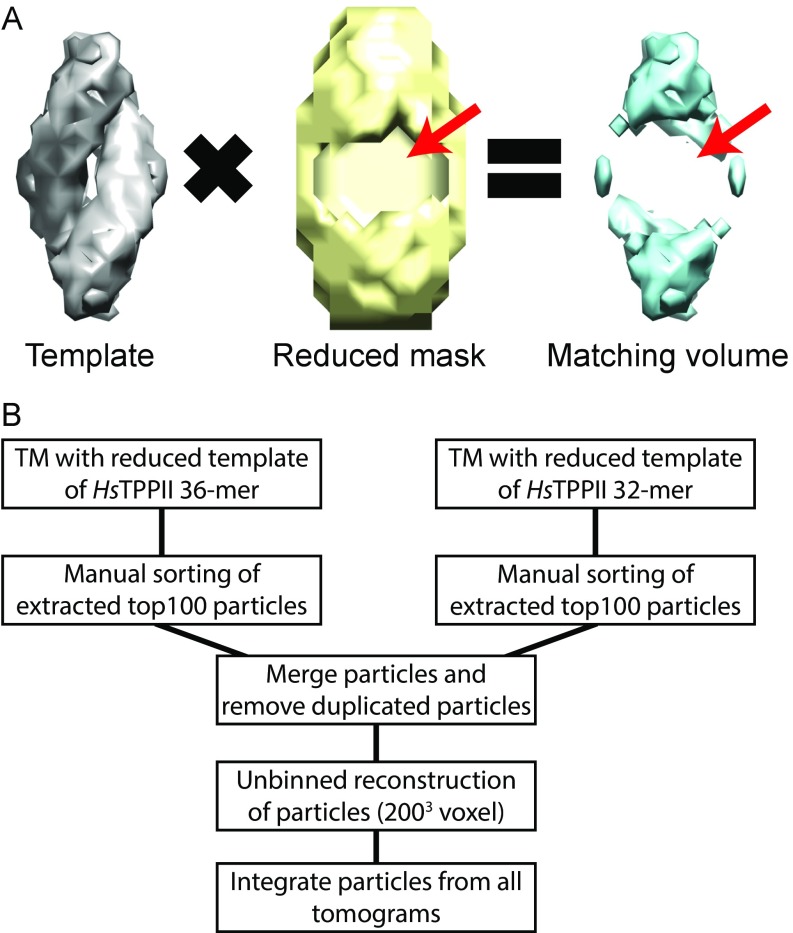
For an initial analysis, the searches for TPPII particles were performed with a 36-mer template derived from the human TPPII structure. To avoid template bias, the center of the matching volume was removed (Fig. S1A). The averaged particles were then classified into longer and shorter complexes. Subsequently, a 32-mer template was used in addition to the 36-mer template for optimizing the detection of shorter TPPII complexes.
Fig. S1.
Workflow of template matching for TPPII. (A) Volume reduction in mask for avoiding template bias. Reduced mask does not cover the whole template. Therefore, a reduced template was used for matching with cellular features. Arrows indicate empty volume that was computationally reduced. (B) Workflow for template matching to particle list creation.
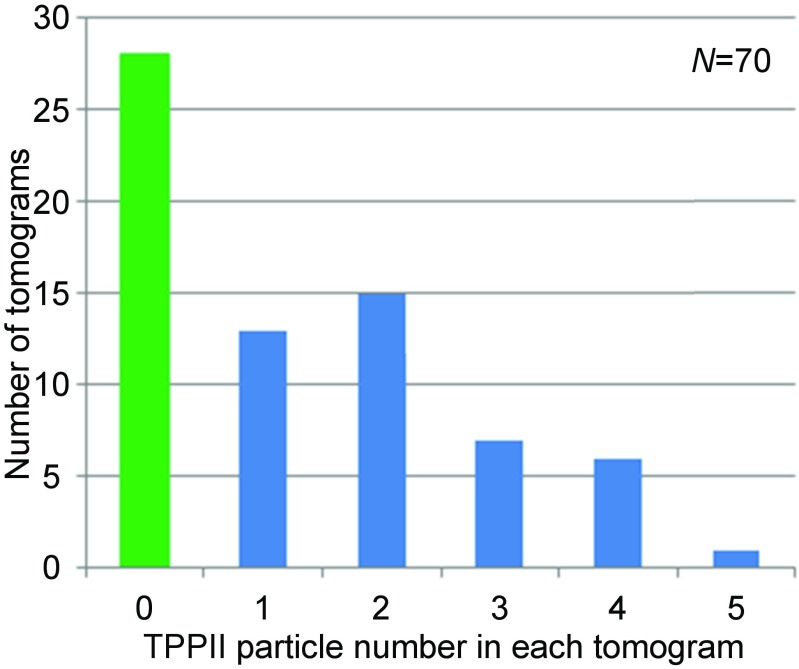
Template matching for TPPII complexes in each tomogram was carried out as shown in Fig. S1B. The TPPII complexes marked by red squares in Fig. 1A were detected by template matching. Consecutive slices of horizontally and vertically oriented TPPII complexes from unbinned subtomograms with low-pass filtering to 25 Å are shown in Fig. 1 B and C, respectively. In total, the searches performed with 36-mer and 32-mer templates identified 93 TPPII particles in 70 tomograms. Twenty-eight tomograms contained no TPPII particle at all (Fig. S2). For comparison, ∼2,000 26S proteasome particles were detected in the same dataset. This indicates that, in neurons, proteasomes are ∼20 times more abundant than TPPII.
Fig. S2.
Histogram of TPPII particle number in each tomogram. Template matchings of 70 tomograms provide 93 particles of TPPII. In the dataset, 28 tomograms (40%) contain no TPPII particle (green), 13 tomograms (18.6%) contain one particle, 15 tomograms (21.4%) contain two particles, 7 tomograms (10%) contain three particles, 6 tomograms (8.6%) contain four particles, and 1 tomogram (1.4%) contains five particles.
TPPII particles were located mainly in the cytosol, often near microtubules or the smooth endoplasmic reticulum, but we never observed TPPII in direct association with membranes. In a few tomograms with either one or both strands longer than in the 32- or 36-mer assemblies, TPPII complexes were detected (Fig. 1 D and E).
Subtomogram Averaging of TPPII Complex.
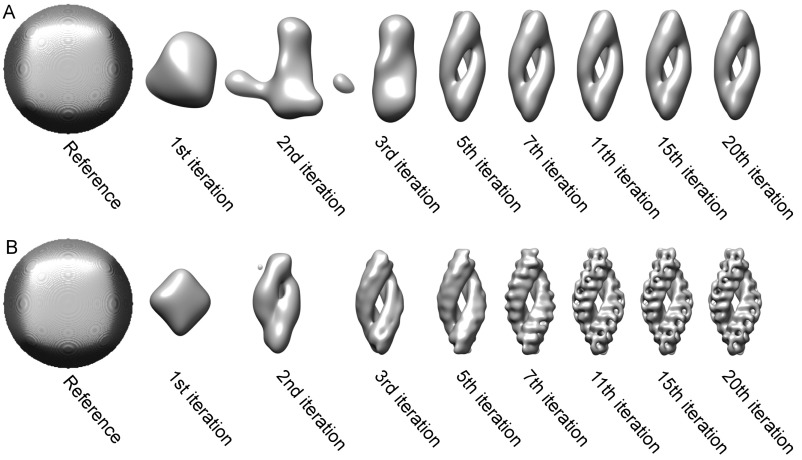
For a detailed structural analysis of the identified TPPII complexes, we used subtomogram averaging (Fig. S3A). A sphere was used as a starting model for the first alignment by fast rotational matching (FRM) to avoid a potential reference bias (Fig. S4A) (23). After only five iterations, the distinct spindle shape of the TPPII complex emerged. However, further iterations did not improve the resulting structure (Fig. S4A). Therefore, we refined the particle position for each particle before unbinned reconstruction. As in the initial processing/alignment step, averaging of recentered particles was carried out by FRM using a sphere as a starting model (Fig. S4B). Recentering of the particle positions improved the quality of the obtained structure dramatically (Fig. S4).
Fig. S3.
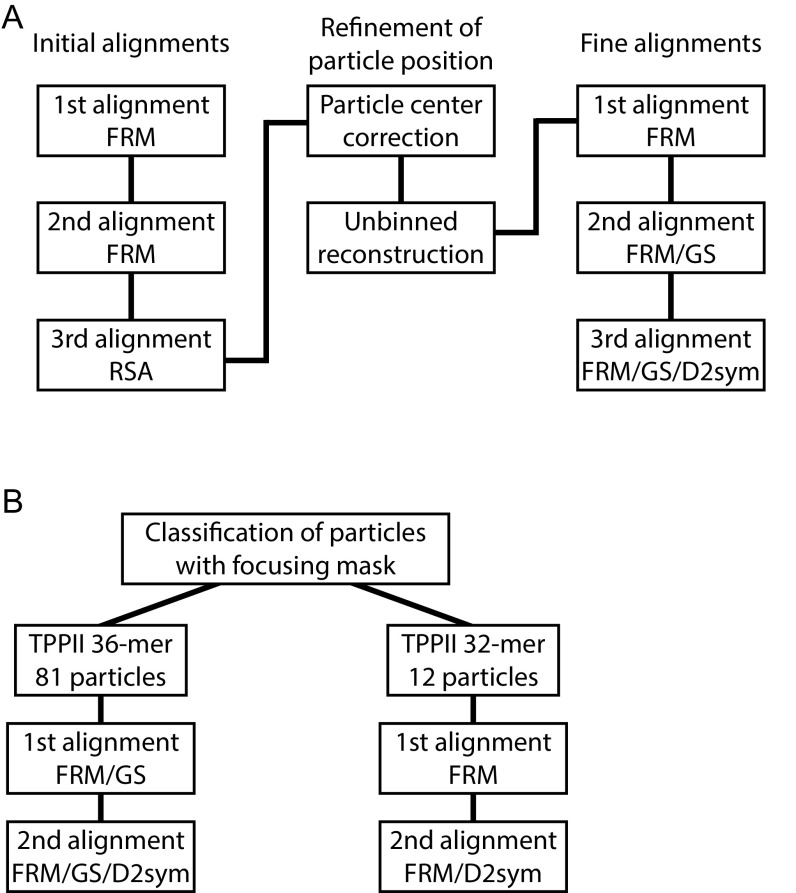
Workflow for alignments. (A) Workflow of alignment processes for all particle alignments. (B) Workflow of alignment processes after classification. D2sym: Application of D2 symmetry; FRM, fast rotational matching, GS, gold standard; and RSA, real space alignment.
Fig. S4.
Evolution of density during subtomogram averaging before and after particle recentering. The sphere reference is generated by TOM toolbox. Several iterations were selected to illustrate the convergence of the subtomogram averaged structure within 20 iterations (Right). (A) First alignment before particle recentering. (B) First alignment after particle recentering.
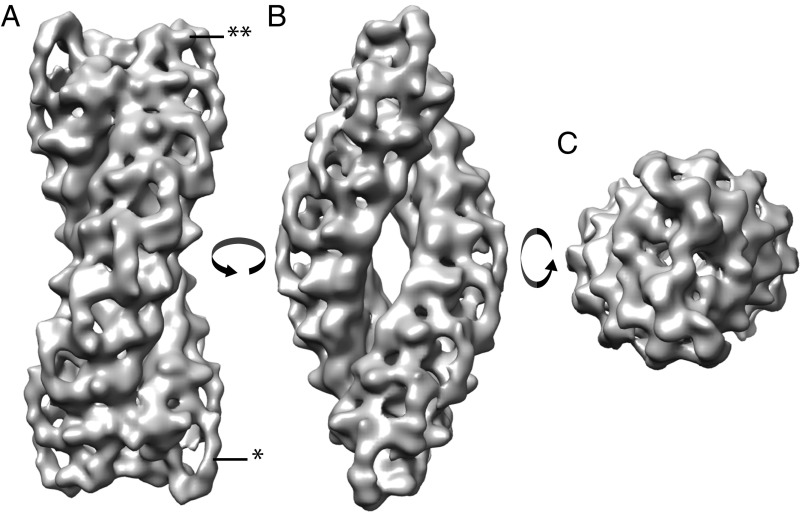
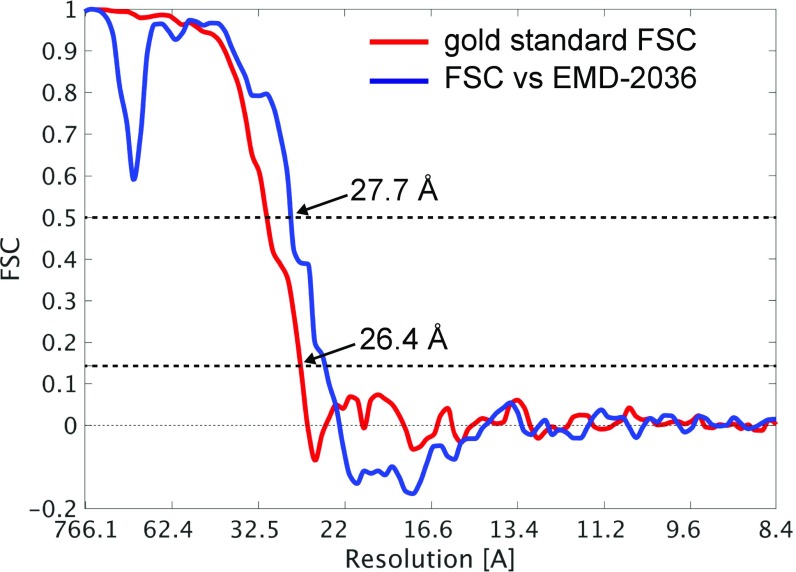
The obtained TPPII structure is double-stranded and spindle-shaped and shows nine handles on each side of the strands (Fig. 2A, single asterisk). Small protrusions are resolved, which correspond to an insertion of the catalytic Asp and His residues (DH insert) (Fig. 2A, double asterisk). The resolution of the final map was evaluated by calculating the Fourier Shell Correlations (FSC) with the “gold standard” method (24) and additionally with an external reference (EMD-2036, Fig. S5). According to the gold standard method, resolution was 26.4 Å (0.143 criterion), and comparison with an external map yielded a resolution of 27.7 Å (0.5 criterion).
Fig. 2.
In situ structure of TPPII. Structure of the TPPII complex after subtomogram averaging. Isosurface representation of the in situ TPPII structure with B-factor applied is shown in three different views: (A) “dumbbell view,” (B) “navette view,” and (C) “top view.” The obtained TPPII structure is double-stranded and spindle-shaped and shows nine handles on each side of the strands (single asterisk). Small protrusions are resolved, which corresponds to an insertion of the catalytic Asp and His residues (DH insert highlighted by the double asterisk).
Fig. S5.
Spatial resolution of TPPII in situ. The FSC curves from the internal gold standard (red line) and from a comparison with an external 9.9-Å density map (EMD-2036) (blue line). In gold standard, an averaged resolution of 26.4 Å is indicated at a 0.143 criterion. In a comparison with an external map, 27.7 Å is indicated at a 0.5 criterion. The Nyquist frequency is at 8.4 Å.
Classification of TPPII Complex.
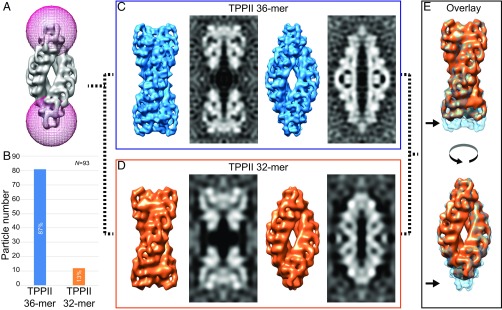
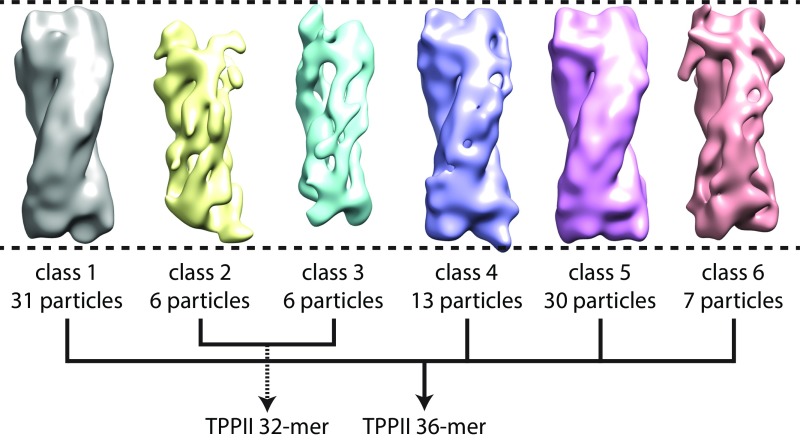
To further investigate structural variations of TPPII in situ, we classified all particles with a mask focusing on both tips and obtained a total of six classes (Fig. 3A and Fig. S6) (25). The comparison of the length of the classified structures showed that four classes (1, 4–6) are longer than the other two classes (2, 3) (Fig. S6). Of 93 particles, 81 particles (87%) belong to the longer structure class and only 12 particles (13%) to the shorter one (Fig. 3B).
Fig. 3.
Classification of TPPII. (A) Classification of all TPPII particles with a mask focusing on both tips. (B) Histogram shows the distribution of the two main subsets: longer structure class corresponding to the TPPII 36-mer and shorter structure class to the TPPII-32 mer. (C) Isosurface representation of the subtomogram average for the longer structure class (TPPII 36-mer, blue) and the corresponding central slices from the density maps are shown: Left two images are the dumbbell view and the Right two images are the navette view of the TPPII 36-mer. (D) Isosurface representations and central slices from the density maps of the TPPII 32-mer (orange) are shown: Left two images are the dumbbell view and Right two images are the navette view. (E) Overlay map of both structures showing the structural differences. The isosurface of the TPPII 36-mer is shown transparently (light blue), and the TPPII 32-mer is shown as a solid (orange). Black arrows indicate the missing dimer in each strand for the 32-mer structure.
Fig. S6.
Raw result of classification with focusing mask and integration into two classes. After the classification into six classes, all models were aligned to the class 1 model. According to the size of each model, classes 1, 4, 5, and 6 are integrated as a TPPII 36-mer. Classes 2 and 3 are integrated as a TPPII 32-mer.
To obtain averaged maps for both subsets, particles were aligned and processed as previously described (Fig. S3B). Due to the small particle number in subset 2 (shorter structure class) the gold standard method could not be used. The map obtained from subset 1 (longer structure class) yielded a similar structure as the sum of all particles (Fig. 3C). In the averaged map of subset 1, not only handles but also DH inserts are apparent. The map with nine handles in one strand (longer class) was assigned to a TPPII 36-mer. In the averaged map from the shorter class only eight handles per strand were visible (Fig. 3D); therefore, this structure was assigned to a TPPII 32-mer. The lower resolution map of the 32-mer lacks features such as the density corresponding to the DH insert. The structural differences between these two subsets of 36-mer and 32-mer complexes are displayed in an overlay map (Fig. 3E) clearly revealing the missing dimer in each strand for the 32-mer structure (Fig. 3E, arrows).
Spatial Relation Between TPPII and 26S Proteasome.
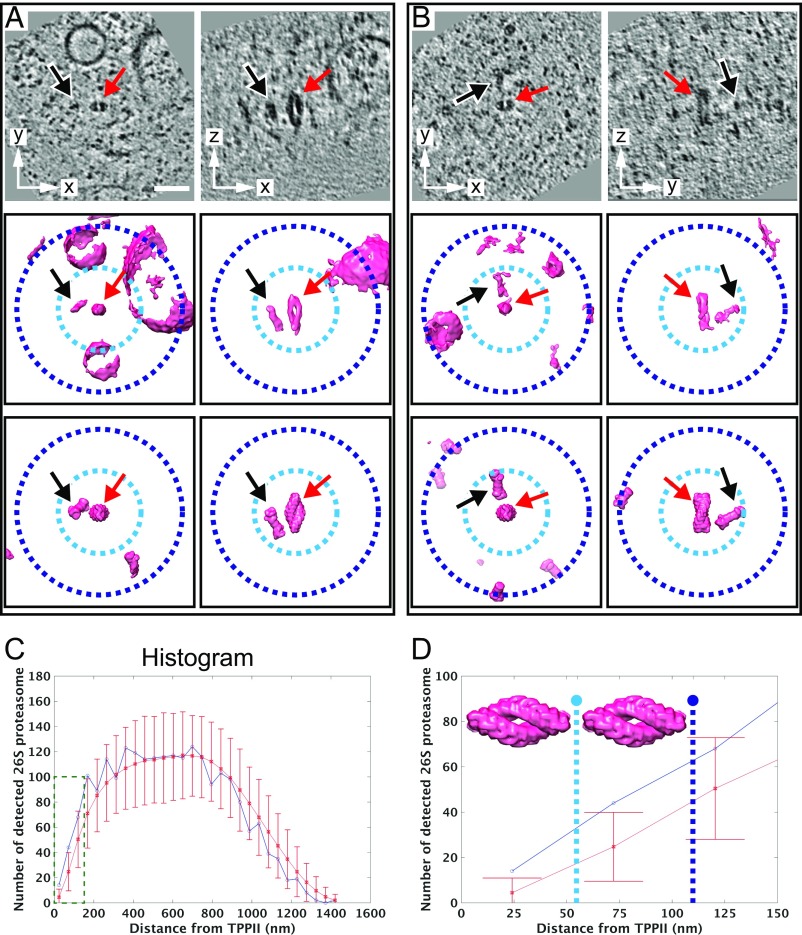
As mentioned before (Fig. 1A, black arrow), 26S proteasome particles are occasionally found in close proximity to the TPPII complexes. Representative subtomograms showing 26S proteasomes localized near TPPII are displayed in Fig. 4 A and B. To determine whether such a close proximity can be attributed to colocalization, we analyzed the spatial relationship between these two protease complexes.
Fig. 4.
Spatial association between TPPII and 26S proteasome. (A and B) Representative subtomograms containing TPPII particles colocalizing with 26S proteasomes. (Left column) Top-view particles. (Right column) Side-view particles. (Top row) Slices through the corresponding subtomograms and (Middle row) their isosurface representations. (Bottom row) The relative orientation of TPPII and 26S proteasome particles (averaged structures are used for better visualization). Red arrows point at TPPII, and black arrows point at the nearest 26S proteasomes. Dashed-line circles indicate the distance range for a single TPPII particle with a 55-nm radius (light blue) and twice the particle length with a 110-nm radius (dark blue). A and B indicate independent subtomograms. (C) Histogram of distances between TPPII and 26S proteasomes displaying the measured distances (blue line) and simulated distances (red line). The simulated distance distribution for random coordinate points include error bars that were obtained by calculating the mean and SDs for all 1,000 simulations (error bars refer to ±3σ SD). (D) Enlarged histogram area from C (dashed-line box). The dashed lines mark the 55 nm for a single TPPII particle length (light-blue dashed line) and the 110 nm for twice the particle length (dark-blue dashed line). (Scale bar: 50 nm.)
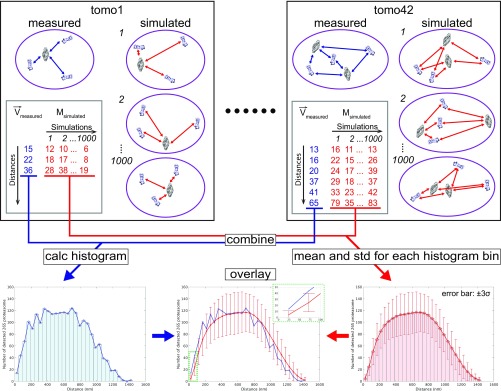
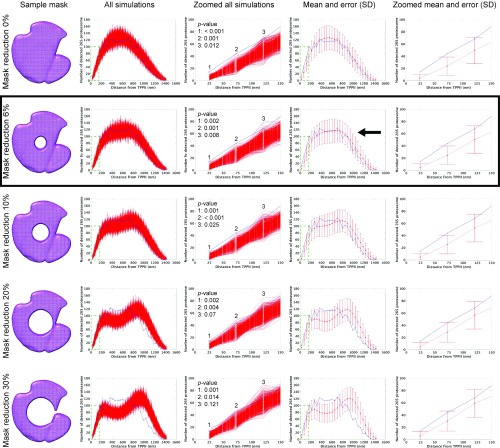
The measured distances between all TPPII particles and all 26S proteasomes were compared with the distances between random points equaling the amount of TPPII particles and 26S particles (Fig. S7). For the latter, 1,000 simulations were computed to estimate the variations among the simulated distances. The positions were calculated inside a mask derived from segmented cells. As the occupiable volume can be further reduced by objects inside the cells, such as vesicles and filaments, the simulations were also carried out with reduced masks (Fig. S8). The masks with 6% volume reduction agreed best with the measured distances (Fig. S8, black arrow). Therefore, the 6% mask reduction was used for further analysis. The overlay of measured and simulated histograms indicates that distances closer than ∼110 nm are out of the range of 3σ SD (P values of the first two bins are 0.002 and 0.001, respectively) (Fig. 4 C and D and Fig. S8). A distance of ∼110 nm is roughly equivalent to twice the length of the TPPII 36-mer (∼110 nm). Therefore, a distance range of 110 nm was applied as a threshold for a spatial association between TPPII and 26S proteasome.
Fig. S7.
Scheme of spatial relation analysis between TPPII and 26S proteasome. The distances from TPPII complexes to all 26S proteasomes were measured in all tomograms (blue double-headed arrows). All measured distances (blue digits) were combined, and a histogram was calculated (Left Bottom). For the simulation, an equal number of coordinate points corresponding to TPPII and 26S proteasomes was randomly distributed in a cellular region corresponding to the same volume used for template matching. Then distances between simulated TPPII and 26S proteasomes were measured (red double-headed arrows). The simulation was repeated 1,000 times. All obtained distances from simulations (red digits) were combined, and the mean and SD were calculated for all histogram bins (Right Bottom). Both histograms, measured and simulated, were overlaid (Middle Bottom). Inset plot is region of interest indicated by green dashed line in overlaid plots.
Fig. S8.
Relation between occupiable volume (protein density) and distance distribution. (Left column) Examples of a mask with volume reduction. (Second from Left column) All plots from 1,000 times simulation (red). (Middle column) Zoomed area indicated by green dashed lines in second from Left column. Inset indicates P values at the first three bins. (Second from Right column) Mean and error bar of SD (red). Error bars of SD indicate ±3σ range. Blue lines in histograms are measured distances. (Right column) Zoomed area indicated by green dashed lines in second from Right column. Mask reduction rate in each row is 0, 6, 10, 20, and 30% from Top to Bottom, respectively. Black arrow indicates the best match between measured and simulated distances. Black frame indicates the mask reduction rate that is used for further analysis.
Within the distance range of 110 nm from each TPPII particle, a total of 70 26S proteasome particles were detected. Some TPPII particles spatially associated with more than one 26S proteasome. The ratio of 36-mer to 32-mer assemblies that associate with the proteasome is the same as the ratio of 36-mer to 32-mer of all TPPII particles after classification. In total, 50% of the TPPII particles associated with 26S proteasomes whereas only 7% of proteasome particles associated with TPPII.
To investigate further what might mediate the spatial association, the subtomograms were surveyed by visual inspection (an example is shown in Fig. S9). No direct physical contacts or connectors between TPPII and 26S proteasome were observed in the available subtomograms. Moreover, there is no evidence that there is a preferred angular orientation between TPPII and the 26S proteasome particles (Fig. 4 A and B, bottom row, and Fig. S9).
Fig. S9.
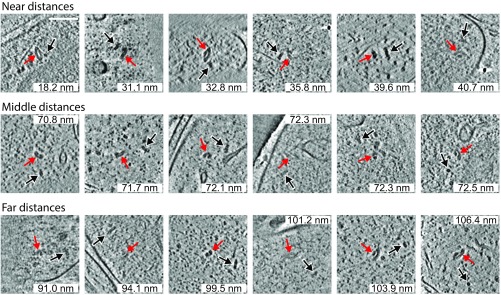
Examples of TPPII and 26S proteasome pairs. The panels show several examples of TPPII and 26S proteasome pairs in near distance, middle distance, and far distance. Red arrows indicate TPPII. Black arrows indicate 26S proteasome. (Scale bar, 100 nm.)
Discussion
Previous structural studies in vitro have established the molecular architecture of the giant TPPII complex. Linear arrays of dimers form twisted strands that pair to form a spindle-shaped ∼6-MDa supercomplex that is stabilized by interactions between the terminal dimers (the double clamp) (14). The active sites are sequestered from the environment in “catalytic chambers” inaccessible for folded proteins (16). This basic architecture is conserved among eukaryotes from fission yeast to humans. There are, however, species-specific variations in the number of dimers per strand: In Drosophila, the dominant form of assembly comprises 10 dimers per strand (hence it is a 40-mer), and in humans it is 9 dimers per strand (hence it is a 36-mer). The in vitro studies have shown that these well-defined assemblies exist only in the concentration window of 0.030–3 mg/mL (17). At higher protein concentrations, the dimer strands tend to grow, yielding polymorphic assemblies; at lower concentrations, the complex disassembles into oligomers.
Therefore, the question arises, what is the assembly state of TPPII in vivo? CET with the VPP allowed us to address this question by examining rat hippocampal neuronal cells cultivated on EM grids. Given the fact that TPPII is a low-abundance protein in most tissues, a large number of tomograms (70 tomograms) had to be taken and searched by template matching for TPPII particles. The total detected number of TPPII molecules (93 particles) appears to be quite low compared with the total detected number of the 26S proteasome (∼2,000 particles) in the same dataset. At a glance it is surprising that the molar ratio of the two complexes that are supposed to process substrates sequentially is ∼1:20. However, one has to keep in mind that a TPPII 36-mer contains 32 catalytic chambers, allowing the processing of substrates in parallel, whereas each 26S complex harbors only a single catalytic chamber.
Even though the total number of TPPII particles was quite limited (93 particles), the quality of the tomograms recorded with the VPP was such that very satisfactory medium-resolution (∼25 Å) structures could be obtained, allowing the establishment of not only the in vivo structure of TPPII, but also some variations of this structure. In the rat hippocampal neuronal cells, spindle-shaped 36-mers are the dominant species (87%), but shorter 32-mers were also observed (13%). A minimum of eight dimers per strand might be required for forming stable two-strand assemblies (15). Obviously, the crowding in the cellular environment is such that the formation of large assemblies (32-mers or larger) is favored. The quality of the primary data allowed us to identify by visual inspection individual extended forms with longer single strands, similar to those found in in vitro experiments.
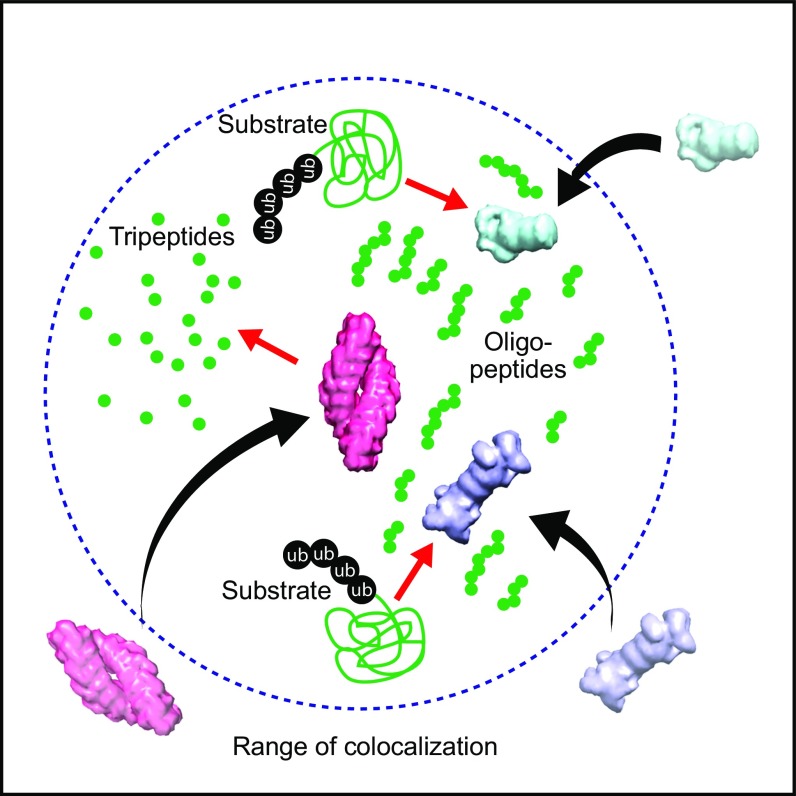
Often TPPII complexes are found in the close neighborhood of 26S proteasomes. Although the number of detected TPPII particles is not very large, our distance analysis shows that such a spatial association is significant. The detected 26S proteasome number in the distance closer than ∼110 nm from TPPII is clearly above the random distribution (3σ; P values of the first two bins are 0.002 and 0.001, respectively) (Fig. 4D and Fig. S8). Of course, simulations rarely recapitulate reality entirely. Our result, however, suggests that “degradation hot spots” exist that facilitate the sequential degradation of substrates (Fig. 5). The questions arising from this observation are obvious: (i) What holds such membrane-less compartments together? and (ii) What are the signals for targeting the molecular players involved in such degradation centers?
Fig. 5.
Scheme of a degradation compartment inhabited by TPPII and proteasomes. Phase separation may form membrane-less compartment (indicated by blue dashed line). The close association facilitates the sequential degradation of oligopeptides.
One possibility would be that molecules exist that act as tethers or connectors linking the TPPII and proteasomes together. Given the quality of the primary data, we would expect to see such tethers if they exist. However, we never found any, and, moreover, the relatively large variations in spatial proximity make their existence unlikely. An affinity, even a weak one between the 26S proteasome and TPPII, might be sufficient to achieve some colocalization. Another possible explanation for the phenomenon is cytosolic compartmentalization by phase separation (26, 27). This remains to be shown, and the molecules driving this phenomenon need to be identified. In principle, CET could be used to perform precise measurements of local variations in crowding and thereby to visualize and map such compartments. The identification of targeting signals is more challenging and may require a well-defined model system and a synthetic approach.
Materials and Methods
Cell Culture and Sample Preparation.
Primary neuron culture was carried out as described by Kaech and Banker (28) with some modifications (SI Materials and Methods) and in accordance with the animal guidelines of the Max Planck Society. After 18 d cultivation, neuronal cells were plunge-frozen with fiducial markers using a Vitrobot. Specimens were stored in liquid nitrogen until use.
Cryo-Electron Tomography.
Tilt-series images with a tilt range of ±60° were collected on a Titan Krios operated at an acceleration voltage of 300 kV with the Volta phase plate (SI Materials and Methods). The pixel size at specimen level was 4.21 Å. The tomograms were reconstructed by MATLAB using the AV3 (29) and TOM toolbox (30).
Image Processing.
A human tripeptidyl peptidase II homo-36-mer (EMD-2036) and homo-32-mer (EMD-2037) were used as templates after rescaling. Template matching, subtomogram averaging, and 3D auto-focus classification were carried out by PyTom (SI Materials and Methods) (31, 32).
Distance Analysis of Spatial Distribution.
Analysis was carried out using MatLab and the TOM toolbox with homemade scripts (SI Materials and Methods). All distances between TPPII and 26S proteasome particles were measured and used to calculate the histogram. The simulation for the distances between TPPII and 26S was repeated 1,000 times. The mean and SDs for all histogram bins were calculated. Simulated and measured distance distributions were overlaid. For the error bars, a SD ± 3σ range was used.
SI Materials and Methods
Cell Culture and Sample Preparation.
Primary neuron culture was carried out as described by Kaech and Banker (28) with some modifications. Gold Quantifoil grids (R1/4, Au 200 mesh, Quantifoil Micro Tools) were used as a substrate for neuronal cell cultivation. Before use, the grids were cleaned by floating them on acetone. Then, additionally, carbon (∼25 nm) was deposited on the grids using a carbon evaporator (MED 020, BAL-TEC). Next, grids were sterilized by UV irradiation for 30 min and immersed in 1 mg/mL poly-l-lysine/0.1 M borate buffer (pH 8.5) in the dark overnight. After poly-l-lysine coating, grids were washed with autoclaved distilled water and soaked in neuronal plating medium in a CO2 incubator until used for cell culture.
Neurons were isolated from the hippocampi of 2-d postnatal rats. The tissues were immersed in cold HBSS–Hepes, minced with a razor blade, trypsinized, and filtered with a cell strainer (Becton Dickinson). Collected cells were suspended in neuronal plating medium, and 4.0 × 10⁵ cells were seeded in 35-mm-diameter petri dishes with four rings, each holding one prepared grid. The cells were cultivated in a CO2 incubator for ∼4 h. Then the grids were transferred to the grid holder in a 60-mm-diameter culture dish containing preconditioned Neurobasal-A/B27 medium and a glial feeder cell layer. Three days after seeding, Ara-C was added (final 5 µM) to the culture dish to stop glial cell duplication. Neurons were cultivated for 18 d. One-third of the culture medium was exchanged once per week.
Neurons cultivated on grids were plunge-frozen in a liquid ethane/propane mixture at close to liquid nitrogen temperature using a Vitrobot (FEI). As fiducial markers for tomographic reconstruction, 4 µL of four times concentrated BSA-coated gold nano particle solution (Aurion 10 nm BSA-coated gold) was dropped on the back side of the grid. The Vitrobot blotting chamber conditions were set to 37 °C, 90% humidity; waiting time was 5 s, and blot time was 10 s. After plunging, excess ethane/propane mixture was blotted from the grid using a small piece of filter paper in the liquid nitrogen surrounding the ethane cup. Grids were stored in liquid nitrogen until use.
Cryo-Electron Tomography.
Cryo-electron tomography was performed on a Titan Krios (FEI) operated at an acceleration voltage of 300 kV. The Titan Krios was equipped with a field-emission gun, Gatan postcolumn energy filter, and a FEI Volta phase plate. Data were recorded using a direct detector camera (K2 summit, Gatan) operated in counting mode. Tilt series were collected using SerialEM (33). Tomographic tilt-series images were collected with the following parameters: magnification 33,000×, resulting in a pixel size of 4.21 Å at the specimen level; tilt range ± 60°; tilt increment 2°; and total dose ∼110 e−/Å2. For data acquisition, images were collected with −1 µm defocus.
To discard intensity outliers from the micrographs of the tilt series, high-intensity pixels beyond 10 SDs were replaced by their neighborhood values. Tilt series were aligned based on fiducial gold markers and localized using the IMOD package (34). Marker position optimization, image alignment (4 degrees of freedom per image: shifts, rotation, magnification), and weighted backprojection of the 3D volume were done in MATLAB using the AV3 (29) and TOM toolbox (30). The micrographs were low-pass filtered at the Nyquist frequency of the 3D reconstruction, depending on the volume.
Template Matching.
A human tripeptidyl peptidase II homo-36-mer (EMD-2036) and homo-32-mer (EMD-2037) (15) were downloaded from The Electron Microscopy Data Bank (EMDB). To calibrate the voxel sizes between EMDB density maps (1.78 Å) and our dataset (4.21 Å), EM density maps from EMDB were rescaled to 1623 voxel. Then these models were trimmed into 1603 voxel. For template matching of eight-times-binned tomograms, these trimmed models were rescaled to 203 voxel.
To avoid template bias, a spherical volume (251 voxels, corresponding to 17.5% of the volume in TPPII 36-mer and 19.7% of the volume in TPPII 32-mer, respectively) was removed from the center of rescaled volumes by using masks. These reduced volumes were used as templates in eight-times-binned tomograms (462 × 462 × 300 pixel volume, (33.68 Å3 per voxel) for template matching in PyTom (31, 32). The cytoplasmic regions of these tomograms were segmented manually in Amira (FEI), and constrained correlation peaks (29) were extracted within these segmented volumes. For each tomogram, the top 100 peaks from both templates were visually inspected, and particle lists containing positives were merged to remove duplicate particles. Subtomograms of 2003 pixel volumes and 4.21-Å pixel size corresponding to the positive hits were reconstructed and used for subsequent analysis.
Subtomogram Alignment and Classification.
As an initial alignment, three steps of subtomogram averaging were performed (Fig. S1B). First, subtomogram averaging was performed using FRM implemented in PyTom (23) with a sphere object as the initial reference and a spherical mask. Second, subtomogram averaging was performed using FRM with an oriented 20th iteration from first averaging as the reference and a spherical mask. Third, subtomogram averaging was performed using real space alignment (RSA) implemented in PyTom (31) with an oriented 20th iteration from second averaging as the reference and a spherical mask.
Based on the particle center in the 10th iteration from RSA, the particle center in each particle was compensated to correct for the displacement of the particle center derived from missing the central volumes in both templates. All particles were reconstructed in 2003-pixel volumes in correspondence to the corrected particle center.
After particle center correction, three steps of subtomogram averaging were performed as fine alignment (Fig. S1B). First, subtomogram averaging after correction was performed using FRM with a sphere object as the initial reference and a spherical mask. The output from first alignment step was oriented and low-pass filtered to 70 Å. This processed map was used as a starting model for the second alignment step. A spherical mask was used for the second alignment. This procedure divides the dataset into two halves that are aligned independently and hence allow resolution determination according to the gold standard FSC (24). Third, subtomogram averaging was performed using FRM with gold standard and D2 symmetry application. The output from second alignment step was oriented, low-pass filtered to 70 Å and D2 symmetry applied. This processed map was used as a starting model for the third alignment step. A tight mask was used for the third alignment.
The spatial resolution of the 20th iteration of the subtomogram averaged density map from the third averaging was measured using FSC. As a resolution criterion, we used FSC = 0.5 for comparing with the external reference FSC = 0.143 for “gold standard FSC.”
After the fine alignment, 3D auto-focus classification (25) with focused a spherical mask encompassing both ends of the averaged map was applied to divide the particles into six classes. Based on the size of the EM density map, particles classified into six classes were integrated into TPPII 36-mer and TPPII 32-mer. After integration into each class, the TPPII 36-mer class and 32-mer class are aligned by FRM with gold standard and FRM, respectively. Then the TPPII 36-mer class and the 32-mer class were aligned by FRM with gold standard and D2 symmetry application and FRM with D2 symmetry application, respectively.
For visualization, positions as well as orientation of the TPPII were taken from the results given by the subtomogram averaging. Visualization of the subtomogram averages was performed by UCSF Chimera (35).
Distance Analysis of Spatial Distribution.
All analysis steps were carried out using MatLab and the TOM toolbox with homemade scripts. To check if there is a spatial relationship between the positions of TPPII and the positions of the 26S proteasome, distances between TPPII and 26S were analyzed. For every TPPII inside one tomogram, all Euclidean distances to the 26S were calculated. This was repeated for all 42 tomograms, and the resulting distances were combined. From these combined 2,206 distances, a histogram with 35 bins was computed. To check if the observed distance distribution significantly differs from a random distribution, a simulation of the 42 tomograms was calculated. To do so for each tomogram, the same amounts of TPPII and 26S particles were randomly placed within a cell mask. Then analogs to the measured position distances between TPPII and 26S were calculated and combined. To estimate how much the distances can vary for different simulations, this was repeated 1,000 times. For each bin of the histogram, the mean value and the SD was computed. To address the influence of the occupiable volume (protein density) on the result of the simulation, masks were reduced by 0, 6, 10, 20, and 30% by cutting out a sphere in the center of the cell mask. The simulation with 6% removed agreed best the observed distances (Fig. S9, black arrows). For visualization, the simulated and the observed distance distributions were overlaid. For the error bars, a SD ± 3σ range was used.
Acknowledgments
We thank Radostin Danev for his kind support in recording tilt-series by cryo-EM with Volta phase plate and fruitful discussion about image processing; Jürgen Peters for critical reading of the manuscript; and Jürgen Cox for helpful discussion about distance analysis.
Footnotes
The authors declare no conflict of interest.
Data deposition: The maps derived from subtomogram averaging reported in this paper have been deposited in The Electron Microscopy Data Bank (accession nos. EMD-4119 and EMD-4120).
This article contains supporting information online at www.pnas.org/lookup/suppl/doi:10.1073/pnas.1701367114/-/DCSupplemental.
References
- 1.Hershko A, Ciechanover A, Varshavsky A. The ubiquitin system. Nat Med. 2000;6:1073–1081. doi: 10.1038/80384. [DOI] [PubMed] [Google Scholar]
- 2.Dolenc I, Seemüller E, Baumeister W. Decelerated degradation of short peptides by the 20S proteasome. FEBS Lett. 1998;434:357–361. doi: 10.1016/s0014-5793(98)01010-2. [DOI] [PubMed] [Google Scholar]
- 3.Voges D, Zwickl P, Baumeister W. The 26S proteasome: A molecular machine designed for controlled proteolysis. Annu Rev Biochem. 1999;68:1015–1068. doi: 10.1146/annurev.biochem.68.1.1015. [DOI] [PubMed] [Google Scholar]
- 4.Tamura N, Lottspeich F, Baumeister W, Tamura T. The role of tricorn protease and its aminopeptidase-interacting factors in cellular protein degradation. Cell. 1998;95:637–648. doi: 10.1016/s0092-8674(00)81634-7. [DOI] [PubMed] [Google Scholar]
- 5.Glickman MH, Ciechanover A. The ubiquitin-proteasome proteolytic pathway: Destruction for the sake of construction. Physiol Rev. 2002;82:373–428. doi: 10.1152/physrev.00027.2001. [DOI] [PubMed] [Google Scholar]
- 6.Reits E, et al. A major role for TPPII in trimming proteasomal degradation products for MHC class I antigen presentation. Immunity. 2004;20:495–506. doi: 10.1016/s1074-7613(04)00074-3. [DOI] [PubMed] [Google Scholar]
- 7.York IA, Bhutani N, Zendzian S, Goldberg AL, Rock KL. Tripeptidyl peptidase II is the major peptidase needed to trim long antigenic precursors, but is not required for most MHC class I antigen presentation. J Immunol. 2006;177:1434–1443. doi: 10.4049/jimmunol.177.3.1434. [DOI] [PubMed] [Google Scholar]
- 8.Tomkinson B, Jonsson AK. Characterization of cDNA for human tripeptidyl peptidase II: The N-terminal part of the enzyme is similar to subtilisin. Biochemistry. 1991;30:168–174. doi: 10.1021/bi00215a025. [DOI] [PubMed] [Google Scholar]
- 9.Bålöw RM, Tomkinson B, Ragnarsson U, Zetterqvist O. Purification, substrate specificity, and classification of tripeptidyl peptidase II. J Biol Chem. 1986;261:2409–2417. [PubMed] [Google Scholar]
- 10.Geier E, et al. A giant protease with potential to substitute for some functions of the proteasome. Science. 1999;283:978–981. doi: 10.1126/science.283.5404.978. [DOI] [PubMed] [Google Scholar]
- 11.Rockel B, Kopec KO, Lupas AN, Baumeister W. Structure and function of tripeptidyl peptidase II, a giant cytosolic protease. Biochim Biophys Acta. 2012;1824:237–245. doi: 10.1016/j.bbapap.2011.07.002. [DOI] [PubMed] [Google Scholar]
- 12.Tomkinson B. Tripeptidyl peptidases: Enzymes that count. Trends Biochem Sci. 1999;24:355–359. doi: 10.1016/s0968-0004(99)01435-8. [DOI] [PubMed] [Google Scholar]
- 13.Rose C, et al. Characterization and inhibition of a cholecystokinin-inactivating serine peptidase. Nature. 1996;380:403–409. doi: 10.1038/380403a0. [DOI] [PubMed] [Google Scholar]
- 14.Rockel B, et al. Molecular architecture and assembly mechanism of Drosophila tripeptidyl peptidase II. Proc Natl Acad Sci USA. 2005;102:10135–10140. doi: 10.1073/pnas.0504569102. [DOI] [PMC free article] [PubMed] [Google Scholar]
- 15.Schönegge AM, et al. The structure of human tripeptidyl peptidase II as determined by a hybrid approach. Structure. 2012;20:593–603. doi: 10.1016/j.str.2012.01.025. [DOI] [PubMed] [Google Scholar]
- 16.Chuang CK, et al. Hybrid molecular structure of the giant protease tripeptidyl peptidase II. Nat Struct Mol Biol. 2010;17:990–996. doi: 10.1038/nsmb.1870. [DOI] [PMC free article] [PubMed] [Google Scholar]
- 17.Seyit G, Rockel B, Baumeister W, Peters J. Size matters for the tripeptidylpeptidase II complex from Drosophila: The 6-MDa spindle form stabilizes the activated state. J Biol Chem. 2006;281:25723–25733. doi: 10.1074/jbc.M602722200. [DOI] [PubMed] [Google Scholar]
- 18.Lučič V, Rigort A, Baumeister W. Cryo-electron tomography: The challenge of doing structural biology in situ. J Cell Biol. 2013;202:407–419. doi: 10.1083/jcb.201304193. [DOI] [PMC free article] [PubMed] [Google Scholar]
- 19.Danev R, Buijsse B, Khoshouei M, Plitzko JM, Baumeister W. Volta potential phase plate for in-focus phase contrast transmission electron microscopy. Proc Natl Acad Sci USA. 2014;111:15635–15640. doi: 10.1073/pnas.1418377111. [DOI] [PMC free article] [PubMed] [Google Scholar]
- 20.Fukuda Y, Laugks U, Lučić V, Baumeister W, Danev R. Electron cryotomography of vitrified cells with a Volta phase plate. J Struct Biol. 2015;190:143–154. doi: 10.1016/j.jsb.2015.03.004. [DOI] [PubMed] [Google Scholar]
- 21.Asano S, et al. Proteasomes. A molecular census of 26S proteasomes in intact neurons. Science. 2015;347:439–442. doi: 10.1126/science.1261197. [DOI] [PubMed] [Google Scholar]
- 22.Mahamid J, et al. Visualizing the molecular sociology at the HeLa cell nuclear periphery. Science. 2016;351:969–972. doi: 10.1126/science.aad8857. [DOI] [PubMed] [Google Scholar]
- 23.Chen Y, Pfeffer S, Hrabe T, Schuller JM, Förster F. Fast and accurate reference-free alignment of subtomograms. J Struct Biol. 2013;182:235–245. doi: 10.1016/j.jsb.2013.03.002. [DOI] [PubMed] [Google Scholar]
- 24.Scheres SHW, Chen S. Prevention of overfitting in cryo-EM structure determination. Nat Methods. 2012;9:853–854. doi: 10.1038/nmeth.2115. [DOI] [PMC free article] [PubMed] [Google Scholar]
- 25.Chen Y, Pfeffer S, Fernández JJ, Sorzano COS, Förster F. Autofocused 3D classification of cryoelectron subtomograms. Structure. 2014;22:1528–1537. doi: 10.1016/j.str.2014.08.007. [DOI] [PubMed] [Google Scholar]
- 26.Hyman AA, Weber CA, Jülicher F. Liquid-liquid phase separation in biology. Annu Rev Cell Dev Biol. 2014;30:39–58. doi: 10.1146/annurev-cellbio-100913-013325. [DOI] [PubMed] [Google Scholar]
- 27.Mitrea DM, Kriwacki RW. Phase separation in biology: Functional organization of a higher order. Cell Commun Signal. 2016;14:1. doi: 10.1186/s12964-015-0125-7. [DOI] [PMC free article] [PubMed] [Google Scholar]
- 28.Kaech S, Banker G. Culturing hippocampal neurons. Nat Protoc. 2006;1:2406–2415. doi: 10.1038/nprot.2006.356. [DOI] [PubMed] [Google Scholar]
- 29.Förster F, Medalia O, Zauberman N, Baumeister W, Fass D. Retrovirus envelope protein complex structure in situ studied by cryo-electron tomography. Proc Natl Acad Sci USA. 2005;102:4729–4734. doi: 10.1073/pnas.0409178102. [DOI] [PMC free article] [PubMed] [Google Scholar]
- 30.Nickell S, et al. TOM software toolbox: Acquisition and analysis for electron tomography. J Struct Biol. 2005;149:227–234. doi: 10.1016/j.jsb.2004.10.006. [DOI] [PubMed] [Google Scholar]
- 31.Hrabe T, et al. PyTom: A python-based toolbox for localization of macromolecules in cryo-electron tomograms and subtomogram analysis. J Struct Biol. 2012;178:177–188. doi: 10.1016/j.jsb.2011.12.003. [DOI] [PubMed] [Google Scholar]
- 32.Chen Y, et al. 2012 9th IEEE International Symposium on Biomedical Imaging. IEEE; New York: 2012. Detection and identification of macromolecular complexes in cryo-electron tomograms using support vector machines; pp. 1373–1376. [Google Scholar]
- 33.Mastronarde DN. Automated electron microscope tomography using robust prediction of specimen movements. J Struct Biol. 2005;152:36–51. doi: 10.1016/j.jsb.2005.07.007. [DOI] [PubMed] [Google Scholar]
- 34.Kremer JR, Mastronarde DN, McIntosh JR. Computer visualization of three-dimensional image data using IMOD. J Struct Biol. 1996;116:71–76. doi: 10.1006/jsbi.1996.0013. [DOI] [PubMed] [Google Scholar]
- 35.Pettersen EF, et al. UCSF Chimera: A visualization system for exploratory research and analysis. J Comput Chem. 2004;25:1605–1612. doi: 10.1002/jcc.20084. [DOI] [PubMed] [Google Scholar]


