

Abstract
Purpose: To develop a new calcium score for use with unenhanced cardiac computed tomography (CT) that can be used to define the percentage of coronary arteries affected by calcium and to correlate this score with risk factors and cardiovascular events.
Materials and Methods: Institutional review boards at all participating centers approved this HIPAA-compliant study, and all participants gave written informed consent. Calcium coverage score (CCS), which represents the percentage of coronary arteries affected by calcific plaque, was calculated for 3252 participants in the Multi-Ethnic Study of Atherosclerosis in whom calcific plaque was detected with CT. Quasi-Poisson models were used to estimate associations (assessed by using t tests with robust standard errors) between CCS and risk factors. Associations between the CCS, Agatston, and calcium mass scores (hereafter, mass scores) and outcomes were estimated and assessed by using Cox proportional hazards models with Wald tests. The predictive ability of these models was assessed by using area under the receiver operating characteristic curves and bootstrap t tests.
Results: After adjustments were made for age, race, ethnicity, and sex in the quasi-Poisson model, CCS was associated with hypertension, dyslipidemia, and diabetes (P < .001 for all diseases). After adjustments for age and sex, a twofold increase in CCS was associated with a 52% (95% confidence interval: 34%, 72%) increase in risk for any coronary heart disease (CHD) event. When Agatston or mass scores were included with CCS in a Cox model for prediction of CHD events, neither Agatston score nor mass score was a significant predictor, whereas CCS remained significantly associated with CHD events. Although receiver operating characteristic curves suggested that there was a difference between CCS score and Agatston and mass scores in prediction of a cardiac event, no differences in prediction of hard cardiac events (myocardial infarction, death) were found.
Conclusion: Both spatial distribution and amount of calcified plaque contribute to risk for CHD.
© RSNA, 2008
Supplemental material: http://radiology.rsnajnls.org/cgi/content/full/2473071469/DC1
Keywords: AUC = area under the receiver operating characteristic curve, CCR = calcium coverage ratio, CCS = calcium coverage score, CHD = coronary heart disease, CI = confidence interval, LAD = left anterior descending, LCX = left circumflex, LM = left main, MESA = Multi-Ethnic Study of Atherosclerosis, RCA = right coronary artery
Coronary artery calcified plaque detected with cardiac computed tomography (CT) enables us to document the presence of coronary atherosclerosis and identify individuals who have an elevated risk for cardiovascular events (1–4). Typically, the total coronary calcified plaque burden has been measured, most frequently with the Agatston score (5). High-spatial-resolution CT scanners enable us to precisely determine the location of calcified regions within coronary arteries. Few investigators have used this feature to describe the spatial distribution of calcified plaques in the coronary arteries. Although the presence and amount of calcific plaque as measured with the Agatston score are known to be associated not only with demographic factors and risk factors (6–9) but also with cardiovascular events (1–4), information about the spatial distribution of calcific plaque might provide additional insight into the pathogenesis of coronary atherosclerosis and the risk of cardiovascular events.
The purpose of our study was to develop a new calcium score for use with unenhanced cardiac CT that can be used to define the percentage of coronary arteries affected by calcium and to correlate this score with risk factors and cardiovascular events.
MATERIALS AND METHODS
Data Collection
The Multi-Ethnic Study of Atherosclerosis (MESA) was initiated in July 2000 to investigate the prevalence, correlates, and progression of subclinical cardiovascular disease in individuals without known cardiovascular disease (10). This prospective cohort study included 6814 women and men aged 45–84 years recruited from six U.S. communities. A total of 146 CT studies were unavailable for review. The institutional review boards at all participating centers approved the study, and all participants gave written informed consent. This study was compliant with the Health Insurance Portability and Accountability Act.
Standardized questionnaires were used to obtain information about medication used to treat high blood pressure, high cholesterol level, or diabetes. Resting blood pressure was measured three times with participants in the seated position by using an automated oscillometric sphygmomanometer (Dinamap, model Pro 100; Critikon, Tampa, Fla). The second and third blood pressure measurements were used to calculate a mean value, which was then used for analysis. Total cholesterol, high-density lipoprotein cholesterol, triglyceride, and glucose levels were measured in blood samples obtained after a 12-hour fast. The low-density lipoprotein cholesterol level was determined with the Friedewald equation (11).
Patients with diabetes were those with a fasting glucose level of 126 mg/dL or higher or those who used hypoglycemic medication. Hypertension status was classified according to the Seventh Report of the Joint National Committee on the Detection, Evaluation, and Treatment of High Blood Pressure (12). Patients with dyslipidemia were those with a total cholesterol–to–high-density lipoprotein ratio higher than 5.0 or those who were taking a lipid-lowering medication.
Chest CT was performed with (a) an electrocardiographically triggered (at 80% of the R-R interval) electron-beam CT scanner (Imatron C-150; GE Medical Systems, Milwaukee, Wis) at the Chicago, Ill; Los Angeles, Calif; and New York, NY, field centers and (b) a prospective electrocardiographically triggered (at 50% of the R-R interval) multidetector CT scanner (Lightspeed, GE Medical Systems; VolumeZoom, Siemens, Erlangen, Germany) that was used to acquire four simultaneous 2.5-mm sections for each cardiac cycle in a sequential or transverse scanning mode at the Baltimore, Md; Forsyth County, NC; and St Paul, Minn, field centers. Two CT images were obtained in all participants (13). We analyzed the studies obtained in participants who had calcific plaque depicted on at least one image. For participants who had calcific plaque depicted on both images, one image was randomly selected for analysis.
CT image data were available in 3252 of the 3398 participants with calcific plaque seen on at least one image. We compared the demographics and prevalence of risk factors between these 3252 participants and the 3416 participants in whom calcific plaque was not detected (Table 1). These groups were significantly different with respect to all demographic and risk factors that were considered.
Table 1.
Demographics and Prevalence of Risk Factors at Baseline
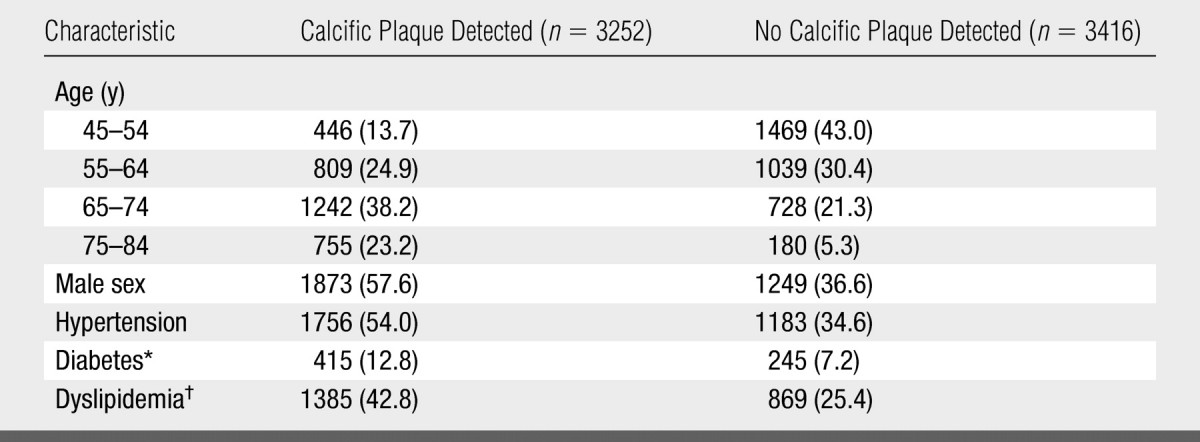
Note.—Data are numbers of patients. Data in parentheses are percentages. Mean age (± standard deviation) was 66.4 years ± 9.5 in the patients in whom calcific plaque was detected and 58.0 years ± 9.1 in the patients in whom calcific plaque was not detected. On the basis of the results of χ2 tests for proportions and t tests for means, the two groups were different with respect to all demographic and risk factors (P < .001).
Data were available for only 3242 patients in whom calcific plaque was detected and 3402 patients in whom calcific plaque was not detected.
Data were available for only 3239 patients in whom calcific plaque was detected and 3415 patients in whom calcific plaque was not detected.
Calcium Scoring
A detailed description of the reading protocol used in the MESA has been reported (14). Scans were read (under the supervision of R.D., who had over 10 years experience reading coronary CT scans) centrally at the Los Angeles Biomedical Research Institute at Harbor-UCLA Medical Center, Los Angeles, Calif, to identify and quantify coronary artery calcification. The coronary artery calcium measurements were adjusted with a standard calcium phantom that was scanned at the same time that each participant was scanned (15). Each participant was scanned twice, and either the mean Agatston score or the mean CT calcium mass score (hereafter, mass score) was used in subsequent analyses.
Spatial Distribution of Coronary Calcium
As part of routine CT image interpretation in the MESA study, a cardiologist or radiologist identified the left main (LM), left anterior descending (LAD), and left circumflex (LCX) coronary arteries, as well as the right coronary artery (RCA), on the CT images by indicating waypoints along the visualized or anatomic course of the arteries. Once readers were trained, these waypoint identifications took about 2 minutes per case. These waypoints were then used to determine the three-dimensional course of the arteries. We determined the presence of calcific plaque in short intervals along the arteries, which we called subdivisions. To measure absolute distances, we defined an absolute subdivision as a 5-mm linear segment of the arterial trajectory. To measure the relative distance along the arterial trajectory, we defined a relative subdivision as 5% of the total length of the artery.
To calculate a participant's calcium coverage score (CCS), we divided the number of absolute subdivisions in which calcific plaque was present by the total number of absolute subdivisions in the coronary arteries and then multiplied this quotient by 100 to estimate the percentage of coronary arteries affected by calcific plaque. Agatston and mass scores were calculated for each subdivision. If there was more than one calcified region within a subdivision, the calcium score for that subdivision was the sum of the scores for each calcified region. Details that describe how the lengths of the arteries were calculated and how the subdivisions were identified are presented in Appendix E1 (http://radiology.rsnajnls.org/cgi/content/full/2473071469/DC1).
Cardiovascular Events
We followed up the entire MESA cohort for incident cardiovascular events for a median of 41 months (range, 0–64 months). A telephone interviewer contacted each participant (or his or her family) at 9–12-month intervals to inquire about interim hospital admissions, cardiovascular outpatient diagnoses, and death. To verify self-reported diagnoses, we requested copies of all medical records for hospitalizations and outpatient cardiovascular diagnoses. To verify deaths, we requested death certificates and conducted next-of-kin interviews for out-of-hospital cardiovascular death. We obtained records for an estimated 98% of patients with reported cardiovascular events that required hospitalization. Some information was available for 95% of reported outpatient diagnostic encounters.
Trained personnel abstracted medical records that suggested possible cardiovascular events. Two physicians independently classified and assigned incidence dates. Reviewers classified myocardial infarction as definite, probable, or absent primarily on the basis of the combination of symptoms, electrocardiographically triggered CT findings, and cardiac biomarker levels. If disagreements persisted after review and adjudication, a full mortality and morbidity review committee made the final classification. Death from coronary heart disease (CHD) was classified as present or absent on the basis of hospital records and family interviews. For CHD to be considered the definite cause of death, myocardial infarction or chest pain must have occurred 28 days or 72 hours, respectively, before death; the patient must have had a history of CHD; and there must have been an absence of a known nonatherosclerotic or noncardiac cause of death. Adjudicators used their clinical judgment to grade angina as definite, probable, or absent. Diagnosis of definite or probable angina required clear and definite documentation of symptoms distinct from those of patients in whom myocardial infarction was diagnosed. Diagnosis of definite angina also required objective evidence of reversible myocardial ischemia or obstructive coronary artery disease. In this study, we defined the composite CHD endpoint such that it included definite and probable myocardial infarction, definite CHD death, and definite angina. Probable angina was included only if it was associated with coronary revascularization.
Statistical Analysis
Demographic and risk factors were compared by using χ2 tests for percentages and t tests for mean values. Calcium coverage plots were used to describe the prevalence of calcific plaque in each subdivision (relative or absolute) of the artery by plotting the proportion of participants in the cohort of interest who had calcific plaque in each subdivision against the distance from the vessel origin along the artery to the center of that subdivision. To plot the cumulative distribution of calcific plaque along the length of the artery, subdivision-specific (relative or absolute) Agatston or mass scores were calculated and then divided by total Agatston or mass scores, respectively, for the artery to estimate the proportion of all the calcium in the artery contained within each subdivision. The cumulative proportion of calcium in the subdivisions was then plotted against the distance along the artery to the center of the subdivision. The distribution of CCS was shown on a histogram, and the relationship between CCS and Agatston score was shown on a box plot.
We used quasi-Poisson regression models (Poisson regression with robust standard errors) (16) to estimate the associations of hypertension, dyslipidemia, and diabetes with CCS. These associations are reported as the calcium coverage ratio (CCR). Interpretation of the CCR is similar to that of a risk ratio. The CCR is the ratio of the CCS in the group of interest to the CCS in a reference group, adjusted for other covariates, as appropriate. The Agatston and mass scores were also included additively in the quasi-Poisson regression models to adjust the estimate of the association between the risk factors and the CCS.
We used Cox proportional hazards models adjusted for age and sex to assess the relationships between CCS, Agatston and mass scores, time to any CHD event (definite or probable myocardial infarction, definite CHD death, or definite or probable angina), and time to a hard CHD event (definite or probable myocardial infarction or definite CHD death). The scores were log base 2 transformed so that the exponentiated coefficient could be interpreted as the hazard ratio associated with a twofold increase. To examine the predictive ability of the CCS, we plotted receiver operating characteristic curves based on the linear predictor from the adjusted Cox models and calculated the area under the receiver operating characteristic curve (AUC). The AUCs were compared by using P values calculated with the bootstrap technique. The reference standard was event status at the end of follow-up. We also estimated and plotted Kaplan-Meier survival curves for quartiles of the CCS (quartile 1, 1.0%–2.4%; quartile 2, 2.4%–5.3%; quartile 3, 5.3%–13.6%; and quartile 4, 13.6%–64.9%), and we included participants who had no calcific plaque identified on either image as the reference group. We also estimated survival curves with respect to quartiles of the Agatston (quartile 1, 1.56–21.8; quartile 2, 21.8–86.9; quartile 3, 86.9–301; and quartile 4, 301–6520) and mass (quartile 1, 0.58–4.76; quartile 2, 4.76–18.9; quartile 3, 18.9–65; and quartile 4, 65–1490) scores. Cox proportional hazards models were used to obtain the hazard ratio for each group compared with that for the reference group. Intraclass correlation coefficients were used to assess the reproducibility of the CCS and the Agatston and mass scores. P < .05 indicated a significant difference.
RESULTS
Overall, there were an average of 23 waypoints (range, five to 42 waypoints) for the LM and LAD coronary arteries, 20 waypoints (range, seven to 41 waypoints) for the LCX coronary artery, and 20 waypoints (range, seven to 37 waypoints) for the RCA. The average lengths of the LM and LAD coronary arteries, LCX coronary artery, and RCA were 143 mm, 103 mm, and 107 mm, respectively.
Relative subdivisions revealed 1285 (40%), 481 (15%), and 646 (20%) participants had calcific plaque at 15%–20% of the length of their LM and LAD coronary arteries, LCX coronary artery, and RCA, respectively (Fig 1). We found that of all the participants, 675 (21%) had calcific plaque deposits in the first 5 mm of the LM and LAD coronary arteries, while 880 (27%) and 572 (18%) participants had calcific plaque in the first 5 mm of the LCX coronary artery and the RCA, respectively. For the LCX artery, the prevalence of calcific plaque decreased as the distance from the ostium increased. However, for the LM and LAD coronary arteries and the RCA, the prevalence of calcific plaque stayed the same or increased over the first 20 mm (corresponding to approximately 15%) of the proximal arterial length.
Figure 1:

Graphs show the prevalence of calcific plaque along the arteries. Graphs in the left column represent relative distance, with each point representing the fraction of subjects who have calcium within an interval representing one-twentieth of the total length of the artery. Graphs in the right column represent absolute distance, with each point representing the fraction of subjects who have calcific plaque within 5-mm intervals along the artery.
On average, participants had 50% of their calcific plaque in the proximal 15% (approximately 15 mm) of their LCX coronary artery (Fig 2). However, on average, participants had 50% of their calcific plaque in the proximal 25 mm of their LM and LAD coronary arteries and RCA. Calcific plaque had a more diffuse distribution in the RCA than in the LM and LAD coronary arteries or the LCX artery. Plots of the cumulative distribution of the mass score were similar to Agatston cumulative distribution plots. The median CCS was 5.3% (range, 1.0%–63.6%) (Fig 3).
Figure 2:

Graphs show cumulative distribution of amount of calcific plaque along the artery, as measured with the Agatston score.
Figure 3:

Top: Boxplots of the Agatston score by deciles of the CCS. The thick horizontal line across the boxes corresponds to the median. The top and bottom of the boxes correspond to the second and third quartiles, respectively. The dashed lines extend to either the extreme values of the data or the median ± 1.5 times the interquartile range. Any points beyond this are plotted separately. Bottom: Histogram of the CCS (shown as percentages). The x-axes for the two plots are aligned.
Association of Calcium Coverage with Risk Factors
The CCR for participants with diabetes compared with that for participants without diabetes was 1.44, indicating that, on average, patients with diabetes have 44% more of their coronary artery tree affected by calcific plaque than do patients without diabetes (Table 2). The CCR was 1.30 for participants with dyslipidemia compared with those without dyslipidemia and 1.22 for subjects with hypertension compared with those without hypertension. When either the Agatston score or the mass score was included as a predictor with the risk factors (Table 2), the CCRs decreased dramatically but were still significant. For example, among participants with the same Agatston score or mass score, calcific plaque will affect 5% more of the arterial length in patients with diabetes than in patients without diabetes (P < .02). Similar values for participants with dyslipidemia and hypertension were 5% and 6%, respectively (P < .01).
Table 2.
CCR Based on Absolute Length of Arteries for Selected Risk Factors Adjusted for Age, Race, Ethnicity, and Sex
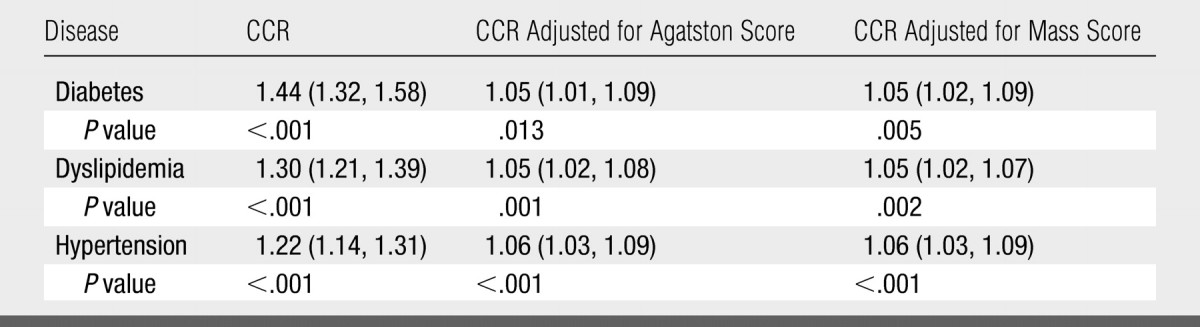
Note.—Data in parentheses are 95% confidence intervals (CIs).
Association of CCS with Cardiovascular Events
In the 3252 participants with nonzero Agatston or mass scores, 138 cardiovascular events occurred, on average, during 3.5 years of follow-up. Seventy-seven of these events were hard CHD events.
CCS and Agatston and mass scores were significant predictors of CHD events (Table 3) (P < .05). A twofold increase in CCS was associated with a 34% (95% CI: 14%, 57%) increase in the risk of hard CHD events; whereas, a twofold increase in the Agatston or mass score was associated with an increase of 14% (95% CI: 3%, 26%) or 11% (95% CI: 2%, 22%), respectively, in the risk of hard CHD events. When both the CCS and the Agatston score were used to predict time to a hard CHD event, the hazard ratios associated with a twofold increase in CCS and Agatston score became 1.70 (95% CI: 1.16, 2.49) and 0.85 (95% CI: 0.68, 1.07), respectively. Likewise, when both CCS and mass score were used to predict time to a hard CHD event, the hazard ratios associated with a twofold increase in CCS and mass score were 1.71 (95% CI: 1.15, 2.53) and 0.85 (95% CI: 0.66, 1.08), respectively. For both outcomes, neither Agatston score nor mass score was a significant predictor of the time to a hard CHD event when CCS was also in the model.
Table 3.
Hazard Ratios Adjusted for Age and Sex for Hard CHD Events and All CHD Events for a Twofold Increase in CCS, Agatston Score, and Mass Score
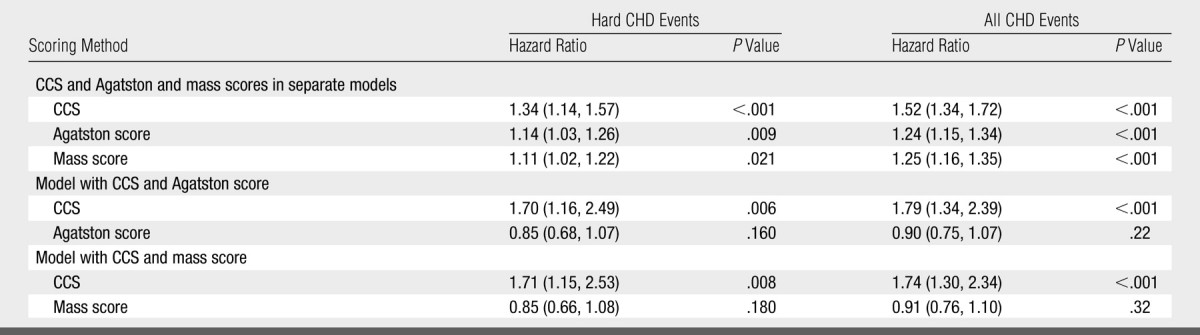
Note.—Data in parentheses are 95% CIs.
For all CHD events, AUC for the CCS (0.70) was significantly higher than AUC for either the Agatston score (P = .003) or the mass score (P = .006) (Fig 4). For hard CHD events, there was no significant difference between the AUC for the CCS and the AUC for the Agatston score (P = .076) or between the AUC for the CCS and the AUC for the mass score (P = .081).
Figure 4:

Receiver operating characteristic curves for predicting all CHD events (left) and hard CHD events (right) with CCS, Agatston score, and mass score, with adjustments for age and sex. The AUCs are shown. P values for the difference between AUC for the CCS and AUC for the Agatston and mass scores when predicting all CHD events were .003 and .006, respectively. P values for the difference between AUC for the CCS and the Agatston and mass scores when predicting all CHD events were .076 and .081, respectively.
In the first, second, third, and fourth quartiles of the CCS, there were 10, 23, 38, and 67 events, respectively. In the first, second, third, and fourth quartiles of the Agatston score, there were 17, 19, 41, and 61 events, respectively. In the first, second, third, and fourth quartiles of the mass score, there were 16, 18, 47 and 57 events, respectively (Fig 5). The four quartiles of CCS appeared to be well separated for both groups of CHD events; whereas, the first two quartiles of the Agatston and mass scores were close to each other or overlapping. These hazard ratios showed that the Agatston score and the mass score did not enable us to differentiate between the first and second quartiles in terms of risk; whereas, the CCS tended to allow us to classify participants into more easily defined risk categories.
Figure 5:
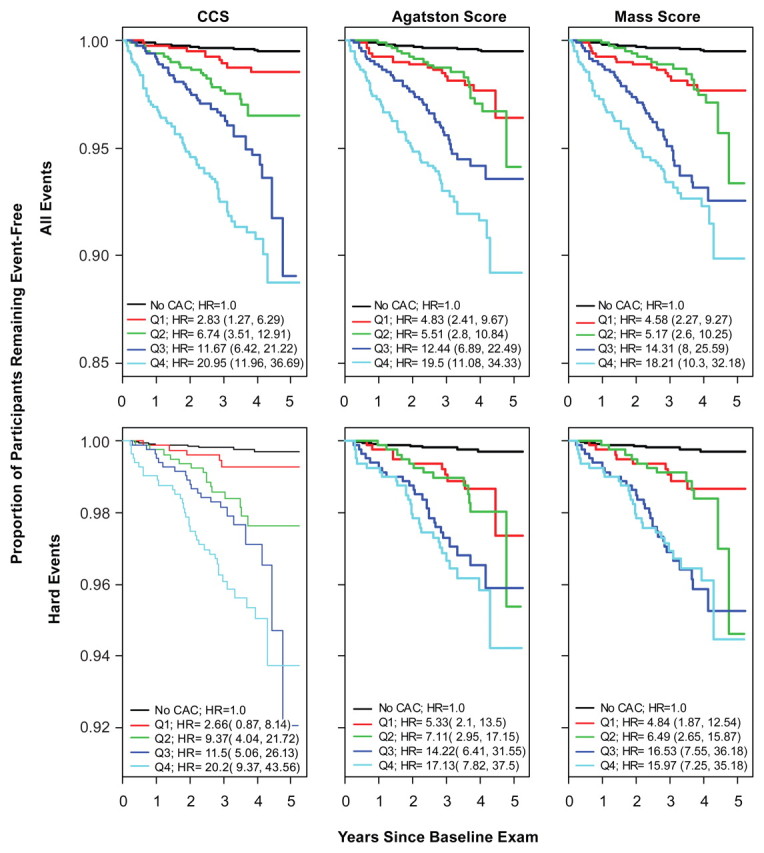
Kaplan-Meier estimates of time to all CHD events (top) and time to hard CHD events (bottom) based on quartiles (Q1–Q4) of CCS, Agatston score, and mass score (left, middle, and right columns, respectively). Hazard ratios (HR) and 95% CIs for comparison of the risk in each quartile with the risk when no calcific plaque is detected with CT are shown. CAC = coronary artery calcium.
Reproducibility
For subjects in whom CCS was calculated by using two scans (n = 2846), we estimated the intraclass correlation coefficient for the CCS to be 0.962. The intraclass correlation coefficients for the Agatston score and the mass score for the same group of participants were 0.987 and 0.989, respectively.
DISCUSSION
In this article, we report an approach to estimate the spatial distribution of coronary arterial calcific plaque with unenhanced CT. The tracing algorithm allowed us to determine the lengths of the coronary arteries, the distance from the ostia to the calcified regions along the arteries, and the distribution of calcified plaque as a function of the distance from the arterial ostia.
Our results for the distribution of calcific plaque along the coronary arteries are similar to the results of autopsy studies performed by Eggen et al (17) in a series of 349 autopsy specimens. They found a maximum coronary plaque deposition distance of approximately 20 mm, with a more pronounced peak in the LAD coronary artery compared with a more uniform distribution in the RCA.
In previous studies, researchers used electron-beam CT to describe the spread of calcific plaque in the coronary arteries; however, they relied on expert readers to identify anatomic segments of the arteries to classify the location of calcific plaque. Kajinami et al (18) and Baumgart et al (19) used electron-beam CT to identify anatomic coronary segments and determine the presence of calcified lesions within these segments in patients who were undergoing elective coronary angiography. Schmermund et al (20) performed similar analyses with subjects who had acute coronary syndromes. They subsequently extended these analyses to examine progression of calcific plaque per anatomic segment (21). Our results agree with those of Baumgart et al (19) and Schmermund et al (20,21), who also found that RCA calcification was more evenly distributed than calcification in the LM, LAD, and LCX coronary arteries.
The CCS is used to quantify the percentage of the coronary artery tree affected by calcific plaque. In our study, diabetes, dyslipidemia, and hypertension (adjusted for age, race, ethnicity, and sex) were shown to be highly associated with CCS. Diabetes showed the strongest association with CCS, with an estimated 44% (P < .001) more of the length of the coronary arteries of a patient with diabetes being affected by calcific plaque as compared with the length of coronary arteries affected in a patient without diabetes. After adjustments were made for age, sex, race, ethnicity, and Agatston or mass score, the CCS remained significantly associated with the presence of hypertension, dyslipidemia, and diabetes. In relation to cardiovascular events, neither the Agatston score nor the mass score was a significant predictor of events when CCS was included in the multivariate model. This indicates that the relationships between the spread of calcific plaque and these risk factors cannot be explained by the amount of calcific plaque in the arteries alone; rather, there are additional factors in how the calcific plaque is distributed.
The association between CCS and risk of a CHD event clarifies the potential clinical relevance of the CCS. The CCS was highly associated with CHD events, and a twofold increase in the CCS was associated with a 34% (P < .001) increase in the risk of a hard CHD event and a 52% (P < .001) increase in the risk of any CHD event. When the Agatston or mass score was included in a Cox model for CHD events with the CCS, the CCS remained a significant predictor of events, whereas neither the Agatston score nor the mass score was a significant predictor in the model. These models suggest that if the distribution of calcification in the coronary arteries is known, the overall amount of calcification does not improve the estimation of risk. Note that the hazard ratios for the Agatston and mass scores are designed to be comparable. They represent the change in risk associated with a twofold increase in the amount of calcific plaque present in the arteries; however, because the CCS is used to measure a different quantity, the hazard ratio for CCS cannot be directly compared with the hazard ratio for the Agatston or mass score. Instead, we can make direct comparisons through examination of the quartiles.
The Kaplan-Meier curves for the quartiles of the three scores suggest that the stratification of risk implied by the CCS may have corresponded better to the increasing risk levels than did the Agatston or mass scores. This was especially evident in the curves for the first and second quartiles of the scores. For Agatston and mass scores, the curves nearly overlap, whereas a distinct separation of the curves is evident for CCS. However, the third and fourth quartiles for all these scores represent relatively the same distinction in risk. The estimated hazard ratios support this differentiation of risk between the groups. For all CHD events, the hazard ratio for the first quartile of the CCS compared with that in patients who had no calcific plaque is about half that of the second quartile compared with that in patients who had no calcific plaque. This increase in hazard ratios from the first quartile to the second quartile is not present for the Agatston or mass scores. For both the Agatston score and the mass score, the hazard ratios for the first and second quartiles compared with those for the reference group are nearly equal. A similar trend is seen for hard CHD events. These findings reflect the potential difference in what the CCS and the Agatston and mass scores are used to measure. Because there is limited space, a large amount of calcium must be spread throughout the arteries; however, at lower overall levels of calcific plaque, the calcium may be concentrated in a small area or spread diffusely throughout. The CCS can potentially be used to detect and reflect these differences in the lower end when the Agatston and mass scores cannot be used.
CCS has several limitations. CCS depends on an accurate tracing of the arteries along their entire length; thus, the reading time may be longer than that for studies that do not require the reader to trace the arteries when calculating the Agatston score. Also, since arterial tracing adds an additional element of variability to the calcium scoring process, in our study, the CCS was slightly less reproducible compared with the Agatston score or the calcium score according to the relative levels of the intraclass correlation coefficients. Finally, although we demonstrated that overall cardiovascular events were better predicted with the CCS than with the Agatston or mass score, we observed no differences in the prediction of hard CHD events, as measured with the AUC; this may have been due to a true lack of association or to the smaller number of hard CHD events (n = 77). We were limited by the length of follow-up and the number of adjudicated events we had in the MESA for participants at the time of this analysis. In the future, we can further explore these findings during a longer follow-up period and with more adjudicated events.
In conclusion, our results show that the spatial distribution of calcified plaque is an important component of coronary atherosclerosis above and beyond the overall amount of calcium and the calcium density. In particular, the CCS enabled us to rank participants in terms of prediction of cardiovascular events better than did Agatston or mass scores. Calcium measurement techniques that directly incorporate the spatial distribution of calcium may help our understanding of the relationship between calcified plaque and cardiovascular events. The CCS provides evidence that incorporation of the higher order information concerning plaque location is important in predicting cardiovascular events. The collection of this information also opens paths to calculating further prognostic information in which measures of burden (such as the Agatston or mass scores) and measures of location are possibly combined. These initial findings deserve further validation in other populations, as well as in the MESA after a longer follow-up period. We expect that this score will prove to be useful in the clinical setting by helping physicians to classify patients according to risk more accurately than with use of the Agatston or mass scores and thereby devise improved individual treatment strategies.
ADVANCES IN KNOWLEDGE
-
•.
The calcium coverage score (CCS) was highly associated with coronary heart disease (CHD) events, and a twofold increase in CCS was associated with a 34% (P < .001) increase in the risk of a hard CHD event and a 52% (P < .001) increase in the risk of any CHD event.
-
•.
As indicated by Cox proportional hazards models, the CCS provides information about cardiovascular events beyond that provided by the calcium burden, as measured with the Agatston or calcium mass score.
-
•.
The CCS is associated with diabetes, hypertension, and dyslipidemia, even with adjustments for Agatston or mass scores, suggesting that there is information in this new score about calcific plaques in the coronary arteries that is not captured by the Agatston or mass score.
IMPLICATION FOR PATIENT CARE
-
•.
CCS may enable better stratification of patients according to risk compared with the Agatston or mass score and thereby aid physicians in determining appropriate individual treatment strategies.
Acknowledgments
We thank the other investigators, staff, and participants of the MESA for their valuable contributions.
Our results show that the spatial distribution of calcified plaque is an important component of coronary atherosclerosis above and beyond the overall amount of calcium and the calcium density.
Footnotes
Author contributions: Guarantors of integrity of entire study, E.R.B., R.D.; study concepts/study design or data acquisition or data analysis/interpretation, all authors; manuscript drafting or manuscript revision for important intellectual content, all authors; manuscript final version approval, all authors; literature research, E.R.B., J.J.C., J.G., R.D.; clinical studies, D.A.B., J.J.C., J.G.; experimental studies, E.R.B., J.J.C.; statistical analysis, E.R.B., R.A.K.; and manuscript editing, all authors
Authors stated no financial relationship to disclose.
References
- 1.Greenland P, LaBree L, Azen SP, Doherty TM, Detrano RC. Coronary artery calcium score combined with Framingham score for risk prediction in asymptomatic individuals. JAMA 2004;291(2):210–215. [DOI] [PubMed] [Google Scholar]
- 2.Arad Y, Goodman KJ, Roth M, Newstein D, Guerci AD. Coronary calcification, coronary disease risk factors, C-reactive protein, and atherosclerotic cardiovascular disease events: the St Francis Heart Study. J Am Coll Cardiol 2005;46(1):158–165. [DOI] [PubMed] [Google Scholar]
- 3.Taylor AJ, Bindeman J, Feuerstein I, Cao F, Brazaitis M, O'Malley PG. Coronary calcium independently predicts incident premature coronary heart disease over measured cardiovascular risk factors: mean 3-year outcomes in the Prospective Army Coronary Calcium (PACC) Project. J Am Coll Cardiol 2005;46(5):807–814. [DOI] [PubMed] [Google Scholar]
- 4.Vliegenthart R, Oudkerk M, Hofman A, et al. Coronary calcification improves cardiovascular risk prediction in the elderly. Circulation 2005;112(4):572–577. [DOI] [PubMed] [Google Scholar]
- 5.Agatston AS, Janowitz WR, Kaplan G, Gasso J, Hildner F, Viamonte M Jr. Ultrafast computed tomography–detected coronary calcium reflects the angiographic extent of coronary arterial atherosclerosis. Am J Cardiol 1994;74(12):1272–1274. [DOI] [PubMed] [Google Scholar]
- 6.Bild DE, Detrano R, Peterson D, et al. Ethnic differences in coronary calcification: the Multi-Ethnic Study of Atherosclerosis (MESA). Circulation 2005;111(10):1313–1320. [DOI] [PubMed] [Google Scholar]
- 7.Bild DE, Folsom AR, Lowe LP, et al. Prevalence and correlates of coronary calcification in black and white young adults: the Coronary Artery Risk Development in Young Adults (CARDIA) Study. Arterioscler Thromb Vasc Biol 2001;21(5):852–857. [DOI] [PubMed] [Google Scholar]
- 8.Newman AB, Naydeck BL, Sutton-Tyrrell K, Feldman A, Edmundowicz D, Kuller LH. Coronary artery calcification in older adults to age 99: prevalence and risk factors. Circulation 2001;104(22):2679–2684. [DOI] [PubMed] [Google Scholar]
- 9.Newman AB, Naydeck BL, Sutton-Tyrrell K, et al. Relationship between coronary artery calcification and other measures of subclinical cardiovascular disease in older adults. Arterioscler Thromb Vasc Biol 2002;22(10):1674–1679. [DOI] [PubMed] [Google Scholar]
- 10.Bild DE, Bluemke DA, Burke GL, et al. Multi-ethnic study of atherosclerosis: objectives and design. Am J Epidemiol 2002;156(9):871–881. [DOI] [PubMed] [Google Scholar]
- 11.Friedewald WT, Levy RI, Fredrickson DS. Estimation of concentration of low-density lipoprotein cholesterol in plasma, without use of preparative ultracentrifuge. Clin Chem 1972;18(6):499–502. [PubMed] [Google Scholar]
- 12.Chobanian AV, Bakris GL, Black HR, et al. The seventh report of the Joint National Committee on Prevention, Detection, Evaluation, and Treatment of High Blood Pressure: the JNC 7 report. JAMA 2003;289(19):2560–2572. [Published correction appears in JAMA 2003;290(2):197.] [DOI] [PubMed] [Google Scholar]
- 13.Detrano RC, Anderson M, Nelson J, et al. Coronary calcium measurements: effect of CT scanner type and calcium measure on rescan reproducibility—MESA study. Radiology 2005;236(2):477–484. [DOI] [PubMed] [Google Scholar]
- 14.Carr JJ, Nelson JC, Wong ND, et al. Calcified coronary artery plaque measurement with cardiac CT in population-based studies: standardized protocol of Multi-Ethnic Study of Atherosclerosis (MESA) and Coronary Artery Risk Development in Young Adults (CARDIA) Study. Radiology 2005;234(1):35–43. [DOI] [PubMed] [Google Scholar]
- 15.Nelson JC, Kronmal RA, Carr JJ, et al. Measuring coronary calcium on CT images adjusted for attenuation differences. Radiology 2005;235(2):403–414. [DOI] [PubMed] [Google Scholar]
- 16.McCullagh P, Nelder JA. Generalized linear models. Edition 2, Monographs on statistics and applied probability. London, England: Chapman & Hall, 1989.
- 17.Eggen DA, Strong JP, McGill HC Jr. Coronary calcification relationship to clinically significant coronary lesions and race sex and topographic distribution. Circulation 1965;32(6):948–955. [DOI] [PubMed] [Google Scholar]
- 18.Kajinami K, Seki H, Takekoshi N, Mabuchi H. Coronary calcification and coronary atherosclerosis: site by site comparative morphologic study of electron beam computed tomography and coronary angiography. J Am Coll Cardiol 1997;29(7):1549–1556. [DOI] [PubMed] [Google Scholar]
- 19.Baumgart D, Schmermund A, Goerge G, et al. Comparison of electron beam computed tomography with intracoronary ultrasound and coronary angiography for detection of coronary atherosclerosis. J Am Coll Cardiol 1997;30(1):57–64. [DOI] [PubMed] [Google Scholar]
- 20.Schmermund A, Baumgart D, Adamzik M, et al. Comparison of electron-beam computed tomography and intracoronary ultrasound in detecting calcified and noncalcified plaques in patients with acute coronary syndromes and no or minimal to moderate angiographic coronary artery disease. Am J Cardiol 1998;81(2):141–146. [DOI] [PubMed] [Google Scholar]
- 21.Schmermund A, Baumgart D, Möhlenkamp S, et al. Natural history and topographic pattern of progression of coronary calcification in symptomatic patients: an electron-beam CT study. Arterioscler Thromb Vasc Biol 2001;21(3):421–426. [DOI] [PubMed] [Google Scholar]
Associated Data
This section collects any data citations, data availability statements, or supplementary materials included in this article.