Abstract
Purpose: To retrospectively evaluate high-spatial-resolution signal enhancement ratio (SER) imaging for the prediction of disease recurrence in patients with breast cancer who underwent preoperative magnetic resonance (MR) imaging.
Materials and Methods: This retrospective study was approved by the institutional review board and was HIPAA compliant; informed consent was waived. From 1995 to 2002, gadolinium-enhanced MR imaging data were acquired with a three time point high-resolution method in women undergoing neoadjuvant therapy for invasive breast cancers. Forty-eight women (mean age, 49.1 years; range, 29.7–72.4 years) were divided into recurrence-free or recurrence groups. Volume measurements were tabulated for SER values between set ranges; cutoff criteria were defined to predict disease recurrence after surgery. Wilcoxon rank sum tests and the multivariate Cox proportional hazards regression model were used for evaluation.
Results: Breast tumor volume calculated from the number of voxels with SER values above a threshold corresponding to the upper limit of mean redistribution rate constant in benign tumors (0.88 minutes−1) and the volume of cancerous breast tissue infiltrating into the parenchyma were important predictors of disease recurrence. Seventy-five percent of patients with recurrence and 100% of deceased patients were identified as being at high risk for recurrence. Thirty percent of patients with recurrence and 67% of deceased patients were identified as having high risk before chemotherapy. No patients in the recurrence-free group were misidentified as likely to have recurrence. All three prechemotherapy parameters (total tumor volume, tumor volumes with high and low SER) and the postchemotherapy tumor volume with high SER were significantly different between the two groups. The multivariate Cox proportional hazards regression showed that, of the three prechemotherapy covariates, only the low SER and high SER tumor volumes (P = .017 and .049, respectively) were significant and independent predictors of tumor recurrence. Tumor volume with high SER was the only significant postchemotherapy covariate predictor (P = .038).
Conclusion: High-spatial-resolution SER imaging may improve prediction for patients at high risk for disease recurrence and death.
Supplemental material: http://radiology.rsnajnls.org/cgi/content/full/248/1/79/DC1
© RSNA, 2008
Keywords: Iilc = prognostic index in patients with invasive lobular carcinoma, Inst = prognostic index in patients with carcinomas of no special type, kep = redistribution rate constant, R10 = native longitudinal relaxation rate, SER = signal enhancement ratio, ve = fractional volume of extravascular extracellular space
Dynamic contrast material–enhanced magnetic resonance (MR) imaging has been used to differentiate between benign and malignant breast tumors (1–10). Prior studies have also involved a comparison between dynamic contrast-enhanced MR imaging findings and prognostic indicators in breast cancer (11–17). However, to our knowledge, there have been few published reports to support the prognostic value of contrast-enhanced breast MR imaging for the stratification of patients into good versus poor prognostic categories (15,18).
High-spatial-resolution signal enhancement ratio (SER) imaging has the advantage of being able to depict the heterogeneous microvascular network in breast cancers (19,20). SER is defined as (S1 − S0)/(S2 − S0), where S0, S1, and S2 represent the signal intensity of each voxel on the precontrast, first postcontrast, and second postcontrast images, respectively (19,21). We have found a close relationship between SER and a commonly analyzed pharmacokinetic parameter, the redistribution rate constant (kep), on the basis of a two-compartment pharmacokinetic model (22). We have also shown that a monotonic mathematical relationship between SER and kep could be established if the acquisition parameters and the two postinjection time points of SER were appropriately chosen (23). On the basis of these results, two hypotheses with respect to deriving parameters for predicting disease recurrence by using SER imaging can be formed:
1. The first hypothesis is that the volume (in voxels) of malignant breast tissue, which is characterized by a SER value above the threshold corresponding to the upper limit value of mean kep in benign breast tumors (approximately equal to 0.88 minutes−1 [24]), is an important predictor of disease recurrence.
Knopp et al (24) reported that the kep (denoted as k21 in their article) value was significantly lower (P < .001) in benign breast lesions (mean kep, 0.56 minutes−1 ± 0.32) than in malignant lesions (mean kep, 1.51 minutes−1 ± 1.04).
2. The second hypothesis is that the volume (in voxels) of malignant tissue infiltrating into the breast parenchyma, which can be observed on a high-spatial-resolution SER map, is also an important predictor of disease recurrence.
It has been reported that some malignant lesions do not enhance rapidly. These lesions tend to have less well-defined borders and can be more diffuse and infiltrate into surrounding breast tissue (25,26). Results from a previous study (27) in a mouse model of human breast cancer showed that the majority of the newly developed tumor voxels in animals without therapy had low values for the transfer constant (< 0.06 minutes−1), with the use of gadopentetate dimeglumine. The value of the fractional volume of extravascular extracellular space (ve) for breast tumors ranged from 0.3 to 1.0 (9,28,29). Thus, kep ( transfer constant/ve) of newly developed cancerous voxels infiltrating into the breast parenchyma would be expected to be less than 0.2 minutes−1.
The specific aim of our study was to retrospectively evaluate high-spatial-resolution SER imaging for the prediction of disease recurrence in patients with breast cancer who underwent preoperative MR imaging.
MATERIALS AND METHODS
Participants
Our study was institutional review board approved and Health Insurance Portability and Accountability Act compliant. Our study was a retrospective analysis of a subset of patients who participated in a prospective institutional review board–approved Health Insurance Portability and Accountability Act–compliant study where all participants had provided informed consent. Informed consent for participation in our retrospective study was waived by our institutional review board. We included 48 consecutive women with primary invasive breast cancers verified at histopathologic examination and who preoperatively underwent four cycles of therapy (doxorubicin and cyclophosphamide) between April 1995 and March 2002. Patient ages ranged from 29.7 to 72.4 years (mean age, 49.1 years) at treatment. Contrast-enhanced MR imaging was performed before and after neoadjuvant chemotherapy.
On the basis of the most recent follow-up information as of August 2007, 20 of the 48 patients had recurrent disease, with a median recurrence time of 22 months (maximum, 68 months). Nine of the 20 patients were deceased by the final follow-up, with a median survival time of 32 months (range, 7–75 months). All of the 28 patients without recurrence had a minimum of 5 years of follow-up (median, 90.6 months; range, 64.7–128.5 months). They were assigned to group 1. The 20 patients with recurrence were assigned to group 2.
MR Imaging Acquisition
MR imaging was performed with a 1.5-T imager (Signa; GE Medical Systems, Milwaukee, Wis). Three phased-array breast coils, a closed breast coil (GE Medical Systems), and two open breast coils (MRI Devices, Waukesha, Wis) were used during the periods 1995, 1996–2000, and 2000–2002, respectively. Contrast-enhanced MR imaging of the breast was performed with the acquisition of data at three time points: one precontrast acquisition followed by two postcontrast acquisitions obtained in two consecutive 5-minute intervals. A three-dimensional fast gradient-recalled-echo imaging sequence was performed to produce high-spatial-resolution, fat-suppressed images with full coverage of the symptomatic breast. Imaging parameters included the following: repetition time msec/echo time msec, 8/4.2; flip angle, 20°; number of signals acquired, two; acquisition matrix, 256 × 192 × 60; and section thickness, 2 mm. The field of view was 18–20 cm, depending on patient size, and resulted in an in-plane resolution of approximately 0.70 × 0.94 mm. The contrast agent, gadopentetate dimeglumine (Magnevist; Schering, Berlin, Germany), was administered intravenously at a dose of 0.1 mmol per kilogram of body weight. For the majority of the patients who were imaged in 1996 or later, injections were performed with an MR-compatible remote-controlled power injector (Spectris; Medrad, Indianola, Pa) at a rate of 1.2 mL/sec. For patients imaged earlier, injections were performed by using hand injection at a rate of approximately 1.0–1.2 mL/sec. Contrast material injection was followed by a 10-mL saline flush administered at the same flow rate. The central phase-encoding lines of each data set were acquired halfway through the acquisition, yielding effective postcontrast sample times of 2.5 and 7.5 minutes.
Simulation of SER versus kep Curves
The relationship between SER and kep was simulated on the basis of MR imaging parameters and time points used in the acquisition of SER data in our study (Appendix E1, http://radiology.rsnajnls.org/cgi/content/full/248/1/79/DC1). Theoretical SER versus kep curve was generated by using an array of “true” kep values ranging from 0.1 to 2.0 minutes−1 with an increment of 0.1 minutes−1 and two values of ve (0.3 or 0.6). For each given kep and ve value, eight SERs were generated with an array of native longitudinal relaxation rates (R10) that ranged from 0.77 to 1.67 sec−1 (30). Means and standard deviations of the eight SERs were obtained. The mean was used in plotting the SER versus kep curve, and the standard deviation was used to depict the variability of SER resulting from variation in the R10 values of the tissue. A previously reported vascular input function (23) was used in the simulations. The SER values corresponding to kep of 0.2 and 0.88 minutes−1 were estimated on the basis of the simulated SER versus kep curves.
SER Image Data and Statistical Analysis
SER maps were generated (J.E.G.) and analyzed (K.L.L.) by using in-house software written in Interactive Data Language (Research Systems, Boulder, Colo). SER was calculated only for voxels with substantial initial enhancement (ie, [S1 − S0]/S0 > 70%) (21). SER histograms and maps were produced for each tumor before and after neoadjuvant chemotherapy. Color-coded SER maps overlaid on corresponding gray-scale contrast-enhanced images were used for lesion morphologic assessment.
Group histograms of SER, calculated by pooling together all tumors in each of the two groups and then normalizing by the number of patients in the group, were plotted on the same graph for comparison. The SER histograms were segmented into three ranges according to the SER values corresponding to kep of 0.2 and 0.88 minutes−1. The number of voxels in the low SER range and in the high SER range was calculated for each tumor before and after chemotherapy. In addition, the initial and final total tumor volumes, defined as the number of voxels with nonzero SER values, were calculated for each tumor.
To assess how groups differed with regard to each of these SER-segmented volume variables, box-and-whisker diagrams were drawn for each of the two groups, and Wilcoxon rank sum tests were performed. If for any of these variables the maximum value in the recurrence-free group was much lower than the maximum value in the recurrence group, a value just above the maximum in the recurrence-free group was chosen as a criterion to identify patients at high risk for disease recurrence. Moreover, in a multivariate Cox proportional hazards regression model, the association of these SER-segmented volume variables (in cubic centimeters) with recurrence was assessed. The disease-free survival time, which was the time between surgery and latest follow-up date (for the recurrence-free group as censored observations) or recurrence date (for the recurrence group), was the dependent variable in the Cox analysis.
Consideration of SER Predictor with Other Prognostic Factors in Breast Cancer
Histopathologic data were obtained from routine diagnostic studies as part of the original prospective study. To consider SER predictors along with traditional prognostic factors, such as cancer type, pathologic tumor size (the amount of residual disease measured at pathologic examination after surgery), and lymph node status, we divided the 48 patients with invasive breast carcinoma into two groups: the invasive lobular carcinoma group—which was the only special-type carcinoma encountered in the study population—and carcinomas of no special type group—which included patients with invasive ductal carcinoma, not otherwise specified carcinoma, and inflammatory breast cancer. For patients with invasive lobular carcinoma, a prognostic index (Iilc) was proposed as the combination of lymph node positivity (number of positive lymph nodes at surgery), pathologic tumor size, and patient age. The value of the prognostic index was assigned as 1 if the number of positive lymph nodes at surgery was 6.0 or higher, pathologic tumor size was 6.0 cm or larger, and age was younger than 70 years for unfavorable prognosis; otherwise the prognostic index was assigned as 0. Because patients in the 70–80-year age group have been reported to have the highest 5-year cancer-specific survival (31), we associated patients with invasive lobular carcinoma between 70 and 80 years old with a favorable prognosis. For each of the two subsets of patients (invasive lobular carcinoma or carcinomas of no special type), Kaplan-Meier analysis was used to compare disease survival between the two prognostic index levels (0 or 1), which would assess the prognostic value of the Iilc in the two subsets of patients. For patients with carcinomas of no special type, we investigated the possibility of lowering the criteria in the segmented low SER tumor volume to identify more patients with carcinomas of no special type at high risk for disease recurrence by using combined consideration of SER predictor with lymph node status.
Statistical analyses (K.L.L. and Y.L. by consensus) were performed by using software (S-Plus, version 6.1; Insightful, Seattle, Wash). A P value less than .05 was considered to indicate a statistically significant difference.
RESULTS
SER Image Data Analysis
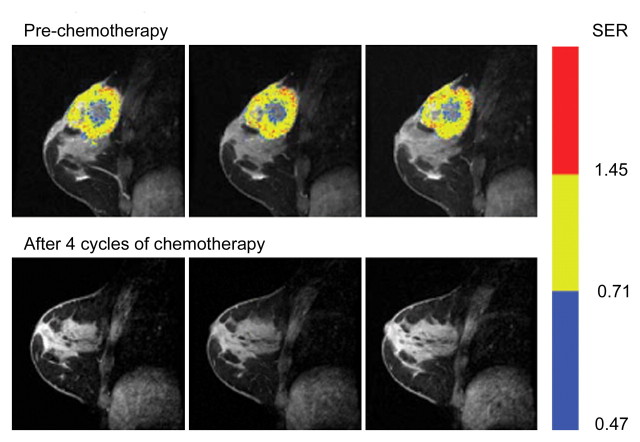
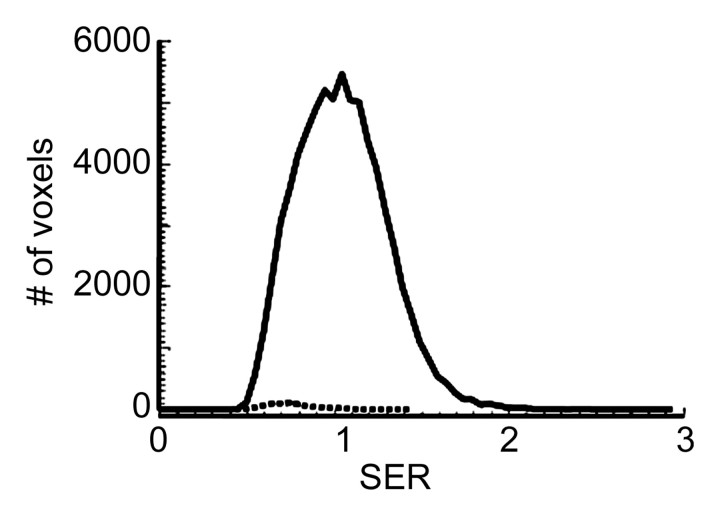
Representative SER maps from a patient in the recurrence-free group (Fig 1a) and the corresponding histogram (Fig 1b) showed that chemotherapy substantially reduced the tumor volume, especially the number of voxels with high SER values.
Figure 1a:
MR imaging study results before and after four cycles of chemotherapy in a 39-year-old woman in the recurrence-free group. (a) Representative color-coded SER maps overlaid on corresponding gray-scale images of first postcontrast acquisition (three-dimensional fast gradient-recalled echo, 8/4.2, 20° flip angle) before (top row) and after (bottom row) chemotherapy. (b) SER histogram produced from whole tumor. Solid line = before chemotherapy, dashed line = after chemotherapy.
Figure 1b:
MR imaging study results before and after four cycles of chemotherapy in a 39-year-old woman in the recurrence-free group. (a) Representative color-coded SER maps overlaid on corresponding gray-scale images of first postcontrast acquisition (three-dimensional fast gradient-recalled echo, 8/4.2, 20° flip angle) before (top row) and after (bottom row) chemotherapy. (b) SER histogram produced from whole tumor. Solid line = before chemotherapy, dashed line = after chemotherapy.
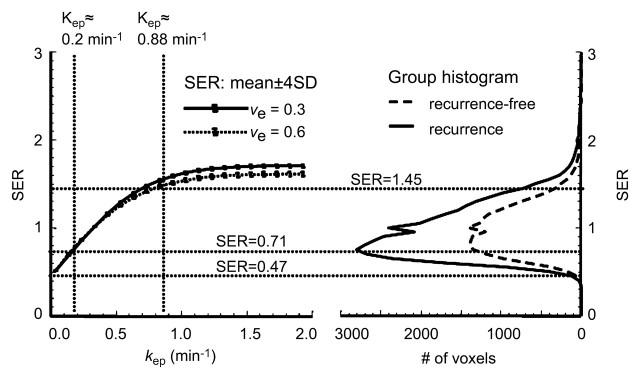
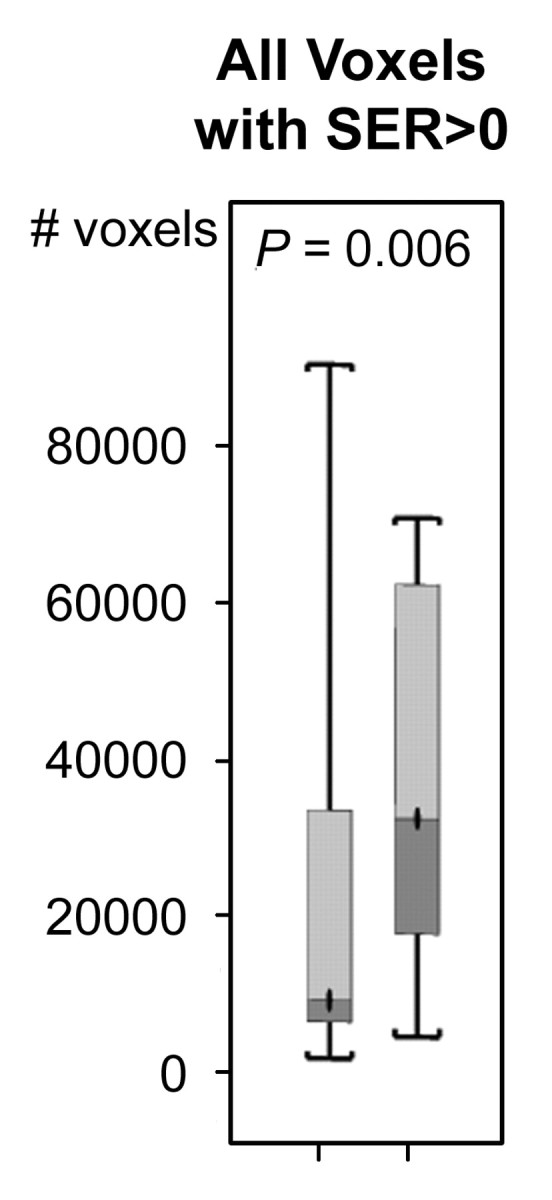
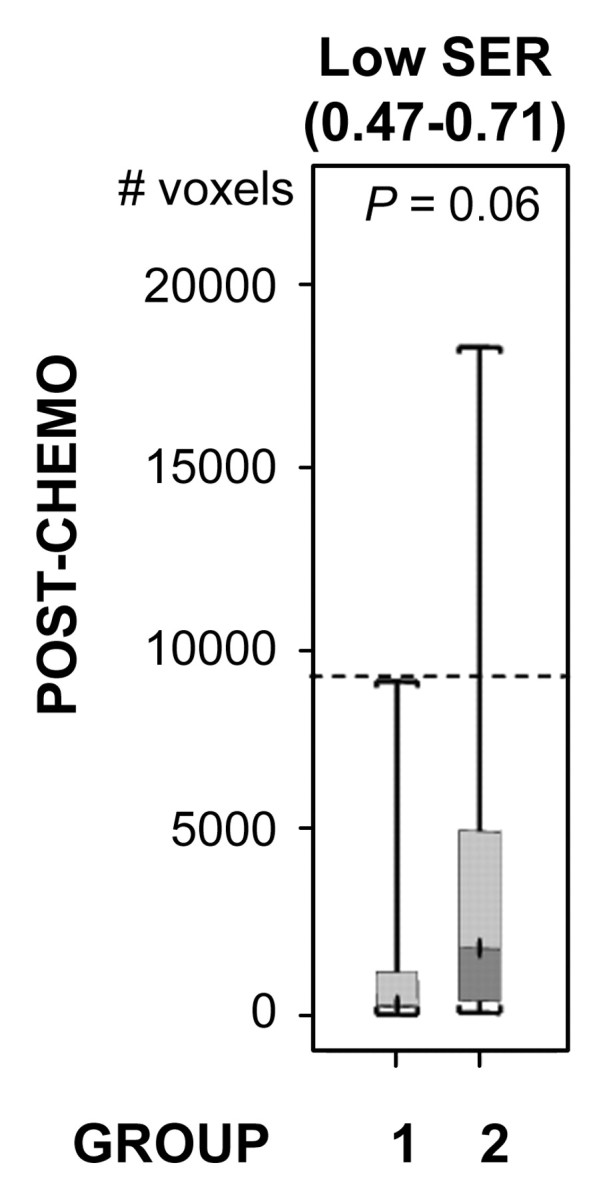
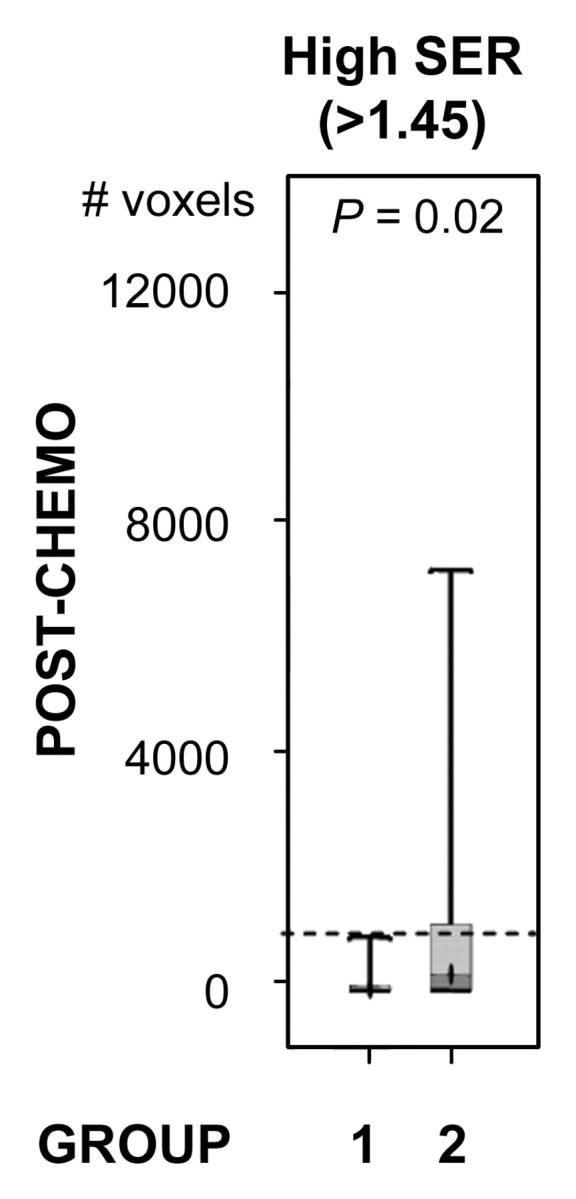
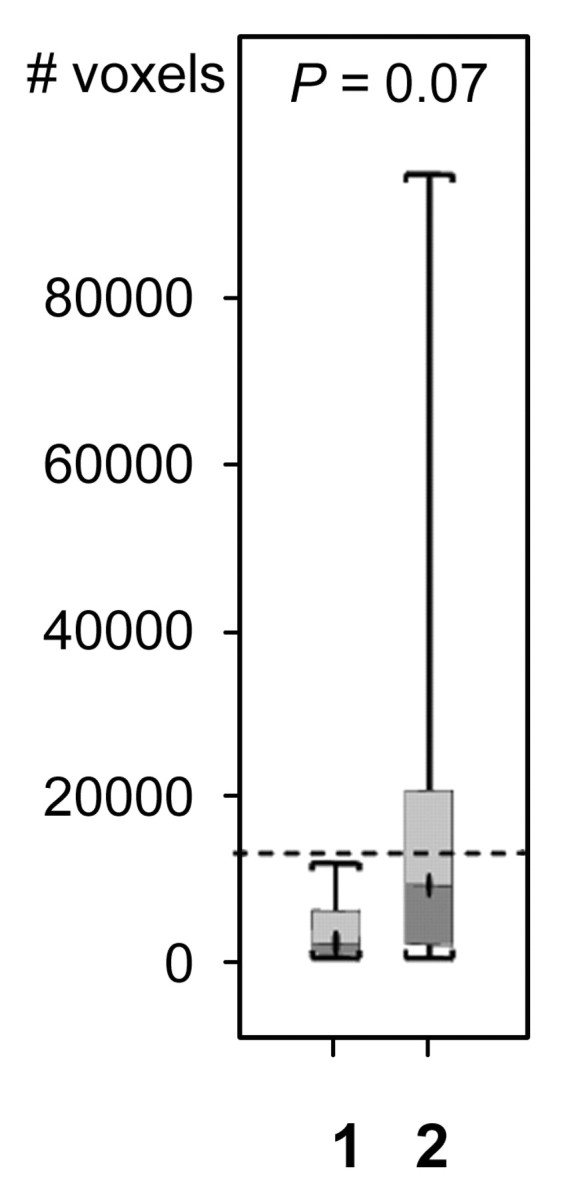
For both ve values, the values of SER are closely correlated with kep across the kep range of 0–1 minute−1 but exhibit a plateau when kep is higher than 1 minute−1 (Fig 2). Moreover, at kep approximately equal to 0.5 minutes−1, SER versus kep curves with different ve values start to diverge: The one with a lower ve value shows larger dynamic range than the one with a higher ve value. The standard deviations in the simulated SER versus kep curves were small (<0.01), which indicates that variation in the R10 values of the tissue has little effect on the SER values and the relationship between SER and kep. The SER values corresponding to kep approximately equal to 0.2 minutes−1 and kep approximately equal to 0.88 minutes−1 are approximately 0.71 and 1.45, respectively, as depicted from the SER versus kep curves (Fig 2). The group histogram of SER (Fig 2) was therefore segmented into three ranges: 0.47–0.71 (low SER), more than 0.71 to 1.45, and more than 1.45 (high SER). As shown in Figure 3, three prechemotherapy parameters (total tumor volume and tumor volumes with high and low SER) and the postchemotherapy tumor volume with high SER were significantly different between patients with and those without recurrence. However, there was a large overlap in the values of the initial tumor size between the two groups. For each of the other five parameters, a high-value range could be found that included only tumors in the recurrence group. Accordingly, cutoff criteria were chosen for each of the five parameters (depicted as dashed lines in Figure 3): 10 000 voxels (∼11.0 cm3) for low SER both before and after chemotherapy, 6000 voxels (∼6.6 cm3) for high SER before chemotherapy, 1000 voxels (∼1.1 cm3) for high SER after chemotherapy, and 12 000 voxels (∼13.2 cm3) for total volume after chemotherapy.
Figure 2:
Segmentation of SER histograms based on computer-simulated SER versus kep curves. Left: SER versus kep curves simulated by using acquisition conditions applied to current data and method described in Appendix E1 (http://radiology.rsnajnls.org/cgi/content/full/248/1/79/DC1 ). Solid curve was simulated with ve at 0.3; dotted curve was simulated with ve at 0.6. Right: Prechemotherapy group histogram of SER segmented into three regions: SER of 0.47–0.71, more than 0.71 to 1.45, and more than 1.45; corresponding kep values are shown on simulated kep versus SER curve (left). SD = standard deviation.
Figure 3a:
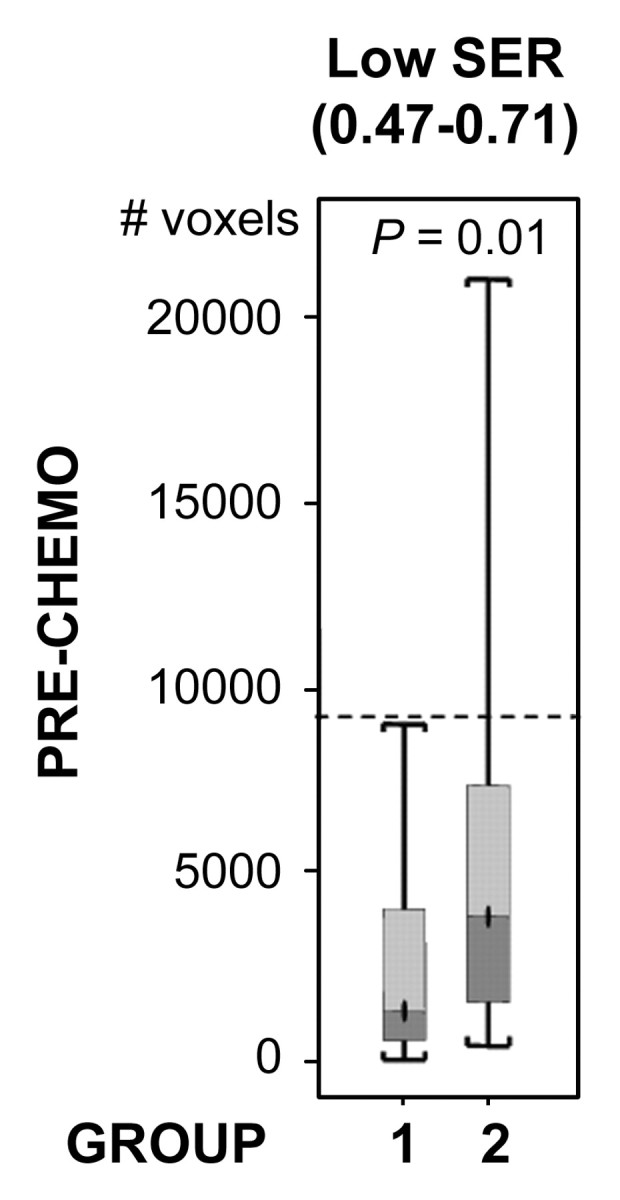
Comparison of the number of voxels with high (hypothesis 1) and low (hypothesis 2) SER between recurrence-free group (group 1) and recurrence group (group 2). Box-and-whisker plots (a–c) before chemotherapy and (d–f) after chemotherapy. (a, d) SER is between 0.47 and 0.71. (b, e) SER is greater than 1.45. (c, f) All voxels with nonzero SER. Interquartile range (ie, 25%–75%) is shown by box, extreme values are shown by whiskers, and median is shown by bar within the box. P value of the difference between the two groups was evaluated with Wilcoxon rank sum test. Dashed lines = cutoff criteria.
Figure 3b:
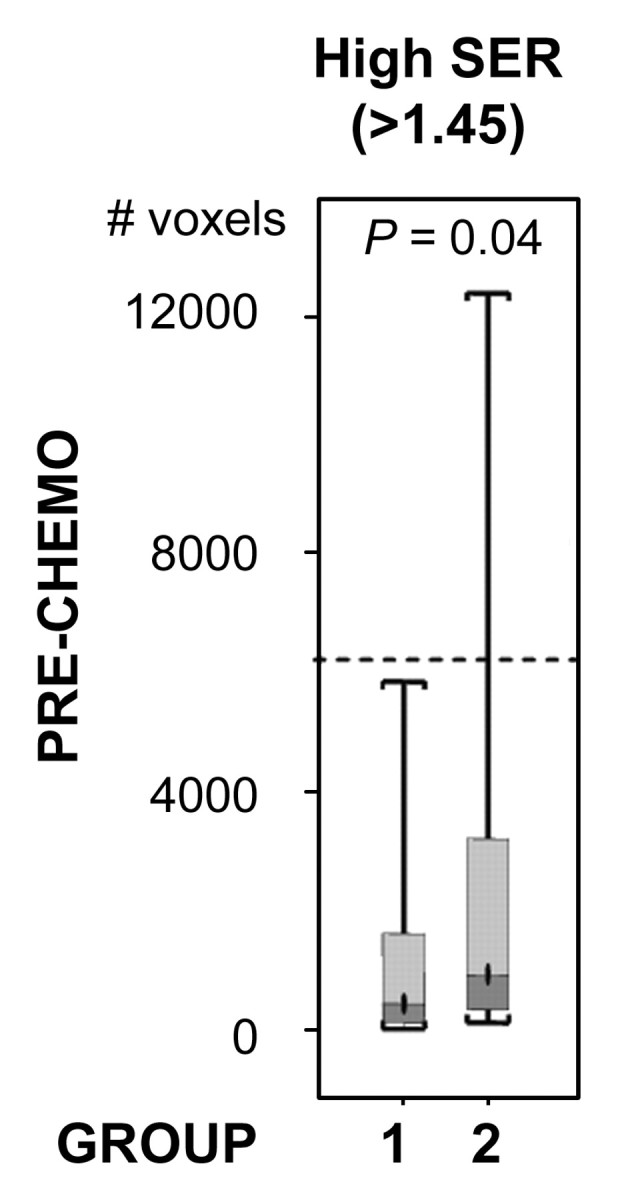
Comparison of the number of voxels with high (hypothesis 1) and low (hypothesis 2) SER between recurrence-free group (group 1) and recurrence group (group 2). Box-and-whisker plots (a–c) before chemotherapy and (d–f) after chemotherapy. (a, d) SER is between 0.47 and 0.71. (b, e) SER is greater than 1.45. (c, f) All voxels with nonzero SER. Interquartile range (ie, 25%–75%) is shown by box, extreme values are shown by whiskers, and median is shown by bar within the box. P value of the difference between the two groups was evaluated with Wilcoxon rank sum test. Dashed lines = cutoff criteria.
Figure 3c:
Comparison of the number of voxels with high (hypothesis 1) and low (hypothesis 2) SER between recurrence-free group (group 1) and recurrence group (group 2). Box-and-whisker plots (a–c) before chemotherapy and (d–f) after chemotherapy. (a, d) SER is between 0.47 and 0.71. (b, e) SER is greater than 1.45. (c, f) All voxels with nonzero SER. Interquartile range (ie, 25%–75%) is shown by box, extreme values are shown by whiskers, and median is shown by bar within the box. P value of the difference between the two groups was evaluated with Wilcoxon rank sum test. Dashed lines = cutoff criteria.
Figure 3d:
Comparison of the number of voxels with high (hypothesis 1) and low (hypothesis 2) SER between recurrence-free group (group 1) and recurrence group (group 2). Box-and-whisker plots (a–c) before chemotherapy and (d–f) after chemotherapy. (a, d) SER is between 0.47 and 0.71. (b, e) SER is greater than 1.45. (c, f) All voxels with nonzero SER. Interquartile range (ie, 25%–75%) is shown by box, extreme values are shown by whiskers, and median is shown by bar within the box. P value of the difference between the two groups was evaluated with Wilcoxon rank sum test. Dashed lines = cutoff criteria.
Figure 3e:
Comparison of the number of voxels with high (hypothesis 1) and low (hypothesis 2) SER between recurrence-free group (group 1) and recurrence group (group 2). Box-and-whisker plots (a–c) before chemotherapy and (d–f) after chemotherapy. (a, d) SER is between 0.47 and 0.71. (b, e) SER is greater than 1.45. (c, f) All voxels with nonzero SER. Interquartile range (ie, 25%–75%) is shown by box, extreme values are shown by whiskers, and median is shown by bar within the box. P value of the difference between the two groups was evaluated with Wilcoxon rank sum test. Dashed lines = cutoff criteria.
Figure 3f:
Comparison of the number of voxels with high (hypothesis 1) and low (hypothesis 2) SER between recurrence-free group (group 1) and recurrence group (group 2). Box-and-whisker plots (a–c) before chemotherapy and (d–f) after chemotherapy. (a, d) SER is between 0.47 and 0.71. (b, e) SER is greater than 1.45. (c, f) All voxels with nonzero SER. Interquartile range (ie, 25%–75%) is shown by box, extreme values are shown by whiskers, and median is shown by bar within the box. P value of the difference between the two groups was evaluated with Wilcoxon rank sum test. Dashed lines = cutoff criteria.
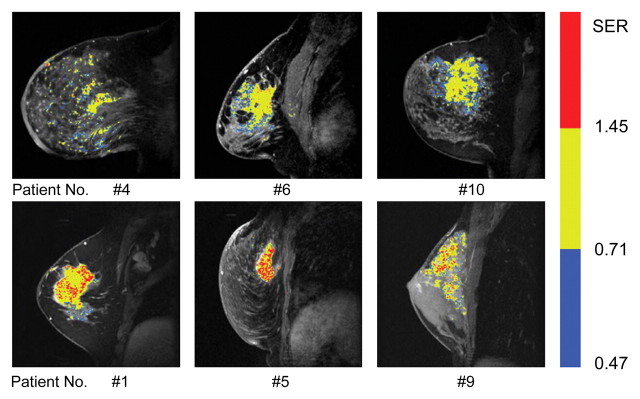
Table 1 summarizes the results of applying these cutoff criteria of segmented tumor volume to the study population for the prediction of disease recurrence. Some patients were predicted to have recurrence by more than one criterion. Accounting for this overlap, a total of 50% (10 of 20) of patients with recurrence were identified, and no patients in the recurrence-free group were misidentified as likely to have recurrence on the basis of these criteria. SER maps for the six tumors in the recurrence group (Fig 4), which were identified by using prechemotherapy high and low SER predictors, showed that the two SER parameters provided complementary information for individual prediction. The six patients with recurrence identified with prechemotherapy SER predictors were all deceased at final follow-up and accounted for three-quarters of the total number of deceased patients.
Table 1.
Prediction of Disease Recurrence on the Basis of Size of Segmented Tumor Volume
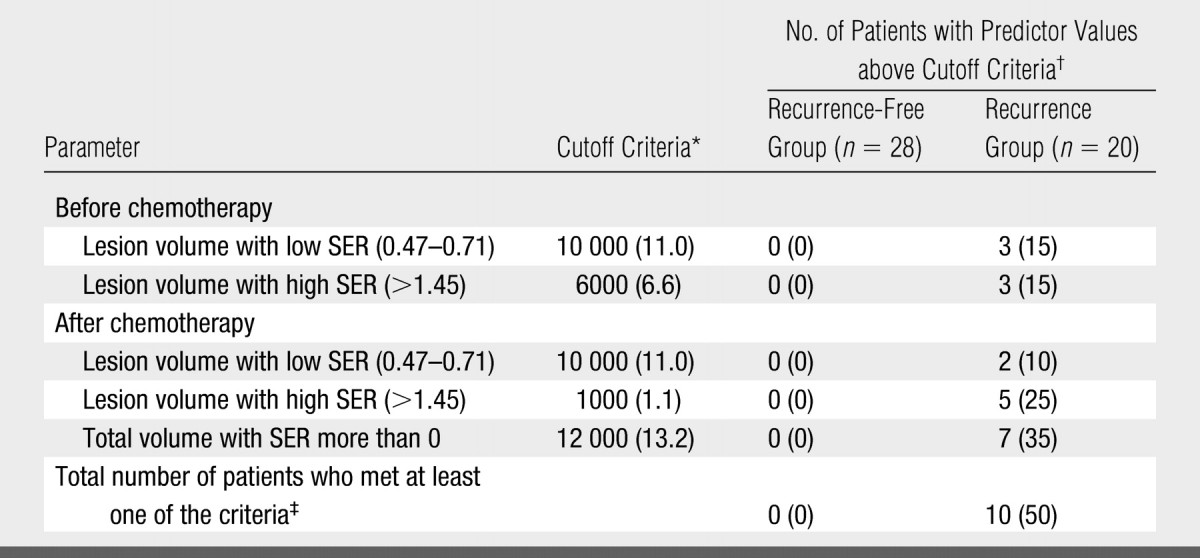
Data are number of voxels, with equivalent volume in cubic centimeters in parentheses.
Data in parentheses are percentages.
Note that some patients were predicted to have recurrence by more than one criterion (see Table 3). The total number is therefore not the sum of the number predicted by individual criteria.
Figure 4:
SER maps of tumors in recurrence group identified from SER images acquired before neoadjuvant chemotherapy (three-dimensional fast gradient-recalled echo, 8/4.2, 20° flip angle). SER maps were color-coded in red (SER values > 1.45, high SER), yellow (SER values more than 0.71 to 1.45), and blue (SER values 0.47–0.71, low SER). Top row: Tumors with a number of blue voxels above a cutoff level of 10 000 voxels (ie, 11.0 cm3). (Note that low SER voxels follow an infiltrative pattern through the parenchyma rather than forming a discrete mass.) Bottom row: Tumors with a number of red voxels (rapidly enhancing tissue) above a cutoff level of 6000 voxels (ie, 6.6 cm3).
The multivariate Cox proportional hazards regression analysis (Table 2) showed that, of the three prechemotherapy covariates, only the low SER and high SER tumor volumes (P = .017 and .049, respectively) were significant and independent predictors of tumor recurrence. In contrast, of the three postchemotherapy covariates, tumor volume with high SER (P = .038) was the only significant predictor.
Table 2.
Results of Multivariate Cox Proportional Hazards Regression Analysis of Pre- and Postchemotherapy SER Indicators Associated with Recurrence in 48 Patients
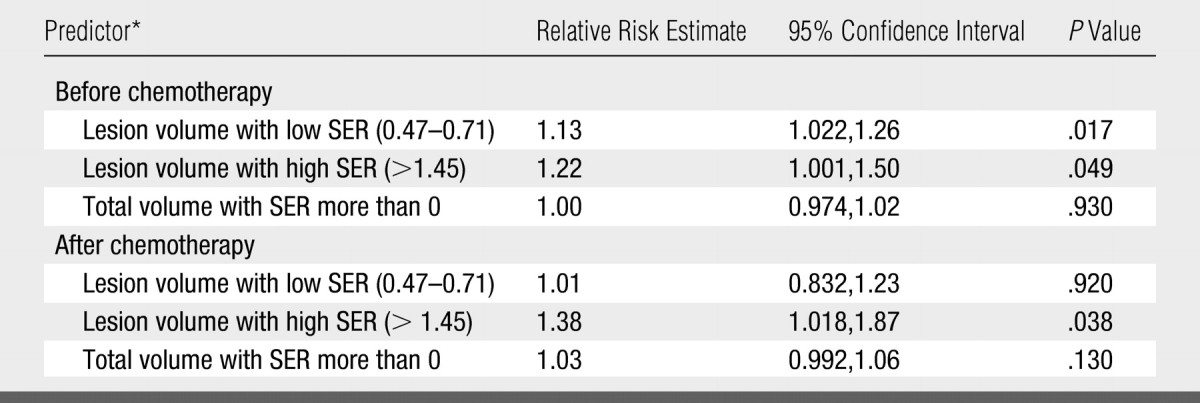
All predictors were in cubic centimeters.
Consideration of SER Predictor with Other Prognostic Factors in Breast Cancer
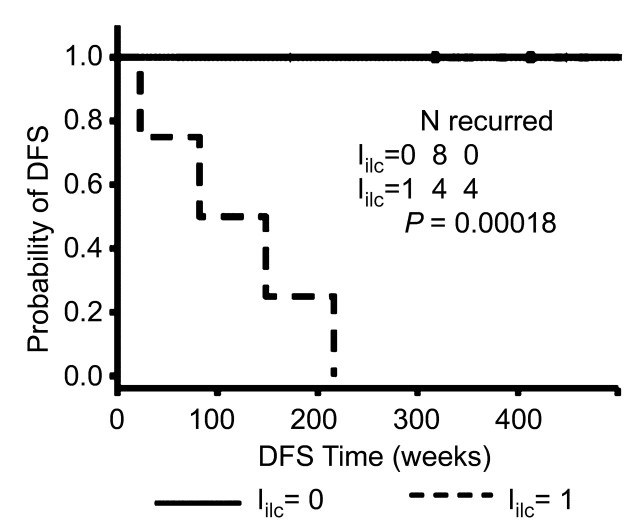
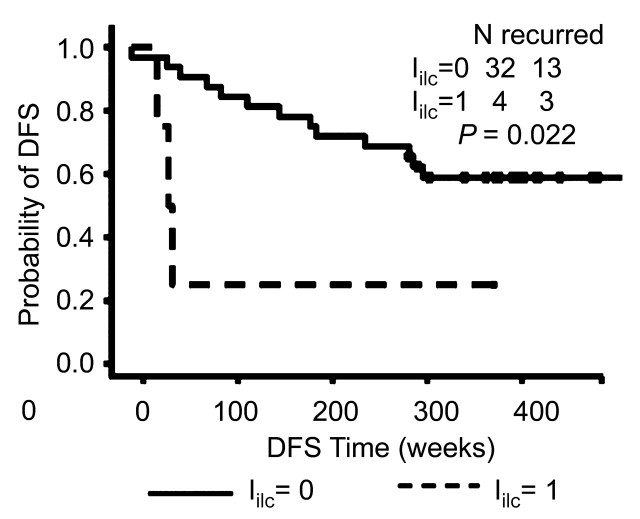
The Kaplan-Meier survival analysis showed that a higher sensitivity was achieved when applying the Iilc in patients with invasive lobular carcinoma (Fig 5a) compared with that when applying the prognostic index in patients with carcinomas of no special type (Inst) (Fig 5b). For both invasive lobular carcinoma and carcinomas of no special type, patients with a prognostic index value of 0 demonstrated significantly better survival than those with a prognostic index value of 1. However, the significance with respect to survival between the two prognostic index levels was much stronger in patients with invasive lobular carcinoma than that in patients with carcinomas of no special type.
Figure 5a:
Graphs show comparison of value of prognostic index on recurrence in (a) patients with invasive lobular carcinoma (including two patients with both invasive ductal carcinoma and invasive lobular carcinoma) and (b) patients with carcinomas of no special type by using Kaplan-Meier survival analysis. DFS = disease-free survival.
Figure 5b:
Graphs show comparison of value of prognostic index on recurrence in (a) patients with invasive lobular carcinoma (including two patients with both invasive ductal carcinoma and invasive lobular carcinoma) and (b) patients with carcinomas of no special type by using Kaplan-Meier survival analysis. DFS = disease-free survival.
For patients with carcinomas of no special type with prechemotherapy low SER tumor volume lower than the criterion of 10 000 voxels but above 6500 voxels, an Inst was proposed by combining the criteria of prechemotherapy low-SER tumor volume of 6500–10 000 voxels with the lymph node status of the number of positive lymph nodes being more than 0. Three more patients with recurrence were identified, with no patients in the recurrence-free group misidentified as likely to have recurrence.
Overall, as shown in Table 3, 75% (15 of 20) of patients with recurrence and 100% (nine of nine) of deceased patients were identified as being at high risk for disease recurrence. Moreover, 30% (six of 20) of patients with recurrence and 67% (six of nine) of deceased subjects were identified from the data obtained prior to chemotherapy. None of patients in the recurrence-free group were misidentified as likely to have recurrence.
Table 3.
Characteristics of Patients in Recurrence Group
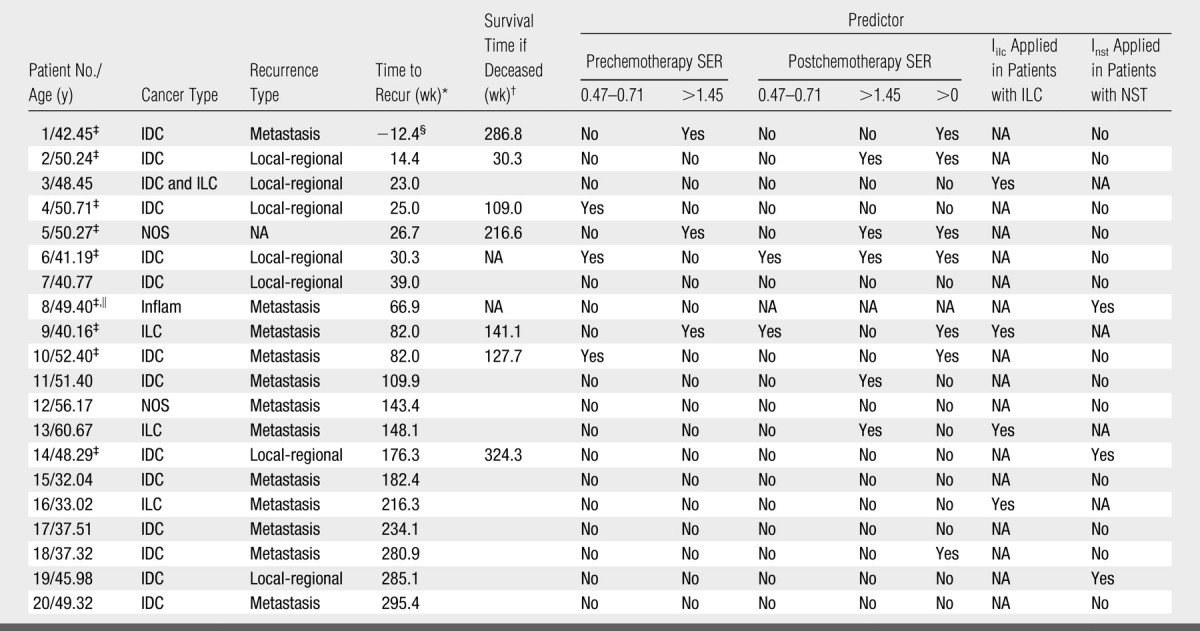
Note.—The patients identified with the SER predictors and/or the two combined indexes are indicated by “Yes.” IDC = invasive ductal carcinoma, ILC = invasive lobular carcinoma, Inflam = inflammatory breast cancer, NA = not available/applicable, NOS = carcinoma not otherwise specified, NST = carcinomas of no special type.
Time in weeks between surgery and recurrence date.
Survival time in weeks between surgery and death date.
Patient is deceased.
In this patient, the primary cancer shrank by 80% after four cycles of neoadjuvant chemotherapy and was removed at mastectomy. However, distant metastases were diagnosed 12.4 weeks before the surgery.
This patient missed the postchemotherapy MR imaging examination.
DISCUSSION
In our study, we measured tumor volume segmented by using set ranges of SER values from high-spatial-resolution dynamic contrast-enhanced MR imaging data. The major findings are as follows: (a) The size of the segmented tumor volume with high SER corresponding to a kep of more than 0.88 minutes−1 could predict tumor recurrence; (b) The size of tumor volume (in voxels) of cancerous tissues infiltrating into the breast parenchyma could also be used to predict tumor recurrence. Such infiltrating voxels demonstrated low SER corresponding to a kep of less than 0.20 minutes−1; and (c) Combined use of these SER predictors with the traditional prognostic factors could further improve the prediction of prognosis for patients at high risk for disease recurrence and death.
The SER predictors based on the two presented hypotheses enabled the identification of a subgroup of patients at high risk for recurrence, without the miscategorization of patients who did not have recurrence. While the kep value was previously shown to be significantly (P < .001) different between benign and malignant lesions (24), this parameter had a broad overlap between lesion types. Similarly, while the initial (prechemotherapy) tumor volume was significantly (P = .006) different between the recurrence group and the nonrecurrence group, there was also broad overlap. These two variables are therefore of only limited diagnostic use in the individual patient (10). In contrast, the predictors derived in our study, defined as tumor volume measurements (in voxels) for set ranges of SER (or kep) values, involved both microvascularity and size information and enabled the identification of more than half the patients with recurrence, without the miscategorization of any patients in the recurrence-free group as likely to have recurrence.
The most interesting finding of our study was the prognostic importance of the prechemotherapy volume of the infiltrating cancerous tissues with low SER values. Of note, color-coded SER maps overlaid on gray-scale contrast-enhanced images demonstrated a fine diffuse infiltrative pattern of these low SER (blue) voxels within the parenchyma—a finding that might not be apparent if imaging with a lower spatial resolution. As is well known, the growing tumor tissue is fed by diffusion from the surrounding tissue until it reaches 1–2 mm in size (17). Once it gets this large, its viability depends on new capillary formation. The low SER value associated with the cancerous tissues infiltrating into the breast parenchyma may represent newly developed viable tumor tissue where angiogenesis is still in progress. Another explanation is that infiltration is a process where a tumor grows into adjacent tissues along either vessels or lymphatics, and the voxel SER value measured with the infiltrating cancerous tissue reflects the partial volume effects of cancerous and normal tissues. Combined use of the prechemotherapy high SER predictor and low SER predictor will improve the prognostic value of this technique. As previously described, early prediction of failure is most important in treatment planning (32).
In contrast to traditional quantitative methods with multicompartmental models, one of the advantages of the SER method is that R10 calibration is not needed. The R10 of the breast tumor tissue may have a wide range of values. The precise value makes a pronounced difference to the enhancement curve and must be taken into account in the analysis of the curve, whatever model is used. R10 should be measured as accurately as possible, and this may become a limiting factor in the use of the pharmacokinetic model method for characterization of tumors (28). Results of recent simulation work (23) have demonstrated that SER is a close estimate of the contrast agent concentration ratio at the first and second time points when acquired with a large flip angle (>40°). In the two-compartment model, the ratio can be made to monotonically relate to kep by choosing appropriate delay times for the postcontrast measurements (eg, first time point = 1 minute) (23).
In our study, we resimulated the relationship between SER and kep on the basis of the acquisition conditions applied to the data collected between 1995 and 2002. With the time points of 2.5 and 7.5 minutes, the SER maintains the monotonic relationship with kep across the kep range of 0–1 minute−1, although it exhibits a plateau where kep is higher than 1 minute−1. In addition, with the relatively low flip angle (20°) used in our study, the dynamic range of the SER curve is affected by the value of ve. Despite these undesirable features, the simulated SER versus kep curves were still instructive in formulation of the hypotheses for predicting disease recurrence by using SER imaging. The breast tumor volume with SER values above a threshold corresponding to the upper limit of mean kep in benign tumors, 0.88 minutes−1 (24), and the volume of cancerous breast tissue infiltrating into the parenchyma were important predictors of disease recurrence.
Another limitation was that the cutoff criteria of predictor variables to separate higher or lower risk patients in our study may be data dependent and may need to be validated in a prospective study. Larger patient populations receiving the same treatment methods should be studied to further evaluate the prognostic value of the SER indicators and to refine the proper cutoff criteria.
In conclusion, our study results demonstrate that the size of tumor volume segmented by using set ranges of SER values, combined with the spatial pattern of SER images obtained at high-spatial-resolution dynamic contrast-enhanced MR imaging, can be used to help identify those breast tumors at high risk for disease recurrence with high specificity even prior to preoperative chemotherapy. These findings may be of potential value for treatment strategies, as high-risk patients could be given more aggressive treatment regimens (when prechemotherapy prediction is given) or receive additional treatment and monitoring.
ADVANCES IN KNOWLEDGE
-
•.
The signal enhancement ratio (SER) of breast tumors measured at high-spatial-resolution dynamic contrast-enhanced MR imaging with acquisition of data at three time points was closely related to the redistribution rate constant (kep).
-
•.
The volume of tumor with high SER corresponding to kep greater than 0.88 minutes−1 could help predict tumor recurrence.
-
•.
The volume (in voxels) of malignant tissue infiltrating into the breast parenchyma was predictive of tumor recurrence; such infiltrating voxels were of low SER corresponding to kep less than 0.20 minutes−1.
IMPLICATIONS FOR PATIENT CARE
-
•.
Tumor volume measures on the basis of SER values, combined with spatial pattern of SER images obtained at high-spatial-resolution dynamic contrast-enhanced MR imaging, can be used to help identify those breast tumors at high risk for disease recurrence even prior to preoperative chemotherapy.
-
•.
Our findings may be of potential value for treatment strategies.
Acknowledgments
The authors thank Evelyn Proctor, RT, for data acquisition and Xiaoping Zhu, MD, PhD, for helpful discussion and editing the paper.
Our study results demonstrate that the size of tumor volume segmented by using set ranges of signal enhancement ratio (SER) values, combined with the spatial pattern of SER images obtained at high-spatial-resolution dynamic contrast-enhanced MR imaging, can be used to help identify those breast tumors at high risk for disease recurrence with high specificity even prior to preoperative chemotherapy.
Footnotes
Author contributions: Guarantors of integrity of entire study, K.L.L., L.J.E., N.M.H.; study concepts/study design or data acquisition or data analysis/interpretation, all authors; manuscript drafting or manuscript revision for important intellectual content, all authors; manuscript final version approval, all authors; literature research, K.L.L., B.N.J.; clinical studies, K.L.L., J.G., L.J.E., N.M.H.; statistical analysis, K.L.L., Y.L.; and manuscript editing, K.L.L., S.C.P., B.N.J., Y.L., L.J.E., N.M.H.
Authors stated no financial relationship to disclose.
References
- 1.Kelcz F, Santyr G. Gadolinium-enhanced breast MRI. Crit Rev Diagn Imaging 1995;36:287–338. [PubMed] [Google Scholar]
- 2.Hulka CA, Smith BL, Sgroi DC, et al. Benign and malignant breast lesions: differentiation with echo-planar MR imaging. Radiology 1995;197:33–38. [DOI] [PubMed] [Google Scholar]
- 3.Stomper PC, Winston JS, Herman S, et al. Angiogenesis and dynamic MR imaging gadolinium enhancement of malignant and benign breast lesions. Breast Cancer Res Treat 1997;45:39–46. [DOI] [PubMed] [Google Scholar]
- 4.Mussurakis S, Buckley DL, Drew PJ, et al. Dynamic MR imaging of the breast combined with analysis of contrast agent kinetics in the differentiation of primary breast tumours. Clin Radiol 1997;52:516–526. [DOI] [PubMed] [Google Scholar]
- 5.Issa B, Buckley DL, Turnbull LW. Heterogeneity analysis of Gd-DTPA uptake: improvement in breast lesion differentiation. J Comput Assist Tomogr 1999;23:615–621. [DOI] [PubMed] [Google Scholar]
- 6.Liney GP, Gibbs P, Hayes C, Leach MO, Turnbull LW. Dynamic contrast-enhanced MRI in the differentiation of breast tumors: user-defined versus semi-automated region-of-interest analysis. J Magn Reson Imaging 1999;10:945–949. [DOI] [PubMed] [Google Scholar]
- 7.Kuhl CK, Schild HH. Dynamic image interpretation of MRI of the breast. J Magn Reson Imaging 2000;12:965–974. [DOI] [PubMed] [Google Scholar]
- 8.Wedegartner U, Bick U, Wortler K, Rummeny E, Bongartz G. Differentiation between benign and malignant findings on MR-mammography: usefulness of morphological criteria. Eur Radiol 2001;11:1645–1650. [DOI] [PubMed] [Google Scholar]
- 9.Furman-Haran E, Schechtman E, Kelcz F, Kirshenbaum K, Degani H. Magnetic resonance imaging reveals functional diversity of the vasculature in benign and malignant breast lesions. Cancer 2005;104:708–718. [DOI] [PubMed] [Google Scholar]
- 10.Kuhl CK, Schild HH, Morakkabati N. Dynamic bilateral contrast-enhanced MR imaging of the breast: trade-off between spatial and temporal resolution. Radiology 2005;236:789–800. [DOI] [PubMed] [Google Scholar]
- 11.Hulka CA, Edmister WB, Smith BL, et al. Dynamic echo-planar imaging of the breast: experience in diagnosing breast carcinoma and correlation with tumor angiogenesis. Radiology 1997;205:837–842. [DOI] [PubMed] [Google Scholar]
- 12.Bone B, Aspelin P, Bronge L, Veress B. Contrast-enhanced MR imaging as a prognostic indicator of breast cancer. Acta Radiol 1998;39:279–284. [DOI] [PubMed] [Google Scholar]
- 13.Mussurakis S, Buckley DL, Horsman A. Dynamic MR imaging of invasive breast cancer: correlation with tumour grade and other histological factors. Br J Radiol 1997;70:446–451. [DOI] [PubMed] [Google Scholar]
- 14.Stomper PC, Herman S, Klippenstein DL, et al. Invasive breast carcinoma: analysis of dynamic magnetic resonance imaging enhancement features and cell proliferative activity determined by DNA S-phase percentage. Cancer 1996;77:1844–1849. [DOI] [PubMed] [Google Scholar]
- 15.Bone B, Szabo BK, Perbeck LG, Veress B, Aspelin P. Can contrast-enhanced MR imaging predict survival in breast cancer? Acta Radiol 2003;44:373–378. [DOI] [PubMed] [Google Scholar]
- 16.Su MY, Cheung YC, Fruehauf JP, et al. Correlation of dynamic contrast enhancement MRI parameters with microvessel density and VEGF for assessment of angiogenesis in breast cancer. J Magn Reson Imaging 2003;18:467–477. [DOI] [PubMed] [Google Scholar]
- 17.Tuncbilek N, Karakas HM, Okten OO. Dynamic magnetic resonance imaging in determining histopathological prognostic factors of invasive breast cancers. Eur J Radiol 2005;53:199–205. [DOI] [PubMed] [Google Scholar]
- 18.Padhani AR, Hayes C, Assersohn L, et al. Prediction of clinicopathologic response of breast cancer to primary chemotherapy at contrast-enhanced MR imaging: initial clinical results. Radiology 2006;239:361–374. [DOI] [PubMed] [Google Scholar]
- 19.Hylton NM Vascularity assessment of breast lesions with gadolinium-enhanced MR imaging. Magn Reson Imaging Clin N Am 2001;9:321–332, vi. [PubMed] [Google Scholar]
- 20.Furman-Haran E, Degani H. Parametric analysis of breast MRI. J Comput Assist Tomogr 2002;26:376–386. [DOI] [PubMed] [Google Scholar]
- 21.Esserman L, Hylton N, George T, Weidner N. Contrast-enhanced magnetic resonance imaging to assess tumor histopathology and angiogenesis in breast carcinoma. Breast J 1999;5:13–21. [DOI] [PubMed] [Google Scholar]
- 22.Tofts PS Modeling tracer kinetics in dynamic Gd-DTPA MR imaging. J Magn Reson Imaging 1997;7:91–101. [DOI] [PubMed] [Google Scholar]
- 23.Li KL, Henry RG, Wilmes LJ, et al. Kinetic assessment of breast tumors using high spatial resolution signal enhancement ratio (SER) imaging. Magn Reson Med 2007;58:572–581. [DOI] [PMC free article] [PubMed] [Google Scholar]
- 24.Knopp MV, Weiss E, Sinn HP, et al. Pathophysiologic basis of contrast enhancement in breast tumors. J Magn Reson Imaging 1999;10:260–266. [DOI] [PubMed] [Google Scholar]
- 25.Kuhl CK, Mielcareck P, Klaschik S, et al. Dynamic breast MR imaging: are signal intensity time course data useful for differential diagnosis of enhancing lesions? Radiology 1999;211:101–110. [DOI] [PubMed] [Google Scholar]
- 26.Liu PF, Debatin JF, Caduff RF, et al. Improved diagnostic accuracy in dynamic contrast enhanced MRI of the breast by combined quantitative and qualitative analysis. Br J Radiol 1998;71:501–509. [DOI] [PubMed] [Google Scholar]
- 27.Li KL, Wilmes LJ, Henry RG, et al. Heterogeneity in the angiogenic response of a BT474 human breast cancer to a novel vascular endothelial growth factor-receptor tyrosine kinase inhibitor: assessment by voxel analysis of dynamic contrast-enhanced MRI. J Magn Reson Imaging 2005;22:511–519. [DOI] [PubMed] [Google Scholar]
- 28.Tofts PS, Berkowitz B, Schnall MD. Quantitative analysis of dynamic Gd-DTPA enhancement in breast tumors using a permeability model. Magn Reson Med 1995;33:564–568. [DOI] [PubMed] [Google Scholar]
- 29.Eliat PA, Dedieu V, Bertino C, et al. Magnetic resonance imaging contrast-enhanced relaxometry of breast tumors: an MRI multicenter investigation concerning 100 patients. Magn Reson Imaging 2004;22:475–481. [DOI] [PubMed] [Google Scholar]
- 30.Bottomley PA, Hardy CJ, Argersinger RE, Allen-Moore G. A review of 1H nuclear magnetic resonance relaxation in pathology: are T1 and T2 diagnostic? Med Phys 1987;14:1–37. [DOI] [PubMed] [Google Scholar]
- 31.Chung M, Chang HR, Bland KI, Wanebo HJ. Younger women with breast carcinoma have a poorer prognosis than older women. Cancer 1996;77:97–103. [DOI] [PubMed] [Google Scholar]
- 32.Mayr NA, Taoka T, Yuh WT, et al. Magnetic resonance imaging in the assessment of radiation response in cervical cancer: regarding Hatano K et al. IJROBP 1999;45:399-344. Int J Radiat Oncol Biol Phys 2000;48:910–912. [DOI] [PubMed] [Google Scholar]
- 33.Tofts PS, Brix G, Buckley DL, et al. Estimating kinetic parameters from dynamic contrast-enhanced T(1)-weighted MRI of a diffusable tracer: standardized quantities and symbols. J Magn Reson Imaging 1999;10:223–232. [DOI] [PubMed] [Google Scholar]
- 34.Partridge SC, Gibbs JE, Lu Y, et al. MRI measurements of breast tumor volume predict response to neoadjuvant chemotherapy and recurrence-free survival. AJR Am J Roentgenol 2005;184:1774–1781. [DOI] [PubMed] [Google Scholar]


