Blood oxygen level–dependent functional MR imaging activation is significantly reduced within the primary motor gyrus of the tumor-containing hemisphere in patients with glioblastomas but not in patients with metastases or meningiomas.
Abstract
Purpose
To evaluate the effects of histologic features and anatomic magnetic resonance (MR) imaging characteristics of brain tumors on the functional MR imaging signal in the primary motor cortex (PMC), as false-negative blood oxygen level–dependent (BOLD) functional MR imaging activation can limit the accurate localization of eloquent cortices.
Materials and Methods
Institutional review board approval was obtained, and informed consent was waived for this HIPAA-compliant retrospective study. It comprised 63 patients referred between 2006 and 2014 for preoperative functional MR imaging localization of the Rolandic cortex. The patients had glioblastoma multiforme (GBM) (n = 20), metastasis (n = 21), or meningioma (n = 22). The volumes of functional MR imaging activation were measured during performance of a bilateral hand motor task. Ratios of functional MR imaging activation were normalized to PMC volume. Statistical analysis was performed for the following: (a) differences between hemispheres within each histologic tumor type (paired Wilcoxon test), (b) differences across tumor types (Kruskal-Wallis and Fisher tests), (c) pairwise tests between tumor types (Mann-Whitney U test), (d) relationships between fast fluid-attenuated inversion recovery (FLAIR) data and enhancement volume with activation (Spearman rank correlation coefficient), and (e) differences in activation volumes by tumor location (Mann-Whitney U test).
Results
A significant interhemispheric difference was found between the activation volumes in GBMs (mean, 511.43 voxels ± 307.73 [standard deviation] and 330.78 voxels ± 278.95; P < .01) but not in metastases (504.68 voxels ± 220.98 and 460.22 voxels ± 276.83; P = .15) or meningiomas (424.07 voxels ± 247.58 and 415.18 voxels ± 222.36; P = .85). GBMs showed significantly lower activation ratios (median, 0.49; range, 0.04–1.15) than metastases (median, 0.79; range, 0.28–1.66; P = .043) and meningiomas (median, 0.91; range, 0.52–2.05; P < .01). There was a moderate correlation with the volumes of FLAIR abnormality in metastases (ρ = −0.50) and meningiomas (ρ = −0.55). Enhancement volume (ρ = −0.11) and tumor distance from the PMC (median, 0.73 and range, 0.04–2.05 for near and median, 0.82 and range, 0.39–1.66 for far; P = .14) did not influence activation.
Conclusion
BOLD functional MR imaging activation in the ipsilateral PMC is influenced by tumor type and is significantly reduced in GBMs. FLAIR abnormality correlates moderately with the activation ratios in metastases and meningiomas.
© RSNA, 2016
Introduction
Blood oxygen level–dependent (BOLD) functional magnetic resonance (MR) imaging is a powerful noninvasive method used to map brain cortical function (1–3). Functional MR imaging has been shown to be useful in preoperative planning and risk assessment and as a guide to intraoperative cortical stimulation (4). Increasingly, functional MR imaging is being considered the standard of care in the preoperative work up of patients with brain tumors (5,6). Thus, there is much interest in identifying the factors that influence the accuracy of BOLD functional MR imaging in mapping functions such as motor and language.
The BOLD functional MR imaging contrast arises from changes in the ratio of deoxyhemoglobin and oxyhemoglobin in response to a behavioral paradigm (7,8). The BOLD functional MR imaging signal intensity is mainly obtained from the relationship between neural activity and changes in blood flow, blood volume, and the cerebral metabolic rate of oxygen (neurovascular coupling) (9–11). High-grade gliomas contain abundant abnormal neovasculature, which has been shown to have a dysfunctional autoregulation and a consequential compromise of the flow dynamics (neurovascular uncoupling). This abnormal neovasculature is thought to lead to a decreased functional MR imaging contrast between oxyhemoglobin and deoxyhemoglobin, leading to a muting of the BOLD effect (12–14). Previous smaller-scale studies have suggested that functional MR imaging activation volumes are truncated in the presence of tumors, particularly high-grade gliomas (15,16), thus making functional MR imaging potentially less reliable in peritumoral regions. It has been suggested that in addition to the histopathologic properties, other tumor properties (edema, volume, and location) and factors (prior brain surgery, age, motor deficits, and magnetic field strength) may influence BOLD functional MR imaging activation (17–19).
False-negative BOLD functional MR imaging activation can limit the accurate localization of eloquent cortices. The purpose of our current study was to study the effects of histologic features and anatomic MR imaging characteristics of brain tumors on the functional MR imaging signal in the primary motor cortex (PMC).
We hypothesized that (a) BOLD functional MR imaging activation ipsilateral to the tumor would be significantly lower in patients with high-grade gliomas than in patients with metastases or meningiomas and (b) the volume of fluid-attenuated inversion recovery (FLAIR) abnormality, the volume of enhancement, and tumor location would affect the ipsilateral BOLD functional MR imaging activation.
Materials and Methods
Subjects
Institutional review board approval was obtained for this Health Insurance Portability and Accountability Act–compliant retrospective study, and the need to obtain informed consent was waived. Among patients consecutively referred for preoperative localization of the Rolandic cortex between June 2006 and October 2014, only subjects who met the following criteria were included: (a) the patient could perform the bilateral finger-tapping task; (b) the patient had a newly histopathologically confirmed glioblastoma multiforme (GBM), metastasis, or meningioma; (c) the tumor was unilateral; and (d) the patient had not previously undergone brain surgery.
Eighty-one patients were screened, and 74 met the initial criteria. After we reviewed the data, 11 patients were excluded (four patients with GBMs, five patients with metastases, and two patients with meningiomas) because of functional MR imaging studies that were contaminated with movement artifacts or displayed a low signal-to-noise ratio that resulted in nonspecific activation. As a result, 63 patients (31 men and 32 women; age range, 24–93 years; mean age, 62 years) were enrolled in the study: 48 patients (73% of the cohort) were between 50 and 70 years, six patients (10% of the cohort) were younger than 50 years, and nine patients (17% of the cohort) were older than 70 years of age. Patients were assigned to different groups on the basis of tumor pathologic type, and the pathologic breakdown was 20 GBMs, 21 metastases, and 22 meningiomas. Details are provided in Table E1 (online).
MR Imaging Parameters
The MR data were acquired with either a 1.5-T (19 patients, with five GBMs, five metastases, and nine meningiomas) or 3.0-T (44 patients, with 15 GBMs, 16 metastases, and 13 meningiomas) TwinSpeed imager (GE Medical Systems, Milwaukee, Wis) with a standard eight-channel head coil. Functional images were acquired with a single-shot T2*-weighted gradient-echo echo-planar imaging sequence with the following parameters: repetition time msec/echo time msec, 4000/40 for 1.5 T and 4000/35 for 3.0 T; 90° flip angle; 128 × 128 matrix; 4.5-mm section thickness with no intersection gap; 24-cm field of view; and 34–36 oblique sections. T1-weighted spin-echo images (400/14, 256 × 256 matrix, 4.5-mm thickness), T2-weighted spin-echo images (4000/102, 256 × 256 matrix; 4.5-mm thickness), FLAIR images (10 000/106; inversion time, 220 msec; 90° flip angle; 256 × 256 matrix; 4.5-mm thickness), and T1-weighted three-dimensional spoiled gradient-recalled acquisition in the steady state, or GRASS, images (6.9/3, 15° flip angle, 256 × 256 matrix, 1.5-mm thickness, 240-mm field of view) were acquired so that we could superimpose functional images on structural images.
Functional MR Imaging Task
A block-designed paradigm of alternating rest (40 seconds) and active (20 seconds) periods was performed with each patient. The task consisted of 90 volumes for a total of six cycles each of stimulation and rest periods. All patients performed self-paced finger tapping involving digits one through five on both hands. Task instructions were delivered aurally. Cortical activation associated with task performance was monitored with real-time software (Brainwave RT; Medical Numerics, Germantown, Md).
Functional MR Imaging Data Processing
Raw functional MR imaging data were transferred to a Linux workstation and were analyzed with AFNI (Analysis of Functional NeuroImages, http://afni.nimh.nih.gov) (20). Each data set was inspected for artifacts and head motion. The functional data were then realigned, corrected for head motion against a reference image, and smoothed with a Gaussian 4-mm full-width-at-half-maximum filter to increase the signal-to-noise ratio. Linear trend was removed if necessary. Statistical maps of activation were generated by using cross-correlation analysis (21). A modeled waveform corresponding to the task block was cross correlated with all pixel time courses to identify stimulus-locked responses. Functional activation maps were generated at a threshold of P < .001 and were used to determine the volume of BOLD functional MR imaging activation within the PMC.
Functional MR imaging activation volumes.—A region of interest was manually drawn around the PMC, defined as the entire precentral gyrus, on a section-by-section basis in both hemispheres. All measurements were supervised by a fellowship-trained neuroradiologist with 20 years of experience in functional MR imaging.
Because functional MR imaging activation volumes can be threshold dependent (22), three thresholds were used to compare functional MR imaging activation volumes (from a maximal correlation score of 0.62 determined by multiple comparison correction, a minimal correlation score of 0.4, and an in-between score of 0.5). Statistical significance was set at P < .001. We normalized the number of activated voxels measured in the PMC of the hemisphere ipsilateral to the tumor to the contralateral side to account for differences seen as a result of gyral volume. A normalization method (13) was applied to determine relative and adjusted functional MR imaging activation ratios, as follows:
where Vmc(t) is the gyral volume of the PMC in the ipsilateral hemisphere and Vmc(n) is the gyral volume of the PMC in the contralateral hemisphere. Relative activation was calculated with the following equation
where VA(t) is the functional MR imaging activation volume in the ipsilateral PMC, VA(n) is the functional MR imaging activation volume in the contralateral PMC, and OR is the r value (OR1 = 0.62, OR2 = 0.5, OR3 = 0.4). To calculate the adjusted activation, we divided the relative activation by the relative volume.
To determine the volumes of the FLAIR abnormality and contrast enhancement, a region of interest was manually drawn on each section for each patient where this abnormality was present. To obtain the volume, the areas of the regions of interest were summed and multiplied by the section thickness. These measurements were performed by using BrainLab (23). To determine the distance of the tumor to the PMC, we overlaid the functional images onto the T1-gadolinium-enhanced images. If the distance from the closest border of enhancement was within one gyrus from the PMC, the tumor was classified as “near.” All other tumors were considered “far.”
Statistical Analysis
Differences between hemispheres within each pathologic group were tested with the paired Wilcoxon signed-rank test. Differences across tumor types were tested with the Kruskal-Wallis test for continuous variables and the Fisher exact test for categoric variables. Pairwise tests between tumor types were conducted by using the Mann-Whitney U Test. The relationships between both FLAIR abnormality and tumor volume with BOLD activation were analyzed by using the Spearman rank correlation coefficient, and the Bonferroni correction was used to adjust P values for the four tests performed. Finally, the differences in BOLD functional MR imaging activation volumes by tumor location were determined by using the Mann-Whitney U Test. All statistical tests were two sided, and the level of significance was set at P < .05. Statistical analyses were performed by using R (version 3.0.1; R Development Core Team).
Results
BOLD Functional MR Imaging Activation Volumes in Ipsilateral PMC versus Contralateral PMC
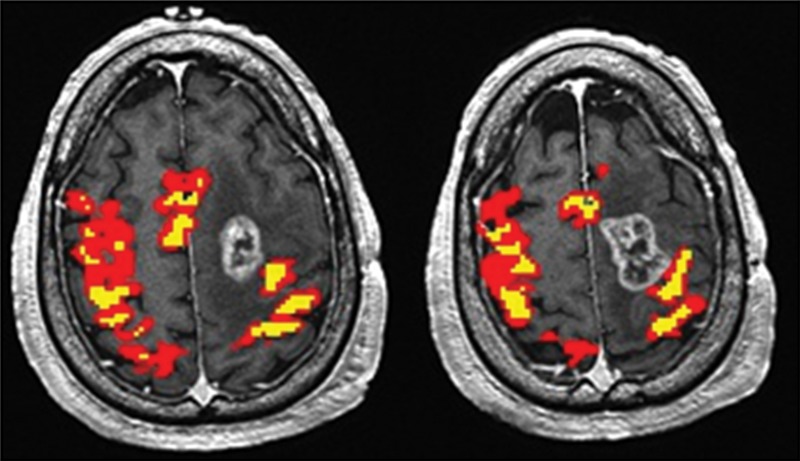
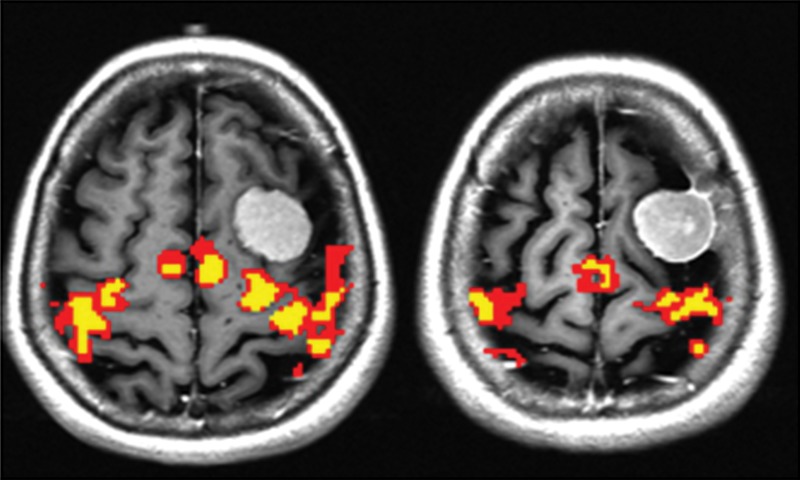
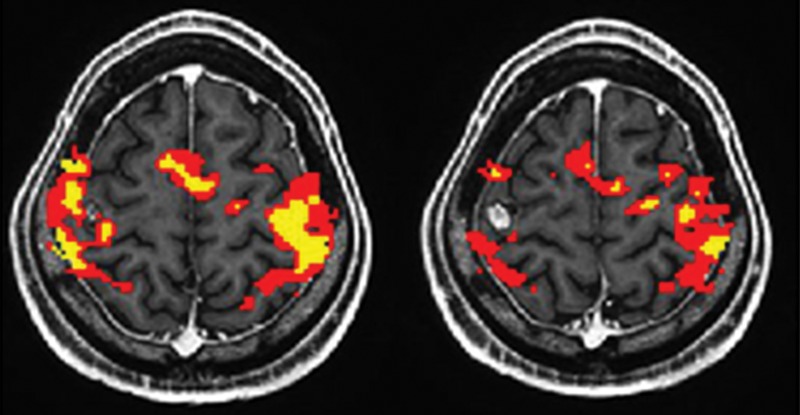
Only the GBM group demonstrated a significant difference in the BOLD functional MR imaging activation volumes in the tumor-containing hemisphere compared with the contralateral hemisphere (P < .01). In contrast, there were no significant interhemispheric BOLD functional MR imaging volume differences in the PMCs of patients with metastases (P = .15) or meningiomas (P = .85). Representative functional MR imaging maps of motor activation in different tumor types are shown in Figures 1–3. The BOLD functional MR imaging activation volumes are shown in Table 1.
Figure 1:
Maps of BOLD functional MR imaging motor activation in a 59-year-old man with a GBM adjacent to the left PMC. Axial functional MR T2*-weighted gradient-echo echo-planar sequence images are superimposed on T1-weighted spin-echo anatomic reference images. Color = BOLD functional MR imaging activation following a range of r values (yellow, ≥0.1; 0.5 < red < 0.7). BOLD signal intensity reduction peaks in high-grade gliomas, as evidenced by the asymmetric BOLD functional MR imaging pattern in the hemisphere ipsilateral to the tumor.
Figure 3:
Maps of BOLD functional MR imaging motor activation in a 59-year-old woman with a meningioma located far to the left of the PMC. Axial functional MR T2*-weighted gradient-echo echo-planar sequence images are superimposed on T1-weighted spin-echo anatomic reference images. Color = BOLD functional MR imaging activation following a range of r values (yellow, ≥0.1; 0.5 < red < 0.7). BOLD functional MR imaging signal is minimally changed in patients with extra-axial tumors, as indicated by the symmetric interhemispheric BOLD functional MR imaging activation.
Table 1.
BOLD Functional MR Imaging Activation Volumes in the Contralateral and Ipsilateral PMC

*P values were calculated with the two-tailed Mann-Whitney U Test. P < .05 indicated significance.
Figure 2:
Maps of BOLD functional MR imaging motor activation in a 24-year-old man with a metastasis in the right PMC. Axial functional MR T2*-weighted gradient-echo echo-planar sequence images are superimposed on T1-weighted spin-echo anatomic reference images. Color = BOLD functional MR imaging activation following a range of r values (yellow, ≥0.1; 0.5 < red < 0.7). BOLD functional MR imaging activation is moderately reduced in noninfiltrative intra-axial tumors.
Effect of Tumor Type on BOLD Functional MR Imaging Activation
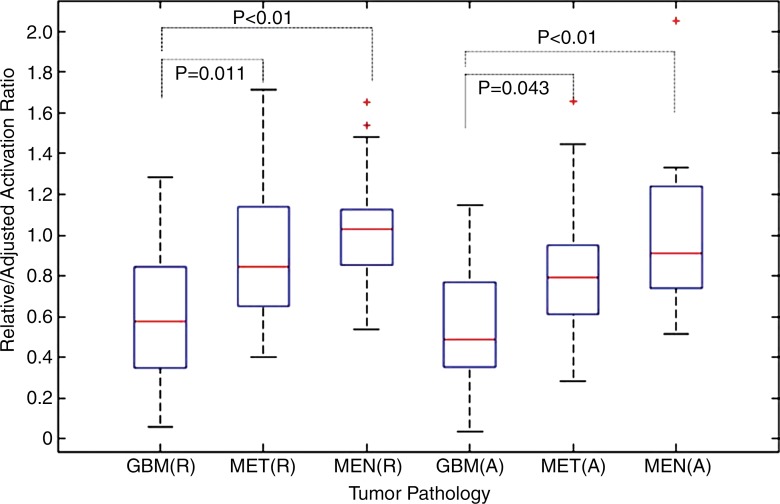
In patients with GBMs, we observed the greatest decrease of the BOLD functional MR imaging activation ratios in the tumor-containing hemisphere, before (mean difference, −39%) and after (mean difference, −44%) normalization to the gyral volume of the PMC (P < .01). Compared with those in GBMs, the ipsilateral normalized BOLD functional MR imaging activation ratios were reduced to a lesser degree in patients with metastases (mean difference, −19%; P = .043) and were affected least in the meningioma group (mean difference, 0%; P < .01). There was no significant difference between metastases and meningiomas (P = .065). Differences in normalized BOLD functional MR imaging activation across tumor types are shown in Figure 4.
Figure 4:
Box plot shows relative (R) and adjusted (A) BOLD functional MR imaging activation ratios according to tumor type. Line in each box = the median, and the horizontal boundaries of the boxes = the first and third quartiles. The vertical error bars extend to 1.5 times the first and third quartiles. Outliers (+) are plotted as individual points. P values were calculated with the two-tailed Mann-Whitney U Test. P < .05 indicated significance.
Effect of Other Tumor Properties on BOLD Functional MR Imaging Activation
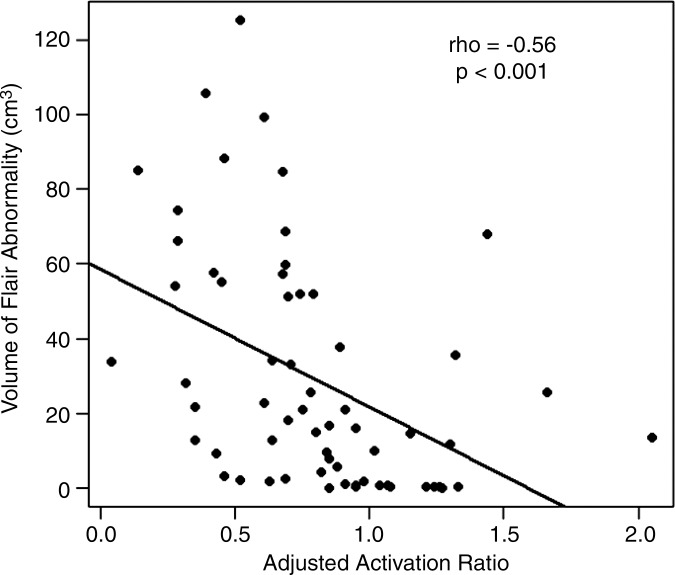
There was a moderate inverse correlation between the ipsilateral adjusted BOLD functional MR imaging activation ratios of all tumors and the corresponding volumes of FLAIR abnormality (ρ = −0.56, P < .001). This relationship is presented in Figure 5.
Figure 5a:
Correlation between BOLD functional MR imaging activation and FLAIR abnormality volume. Scatterplots show BOLD functional MR imaging adjusted activation versus FLAIR abnormality volume for (a) all tumors and for each subgroup of tumor type: (b) GBMs, (c) metastases, and (d) meningiomas.
Figure 5b:
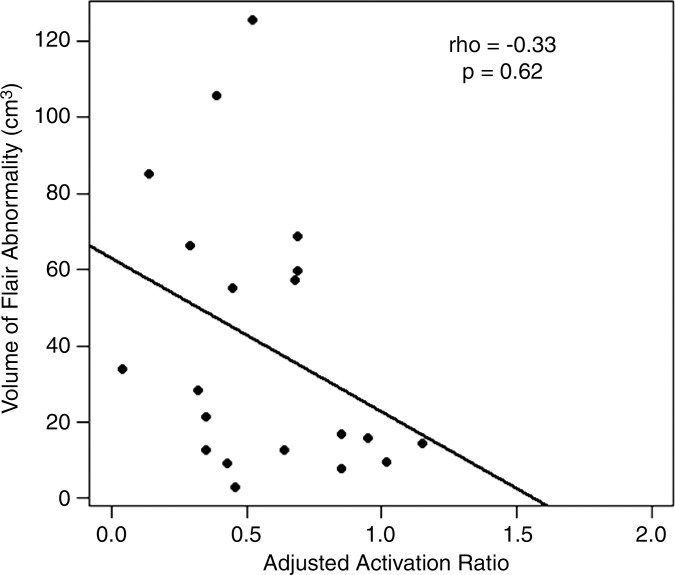
Correlation between BOLD functional MR imaging activation and FLAIR abnormality volume. Scatterplots show BOLD functional MR imaging adjusted activation versus FLAIR abnormality volume for (a) all tumors and for each subgroup of tumor type: (b) GBMs, (c) metastases, and (d) meningiomas.
Figure 5c:
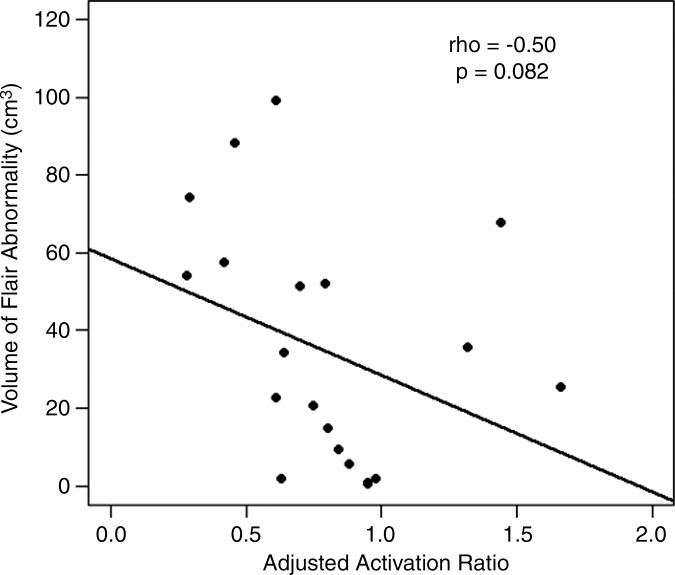
Correlation between BOLD functional MR imaging activation and FLAIR abnormality volume. Scatterplots show BOLD functional MR imaging adjusted activation versus FLAIR abnormality volume for (a) all tumors and for each subgroup of tumor type: (b) GBMs, (c) metastases, and (d) meningiomas.
Figure 5d:
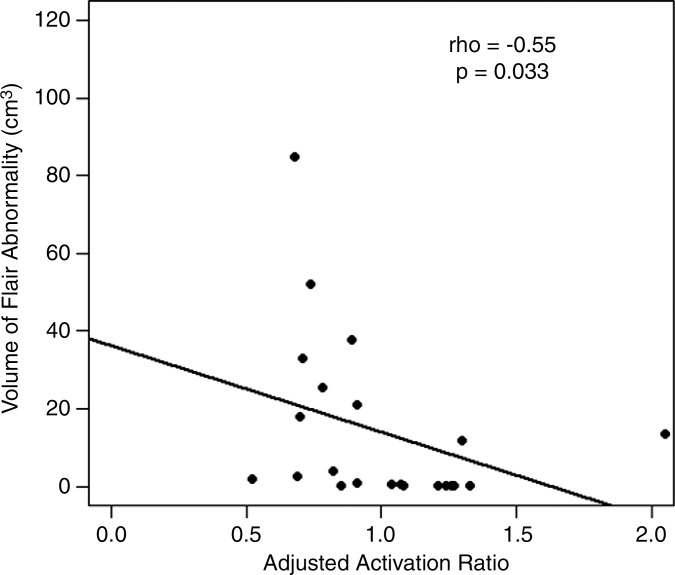
Correlation between BOLD functional MR imaging activation and FLAIR abnormality volume. Scatterplots show BOLD functional MR imaging adjusted activation versus FLAIR abnormality volume for (a) all tumors and for each subgroup of tumor type: (b) GBMs, (c) metastases, and (d) meningiomas.
We found a weak correlation between BOLD functional MR imaging activation and FLAIR volumes in GBMs (ρ = −0.33, P = .62). The correlations were moderate in magnitude in metastases (ρ = −0.50, P = .082) and meningiomas (ρ = −0.55, P = .033).
There was a significant difference in tumor volume between the three pathologic types (P < .001). The tumors were, on average, larger in the meningioma group (median volume, 24 cm3) compared with the intra-axial lesions: GBMs (median volume, 17 cm3) and metastases (median volume, 5 cm3).
For all tumors taken together, the ipsilateral adjusted BOLD functional MR imaging activation ratios did not correlate with tumor volume (ρ = −0.11). For subgroup analysis, there was no evidence of correlation in GBMs (ρ = −0.20), metastases (ρ = −0.05), and meningiomas (ρ = −0.15). The results are presented in Table 2.
Table 2.
Effect of FLAIR Volume, Tumor Distance, and Volume of Enhancement on BOLD Functional MR Imaging Activation

Note.—Unless otherwise specified, data in parentheses are medians, with the range in parentheses.
*P value was computed by using the Fisher exact test. P < .05 indicated significance.
†Data are numbers of patients, with percentages in parentheses.
‡P value was calculated with the Kruskal-Wallis test.
For all tumors taken together, there were no significant differences in the ipsilateral adjusted BOLD functional MR imaging activation ratios between patients with far (n = 13) and those with near (n = 50) lesions to the PMC (P = .14). The statistical analysis was not performed for each subgroup of tumor type because of an insufficient sample size (Table 2).
Discussion
We found that BOLD functional MR imaging activation is significantly reduced within the primary motor gyrus of the tumor-containing hemisphere in patients with GBMs, but not in metastases and meningiomas. The effect of tumor type must be taken into account in clinical settings, as a potentially muted BOLD functional MR imaging response in the eloquent cortex may compromise correct presurgical planning, with increased risk of postoperative deficits. Therefore, BOLD functional MR imaging maps should be interpreted with caution, particularly in the assessment of patients with glioma. Conversely, BOLD functional MR imaging may be more reliable in other types of tumors.
Previous small-scale studies have suggested that BOLD functional MR imaging activation is significantly reduced in high-grade gliomas, which affect the neovasculature (and presumably uncouple the neurovascular response), compared with that in tumors that do not (13,24–26). However, much evidence in the field results from the analysis of small-sized cohorts of gliomas compared against a heterogeneous group of other tumor types, or with a focus on the incidence of postoperative deficits. Contrary to histopathologic features, the analysis of the anatomic MR imaging characteristics of the tumors and their possible effects on BOLD functional MR imaging signal remain poorly understood.
In this current study, we recruited a larger population to evaluate the influences of three different types of brain tumor on BOLD functional MR imaging in the primary motor gyrus. Our findings seem to concur with the hypothesis that abnormal tumor neovasculature, a pathologic hallmark of GBMs, contributes to neurovascular uncoupling, which might lead to a decrease in BOLD functional MR imaging activation at the ipsilateral hemisphere (14,18,19,27). Yet, we draw attention to the fact that the significant interhemispheric difference in BOLD functional MR imaging activation observed in GBMs, but not within metastases and meningiomas, does not prove per se that there is a difference in this respect between the three tumor types.
Furthermore, we observed that BOLD functional MR imaging activation correlated weakly with the volume of FLAIR abnormality surrounding the area of tumor enhancement in GBMs in comparison with the other tumors. With respect to gliomas, a number of recent articles have shown that the abnormal vascular reactivity extends past the radiologic boundaries of the tumors seen at routine MR imaging (4,13,28). Our results concur with those of Lüdemann et al (29), who did not find any relationship between BOLD functional MR imaging activation and tumor edema (defined as T2-weighted hyperintensity) in a retrospective case-control study of 22 patients (of whom 18 had gliomas) and 11 control subjects, notwithstanding a larger population in the present study. Perhaps the apparent effect is essentially due to abnormal neovasculature in the area of FLAIR abnormality and possibly even beyond. Finally, the other MR imaging features examined, volume of enhancement and tumor location, did not seem to play a role. The explanation may be that BOLD response is inherently a vascular phenomenon, which is marginally affected by tumor size (18,27). However, this should be interpreted with caution, as the exact determination of tumor volumes at routine MR imaging is difficult in gliomas, in which borders are often ill defined (30). The lack of an effect of tumor distance to the PMC may also be supported by the aforementioned studies that demonstrated neurovascular uncoupling past the radiologic borders of the tumors (4,28,31).
Our study had limitations. We included patients imaged at different magnetic field strengths, which is known to significantly affect the BOLD functional MR imaging signal intensity and variability (17). Although we performed intrasubject interhemispheric ratio comparisons to account for the field strength bias, the ratio only partially compensates it, assuming the bias levels to be equally distributed in each hemisphere. Furthermore, the ratio does not eliminate the variability of the functional MR imaging signal. A robust approach should include the field strength as a covariable. Also, it is known that the amplitude of BOLD functional MR imaging signal is directly related to task performance (32). In this study, a modeled waveform corresponding to the task block was cross correlated with all pixel time courses to identify stimulus-locked responses and the corresponding brain activity. Instead, a more reliable approach should quantify the actual behavior output (eg, with an apparatus measuring real-time motor behavior) so that task performance can be cross correlated with the observed BOLD functional MR imaging signal. Finally, we did not account for the effects of the possible use of steroids, and the negative findings may just reflect insufficient power.
In conclusion, BOLD functional MR imaging activation is significantly reduced in the ipsilateral primary motor gyrus in patients with GBMs, but not in the other tumor types. The volume of the FLAIR abnormality correlates moderately with the ipsilateral BOLD functional MR imaging activation in metastases and meningiomas, whereas the other anatomic MR imaging characteristics of the tumors did not play a role.
Advances in Knowledge
■ The volume of blood oxygen level–dependent (BOLD) functional MR imaging activation is significantly reduced in glioblastomas multiforme (GBMs) ipsilateral to the tumor (P < .01) but not in metastases (P = .15) or meningiomas (P = .85).
■ The volume of the fluid-attenuated inversion recovery abnormality correlates moderately with the ipsilateral BOLD functional MR imaging activation in metastases (ρ = −0.50) and meningiomas (ρ = −0.55).
■ There was no correlation between the volume of BOLD functional MR imaging activation and volume of enhancement (ρ = −0.11) or tumor location (P = .14).
Implications for Patient Care
■ BOLD functional MR imaging maps should be interpreted with caution in patients with GBMs undergoing preoperative functional MR imaging for the localization of eloquent cortices adjacent to brain tumors.
■ Conversely, BOLD functional MR imaging activation appears less affected in metastases and meningiomas.
SUPPLEMENTAL TABLE
Received October 13, 2015; revision requested December 4, 2015; revision received January 19, 2016; accepted February 8; final version accepted April 8.
V.H.F.d.A. supported by Haakon and Sigrun Ødegaard’s Research Foundation through the Norwegian Society of Radiology (no. 875942662) and Vestfold Hospital Trust, Norway (no. 197730).
This research was funded in part through the NIH/NCI Cancer Center Support Grant P30 CA008748.
Disclosures of Conflicts of Interest: V.H.F.d.A. disclosed no relevant relationships. K.K.P. disclosed no relevant relationships. N.M.P. disclosed no relevant relationships. K.M.W. disclosed no relevant relationships. A.I.H. disclosed no relevant relationships.
Abbreviations:
- BOLD
- blood oxygen level dependent
- FLAIR
- fluid-attenuated inversion recovery
- GBM
- glioblastoma multiforme
- PMC
- primary motor cortex
References
- 1.Jack CR, Jr, Thompson RM, Butts RK, et al. Sensory motor cortex: correlation of presurgical mapping with functional MR imaging and invasive cortical mapping. Radiology 1994;190(1):85–92. [DOI] [PubMed] [Google Scholar]
- 2.Mueller WM, Yetkin FZ, Hammeke TA, et al. Functional magnetic resonance imaging mapping of the motor cortex in patients with cerebral tumors. Neurosurgery 1996;39(3):515–520; discussion 520–521. [DOI] [PubMed] [Google Scholar]
- 3.Lee CC, Ward HA, Sharbrough FW, et al. Assessment of functional MR imaging in neurosurgical planning. AJNR Am J Neuroradiol 1999;20(8):1511–1519. [PMC free article] [PubMed] [Google Scholar]
- 4.Pillai JJ. The evolution of clinical functional imaging during the past 2 decades and its current impact on neurosurgical planning. AJNR Am J Neuroradiol 2010;31(2):219–225. [DOI] [PMC free article] [PubMed] [Google Scholar]
- 5.Belyaev AS, Peck KK, Brennan NM, Holodny AI. Clinical applications of functional MR imaging. Magn Reson Imaging Clin N Am 2013;21(2):269–278. [DOI] [PubMed] [Google Scholar]
- 6.Choudhri AF, Narayana S, Rezaie R, et al. Same day tri-modality functional brain mapping prior to resection of a lesion involving eloquent cortex: technical feasibility. Neuroradiol J 2013;26(5):548–554. [DOI] [PMC free article] [PubMed] [Google Scholar]
- 7.Ogawa S, Lee TM, Kay AR, Tank DW. Brain magnetic resonance imaging with contrast dependent on blood oxygenation. Proc Natl Acad Sci U S A 1990;87(24):9868–9872. [DOI] [PMC free article] [PubMed] [Google Scholar]
- 8.Kwong KK, Belliveau JW, Chesler DA, et al. Dynamic magnetic resonance imaging of human brain activity during primary sensory stimulation. Proc Natl Acad Sci U S A 1992;89(12):5675–5679. [DOI] [PMC free article] [PubMed] [Google Scholar]
- 9.Röther J, Knab R, Hamzei F, et al. Negative dip in BOLD fMRI is caused by blood flow—oxygen consumption uncoupling in humans. Neuroimage 2002;15(1):98–102. [DOI] [PubMed] [Google Scholar]
- 10.Christen T, Bolar DS, Zaharchuk G. Imaging brain oxygenation with MRI using blood oxygenation approaches: methods, validation, and clinical applications. AJNR Am J Neuroradiol 2013;34(6):1113–1123. [DOI] [PMC free article] [PubMed] [Google Scholar]
- 11.Lin FH, Witzel T, Raij T, et al. fMRI hemodynamics accurately reflects neuronal timing in the human brain measured by MEG. Neuroimage 2013;78:372–384. [DOI] [PMC free article] [PubMed] [Google Scholar]
- 12.Holodny AI, Schulder M, Liu WC, Maldjian JA, Kalnin AJ. Decreased BOLD functional MR activation of the motor and sensory cortices adjacent to a glioblastoma multiforme: implications for image-guided neurosurgery. AJNR Am J Neuroradiol 1999;20(4):609–612. [PMC free article] [PubMed] [Google Scholar]
- 13.Holodny AI, Schulder M, Liu WC, Wolko J, Maldjian JA, Kalnin AJ. The effect of brain tumors on BOLD functional MR imaging activation in the adjacent motor cortex: implications for image-guided neurosurgery. AJNR Am J Neuroradiol 2000;21(8):1415–1422. [PMC free article] [PubMed] [Google Scholar]
- 14.Hou BL, Bradbury M, Peck KK, Petrovich NM, Gutin PH, Holodny AI. Effect of brain tumor neovasculature defined by rCBV on BOLD fMRI activation volume in the primary motor cortex. Neuroimage 2006;32(2):489–497. [DOI] [PubMed] [Google Scholar]
- 15.Krings T, Töpper R, Willmes K, Reinges MH, Gilsbach JM, Thron A. Activation in primary and secondary motor areas in patients with CNS neoplasms and weakness. Neurology 2002;58(3):381–390. [DOI] [PubMed] [Google Scholar]
- 16.Jiang Z, Krainik A, David O, et al. Impaired fMRI activation in patients with primary brain tumors. Neuroimage 2010;52(2):538–548. [DOI] [PubMed] [Google Scholar]
- 17.Kim MJ, Holodny AI, Hou BL, et al. The effect of prior surgery on blood oxygen level-dependent functional MR imaging in the preoperative assessment of brain tumors. AJNR Am J Neuroradiol 2005;26(8):1980–1985. [PMC free article] [PubMed] [Google Scholar]
- 18.Liu WC, Feldman SC, Schulder M, et al. The effect of tumour type and distance on activation in the motor cortex. Neuroradiology 2005;47(11):813–819. [DOI] [PubMed] [Google Scholar]
- 19.Chen CM, Hou BL, Holodny AI. Effect of age and tumor grade on BOLD functional MR imaging in preoperative assessment of patients with glioma. Radiology 2008;248(3):971–978. [DOI] [PubMed] [Google Scholar]
- 20.Cox RW. AFNI: software for analysis and visualization of functional magnetic resonance neuroimages. Comput Biomed Res 1996;29(3):162–173. [DOI] [PubMed] [Google Scholar]
- 21.Bandettini PA, Jesmanowicz A, Wong EC, Hyde JS. Processing strategies for time-course data sets in functional MRI of the human brain. Magn Reson Med 1993;30(2):161–173. [DOI] [PubMed] [Google Scholar]
- 22.Chang CY, Peck KK, Brennan NM, Hou BL, Gutin PH, Holodny AI. Functional MRI in the presurgical evaluation of patients with brain tumors: characterization of the statistical threshold. Stereotact Funct Neurosurg 2010;88(1):35–41. [DOI] [PubMed] [Google Scholar]
- 23.Gumprecht HK, Widenka DC, Lumenta CB. BrainLab VectorVision Neuronavigation System: technology and clinical experiences in 131 cases. Neurosurgery 1999;44(1):97–104; discussion 104–105. [DOI] [PubMed] [Google Scholar]
- 24.Zacà D, Jovicich J, Nadar SR, Voyvodic JT, Pillai JJ. Cerebrovascular reactivity mapping in patients with low grade gliomas undergoing presurgical sensorimotor mapping with BOLD fMRI. J Magn Reson Imaging 2014;40(2):383–390. [DOI] [PMC free article] [PubMed] [Google Scholar]
- 25.Bailey PD, Zacà D, Basha MM, et al. Presurgical fMRI and DTI for the prediction of perioperative motor and language deficits in primary or metastatic brain lesions. J Neuroimaging 2015;25(5):776–784. [DOI] [PubMed] [Google Scholar]
- 26.Agarwal S, Sair HI, Yahyavi-Firouz-Abadi N, Airan R, Pillai JJ. Neurovascular uncoupling in resting state fMRI demonstrated in patients with primary brain gliomas. J Magn Reson Imaging 2016;43(3):620–626. [DOI] [PubMed] [Google Scholar]
- 27.Feldman SC, Chu D, Schulder M, et al. The blood oxygen level-dependent functional MR imaging signal can be used to identify brain tumors and distinguish them from normal tissue. AJNR Am J Neuroradiol 2009;30(2):389–395. [DOI] [PMC free article] [PubMed] [Google Scholar]
- 28.Pillai JJ, Zacà D. Comparison of BOLD cerebrovascular reactivity mapping and DSC MR perfusion imaging for prediction of neurovascular uncoupling potential in brain tumors. Technol Cancer Res Treat 2012;11(4):361–374. [DOI] [PubMed] [Google Scholar]
- 29.Lüdemann L, Forschler A, Grieger W, Zimmer C. BOLD signal in the motor cortex shows a correlation with the blood volume of brain tumors. J Magn Reson Imaging 2006;23(4):435–443. [DOI] [PubMed] [Google Scholar]
- 30.Holodny AI, Nusbaum AO, Festa S, Pronin IN, Lee HJ, Kalnin AJ. Correlation between the degree of contrast enhancement and the volume of peritumoral edema in meningiomas and malignant gliomas. Neuroradiology 1999;41(11):820–825. [DOI] [PubMed] [Google Scholar]
- 31.Iranmahboob A, Peck KK, Brennan NP, et al. Vascular reactivity maps in patients with gliomas using breath-holding BOLD fMRI. J Neuroimaging 2015 Aug 6. [Epub ahead of print] [DOI] [PMC free article] [PubMed] [Google Scholar]
- 32.Hamzei F, Dettmers C, Rzanny R, Liepert J, Büchel C, Weiller C. Reduction of excitability (“inhibition”) in the ipsilateral primary motor cortex is mirrored by fMRI signal decreases. Neuroimage 2002;17(1):490–496. [DOI] [PubMed] [Google Scholar]
Associated Data
This section collects any data citations, data availability statements, or supplementary materials included in this article.


