In this prospective, cross-sectional study of adults with variable anthropometric characteristics, a semiautomated MR imaging analysis method provided very good intra- and interexamination repeatability and accuracy of adipose and muscle tissue volumes and proton density fat fractions.
Abstract
Purpose
To determine the repeatability and accuracy of a commercially available magnetic resonance (MR) imaging–based, semiautomated method to quantify abdominal adipose tissue and thigh muscle volume and hepatic proton density fat fraction (PDFF).
Materials and Methods
This prospective study was institutional review board— approved and HIPAA compliant. All subjects provided written informed consent. Inclusion criteria were age of 18 years or older and willingness to participate. The exclusion criterion was contraindication to MR imaging. Three-dimensional T1-weighted dual-echo body-coil images were acquired three times. Source images were reconstructed to generate water and calibrated fat images. Abdominal adipose tissue and thigh muscle were segmented, and their volumes were estimated by using a semiautomated method and, as a reference standard, a manual method. Hepatic PDFF was estimated by using a confounder-corrected chemical shift–encoded MR imaging method with hybrid complex-magnitude reconstruction and, as a reference standard, MR spectroscopy. Tissue volume and hepatic PDFF intra- and interexamination repeatability were assessed by using intraclass correlation and coefficient of variation analysis. Tissue volume and hepatic PDFF accuracy were assessed by means of linear regression with the respective reference standards.
Results
Adipose and thigh muscle tissue volumes of 20 subjects (18 women; age range, 25–76 years; body mass index range, 19.3–43.9 kg/m2) were estimated by using the semiautomated method. Intra- and interexamination intraclass correlation coefficients were 0.996–0.998 and coefficients of variation were 1.5%–3.6%. For hepatic MR imaging PDFF, intra- and interexamination intraclass correlation coefficients were greater than or equal to 0.994 and coefficients of variation were less than or equal to 7.3%. In the regression analyses of manual versus semiautomated volume and spectroscopy versus MR imaging, PDFF slopes and intercepts were close to the identity line, and correlations of determination at multivariate analysis (R2) ranged from 0.744 to 0.994.
Conclusion
This MR imaging–based, semiautomated method provides high repeatability and accuracy for estimating abdominal adipose tissue and thigh muscle volumes and hepatic PDFF.
© RSNA, 2017
Introduction
Because of the increasing prevalence of obesity and its metabolic manifestations, there is a growing need to assess body composition, including estimation of adipose tissue and skeletal muscle volumes. Dual-energy x-ray absorptiometry (1) can be used for this but requires the use of modeling assumptions to differentiate visceral adipose tissue (VAT) from subcutaneous adipose tissue (SCAT), which introduces errors in the quantification of these compartments. Computed tomography allows accurate estimation of body compartment volumes but necessitates an undesirable radiation dose for whole-body assessment. Magnetic resonance (MR) imaging is also used to estimate SCAT (2,3), VAT (2,3), and muscle volumes (4). Advantages of MR imaging are that it permits reliable separation of SCAT from VAT, uses no ionizing radiation, and provides “one-stop” quantification of adipose tissue volumes and hepatic fat content.
Historically, MR imaging methods for adipose tissue volume quantification relied on manual segmentation, which is laborious, expensive, available only in specialized centers, and thus impractical for many research studies and not feasible for clinical care. Because of the limitations of manual segmentation, automated and semiautomated methods have been developed for adipose (3,5–15) and muscle (16–18) tissue segmentation. However, these methods are limited by binary tissue classification, two-dimensional segmentation, or both. Binary classification of each voxel as either adipose or nonadipose tissue leads to underestimation at tissue interfaces, with voxels containing subvoxel fat structures misclassified as nonadipose (14,15). Two-dimensional segmentation methods do not use information from neighboring sections, depending entirely on the information and image quality available in single sections. This leads to segmentation errors, especially in the presence of artifacts or morphologically complex fat structures such as adipose tissue enveloping visceral organs. When binary classification and two-dimensional segmentation are combined, these problems are magnified. In addition, none of these automated and semiautomated methods incorporate hepatic fat quantification and thus do not address this important manifestation of obesity.
To alleviate these problems, a commercial semiautomated image analysis method has been developed (AMRA Profiler; Advanced MR Analytics, Linköping, Sweden [19–23]), that uses quantitative fat and water separation to integrate the total fat signal intensity in a compartment of interest, thereby avoiding partial volume effects at interfaces and within voxels containing subvoxel fat. In addition, this method involves a three-dimensional approach to improve the robustness of the segmentation. Finally, this method incorporates estimation of hepatic proton density fat fraction (PDFF) by including a confounder-corrected, chemical shift–encoded sequence through the liver.
The primary aim of this study was to assess the repeatability and accuracy of this three-dimensional quantitative fat imaging–based method to estimate abdominal SCAT, VAT, total abdominal adipose tissue (TAT, the sum of SCAT and VAT) and thigh muscle volumes by using manual segmentation as a reference. A secondary aim of this study was to confirm the repeatability and, by using MR spectroscopy as the reference, accuracy of the included hepatic PDFF estimation sequence.
Materials and Methods
Collaboration and Financial Support
Financial support for this study was provided by Pfizer Pharmaceuticals (New York, NY). None of the authors were employees of or consultants for Pfizer Pharmaceuticals. In addition, Advanced MR Analytics, or AMRA, provided in-kind support by performing some of the analyses for the study in a blinded fashion. Four coauthors of this article are employees of AMRA. Coauthors who are not employees of or consultants for AMRA had control of inclusion of all data and information submitted for publication.
Study Design
This was a single-site, prospective, cross-sectional, observational study approved by our institutional review board. Subjects were recruited at the University of California, San Diego, Nonalcoholic Fatty Liver Disease Translational Research Unit. Target enrollment was 20 subjects, based largely on feasibility. All study subjects were known or suspected to have nonalcoholic fatty liver disease. All subjects provided written informed consent and Health Insurance Portability and Accountability Act–compliant authorization for access to personal health information. Subject demographics were recorded, and body mass indexes were measured. Inclusion criteria were age of 18 years or older and willingness and ability to complete all research procedures. The exclusion criterion was contraindication to MR imaging.
MR Imaging Examination Workflow
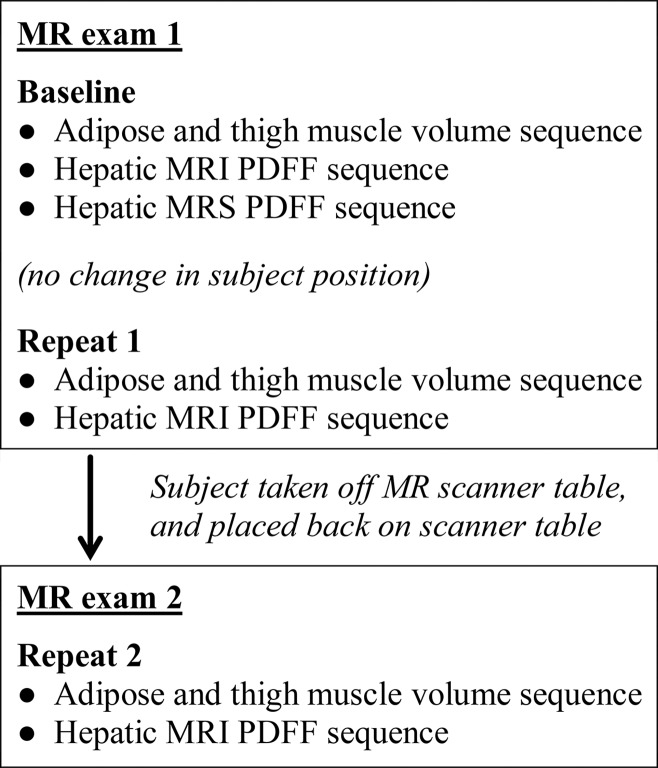
A schematic of the imaging workflow is shown in Figure 1. Two unenhanced MR imaging examinations, each less than 20 minutes long, were performed per subject. To address the primary aim, in the first MR imaging examination the adipose tissue and thigh muscle volume sequence was performed twice (ie, baseline and repeat 1) in immediate succession without repositioning the subject on the table. Then, the subject was taken off the table, placed back on the table after a 10-minute interval, and the same sequence was performed again during this second MR imaging examination (ie, repeat 2). Hence, the adipose and thigh muscle volume sequence was performed a total of three times for each subject.
Figure 1:
Schematic shows workflow for MR imaging examinations. MRS = MR spectroscopy.
MR Image Acquisition
Subjects were imaged in the supine position with a 3-T MR imager (GE Signa EXCITE HDxt; GE Medical Systems, Milwaukee, Wis) by one of two MR imaging technologists (nonauthors, both with more than 10 years of experience). For any given subject, the MR imaging technologist was the same for both examinations. The body coil was used for all study sequences.
A commercially available water- and fat-separation sequence to estimate abdominal adipose tissue and thigh muscle volume was implemented as a dual-echo, T1-weighted, three-dimensional spoiled gradient-recalled-echo axial acquisition, with parameters listed in Table 1. Six overlapping image stacks were obtained in approximately 6 minutes from the base of the skull to the knees. Use of the body coil for all image stacks simplified image acquisition and ensured homogeneous signal intensity throughout acquired images. The top stack (base of skull to shoulders, 86 sections) and the bottom two stacks (thighs and knees, each 86 sections) were acquired during free-breathing sequences of approximately 29 seconds; the other three stacks (including the thorax, abdomen, and pelvis; each 50 sections) were acquired during separate breath-hold acquisitions of 18–27 seconds. To reduce total acquisition time, pre-imaging parameters were calibrated for the top stack and kept fixed for all subsequent stacks. In the rare instances when clipping (which manifests as uniformly high signal intensity in the background) was observed in a lower stack, the technologist repeated the stack acquisition with lower receiver gain.
Table 1.
MR Imaging Examination Acquisition Parameters
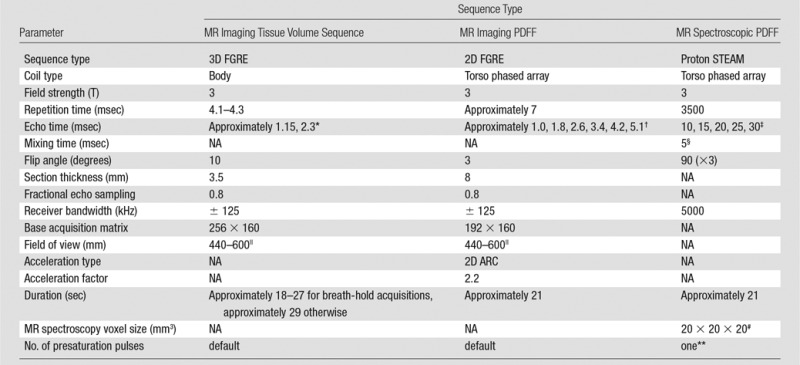
Note.—FGRE = fast gradient-recalled echo, 2D = two dimensional, 3D = three-dimensional, ARC = autocalibrating reconstruction for cartesian imaging, IDEAL-IQ = iterative decomposition of water and fat with echo asymmetry and least-squares estimation, NA = not applicable, STEAM = stimulated-echo acquisition mode
*For each acquisition, the two echoes were nominally out of phase and in phase.
†The exact repetition times and the exact echo times depend on the field of view, and hence, were not constant among all participants.
‡This range of echo times permitted reliable T2 estimation while minimizing confounding effects of fat-peak J coupling.
§To minimize both J coupling and T1 weighting.
||Adjusted to habitus and subject breath-hold capability.
#Selected in right lobe of liver, away from vessels, bile ducts, liver edges, and any artifact.
**To balance T1 saturation on subsequent excitations.
To estimate hepatic MR imaging PDFF, axial images were acquired of the entire liver by using a multigradient-echo confounder-corrected chemical shift-encoded sequence with hybrid reconstruction known as iterative decomposition of water and fat with echo asymmetry and least-squares estimation, or IDEAL-IQ (24). Each acquisition produced water, fat, and PDFF map images. Parameters are listed in Table 1.
MR Spectroscopy Acquisition
Stimulated-echo acquisition mode, or STEAM, MR spectroscopic spectra of the liver were obtained to provide reference PDFFs for MR imaging PDFF estimates. Avoiding major vessels, bile ducts, and liver margins, a single 20 × 20 × 20 mm3 voxel was placed in the right hepatic lobe for the first MR spectroscopic acquisition of the first MR imaging examination. The MR spectroscopic voxel was shimmed automatically, and its location was overlaid on the corresponding axial localization images and saved for imaging-spectroscopy colocalization. Spectra were acquired by using parameters selected to minimize T1 weighting and to permit reliable T2 estimation while minimizing confounding effects of fat-peak J coupling (Table 1). No water, fat, or spatial saturation was applied. Signals recorded at eight array elements were combined by means of singular value decomposition and were saved for offline analysis (25).
Image Reconstruction and Composite Image Stack Creation
Acquired image stacks were reconstructed offline and converted to water- and fat-separated images by using a custom three-dimensional extension of the method described for phase-sensitive image reconstruction (26,27). The converted image stacks were automatically calibrated by using adipose tissue as internal signal intensity reference, where pure adipose tissue has unit value and absence of adipose tissue has zero value. This calibration allows for volumetric fat quantification while avoiding partial volume effects at interfaces by integrating the total fat signal intensity within selected compartments (21,28). The calibrated image stacks were then merged into a single composite image stack by using the imager coordinates and a linear blending of the overlapping images to create a smooth, seamless transition between image stacks.
Semiautomated Image Segmentation, Image Selection, and Analysis
Each composite image stack (baseline and repeats 1 and 2) was segmented into its SCAT, VAT, TAT, and thigh muscle compartments, as described previously (19–23). This was done by using a three-dimensional, nonrigid, multi-atlas segmentation method. Sixteen atlases, where the SCAT, VAT, and thigh muscle compartments had previously been labeled manually, were registered to the image volumes. The atlas library consisted of five women and 11 men with the following characteristics: mean age, 41.8 years (range, 28.0–54.9 years); mean weight, 88.3 kg (range, 45.0–134 kg); mean height, 176 cm (range, 151–192 cm); mean body mass index, 28.4 kg/m2 (range, 19.7–46.4 kg/m2). A voting scheme was then used to combine the 16 field labels into a three-dimensional segmentation of each compartment. SCAT was defined as adipose tissue outside the abdominal wall, while VAT was defined as all adipose tissue within the abdominal cavity; lipid-containing tissue within the abdominal wall was not included in either compartment. Thigh muscles were defined as gluteus, iliacus, adductor, hamstring, quadriceps femoris, and sartorius. Depending on the subject, a volume comprising 190–248 images was segmented for each repeated acquisition, giving a total of 570–744 segmented images per subject. After segmentation, an AMRA analyst (nonauthor, with 1.5 years of experience) reviewed the segmented volumes and manually corrected the segmentations where required on the basis of visual image assessment. To set the upper and lower bounds defining abdominal SCAT, the analyst identified the top of the T9 vertebral body and the top of the femoral head. Final three-dimensional segmentations of the abdominal SCAT, VAT, TAT, and thigh muscle compartments were generated, and the computed fat volumes within the bounded anatomic regions were recorded. Lean muscle volume was computed by subtracting the integrated fat volume under the muscle label mask from the volume of the mask (22,23). Total time for the segmentation and analysis was less than 10 minutes per whole-body acquisition. Sample coronal, sagittal, and axial reconstructions of the segmented image stacks for each acquisition are shown in Figure 2.
Figure 2:
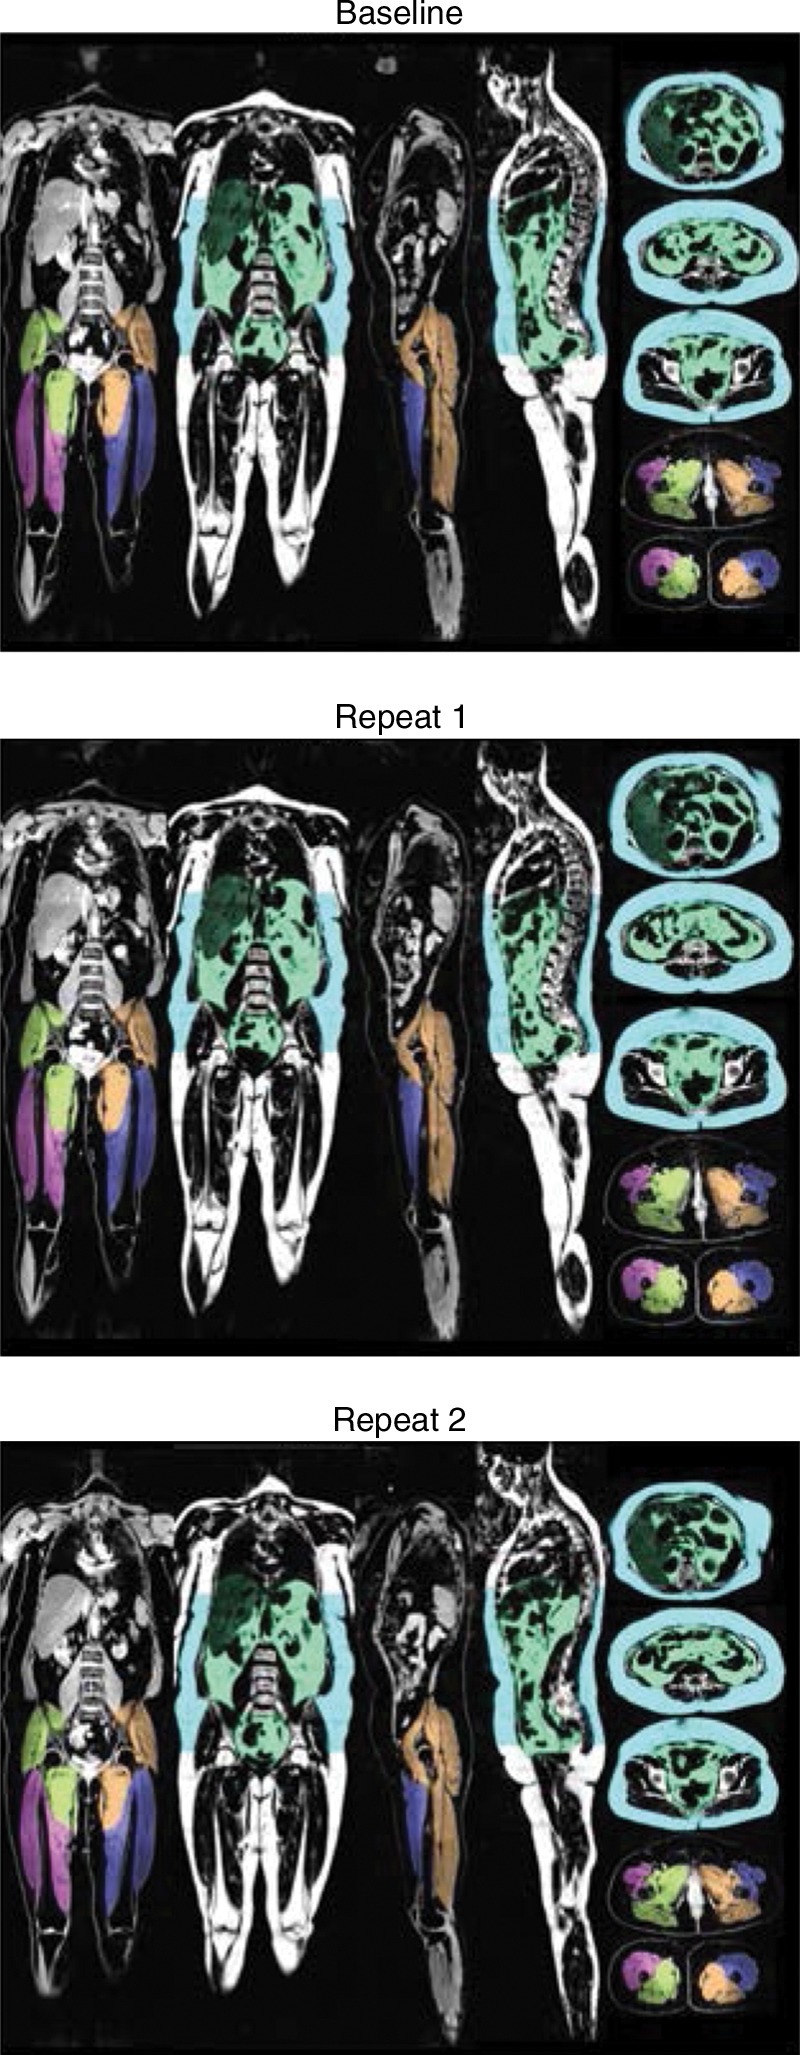
Coronal, sagittal, and axial reconstructions of segmented image stacks for each acquisition (baseline and repeats 1 and 2). SCAT (blue) volume was measured superiorly from T9 to top of the femoral head by using the semiautomated method. VAT (green) and thigh muscle volumes were measured in their entirety. Left anterior, left posterior, right anterior, and right posterior muscle groups are color coded for clarity.
A subset of 20 images obtained in the first acquisition (baseline) for each subject was selected for assessment of volume estimation accuracy. Of the 20 images, 15 were selected so that five covered the upper abdomen; five, the lower abdomen; and five, the pelvis; abdominal SCAT, VAT, and TAT volumes in these images were recorded. The remaining five images covered the thighs; thigh muscle volumes in these five images were recorded. The only consideration in selecting the 20 images were that images included the specified anatomic locations (ie, upper abdomen, lower abdomen, pelvis, and thigh muscles), and that major artifacts be avoided. These 20 sections also were segmented manually and analyzed as described in the sections that follow.
Manual Image Segmentation and Analysis
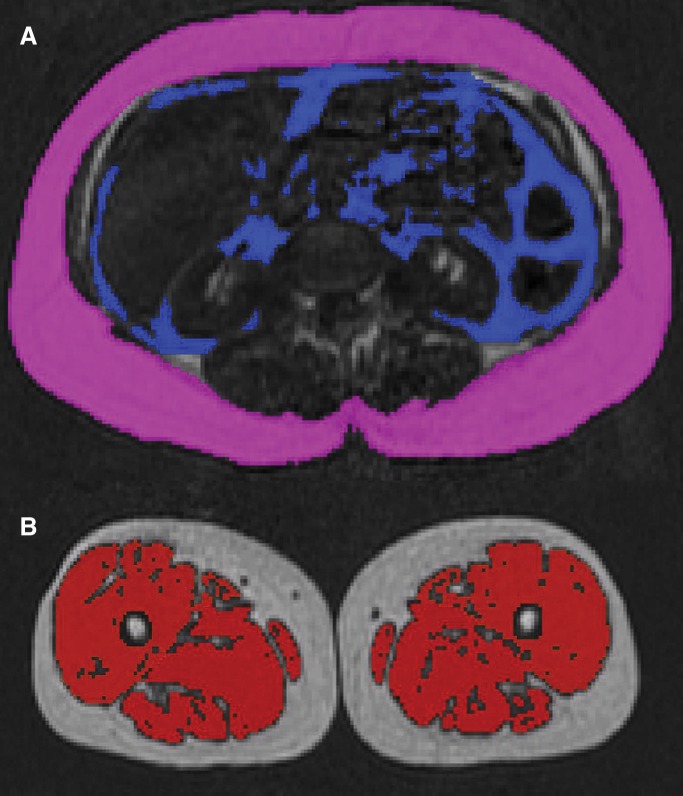
The 20 images were segmented manually by analysts from the University of California, San Diego (J.H. and W.H., each with more than 1 year of experience) by using a software package (Sliceomatic; Tomovision, Magog, Canada). VAT and SCAT compartments were segmented on the first 15 images, and the thigh muscles were segmented on the other five images (Fig 3). Volumes of these compartments were recorded and served as the reference standard for abdominal adipose tissue and thigh muscle volume accuracy analyses.
Figure 3:
Axial MR images show manual segmentation, A, abdominal SCAT (pink) and VAT (purple); and, B, thigh muscle (red).
MR Imaging and MR Spectroscopic PDFF Analysis
Hepatic MR imaging PDFF was assessed for accuracy (baseline only) and intra- and interexamination repeatability (baseline and repeats 1 and 2) by placing a 20 × 20 × 20 mm3 region of interest on the water and fat MR images at a position corresponding to the (baseline) MR spectroscopic voxel location. The position of the region of interest was, if needed, slightly adjusted by the analyst to avoid regions of artifacts or vessels after inspection in a three-plane viewer. The mean value of pixels included in the region of interest was recorded as the estimated hepatic MR imaging PDFF value.
MR spectroscopic water (4.7 ppm) and fat (2.1, 1.3, 0.9 ppm) peaks were modeled as Gaussian resonances and measured. Non-linear least-square fitting was used to calculate spectral peak T2 values and T2-corrected peak areas. Fat peaks at 4.2 and 5.3 ppm, obscured by the water peak and not visible at in vivo field strengths in human liver were estimated from visible fat peaks on the basis of the known biochemical structure of human liver triglycerides (29). MR spectroscopic PDFF was calculated as the integrated sum of T2-corrected fat peaks divided by the sum of T2-corrected fat and water peaks.
Blinding
The AMRA analyst, who supervised the semiautomated whole-body segmentations, and the University of California, San Diego analysts, who performed the manual segmentations of the 20 selected sections, were blinded to each other’s segmentations and results. Both sets of results were sent independently to a third author (M.S.M., with 17 years of experience), who then locked the study database before the statistical analyses were performed.
Statistical Analysis
Statistical analyses were performed by a staff statistician under the supervision of a faculty statistician (T.W. and A.G., respectively, both with more than 20 years of experience). Cohort population variables (age, sex, and body mass index) were summarized. For the 20 selected images for assessment of tissue volume accuracy, tissue volume estimates determined by using the semiautomated analysis method and reference tissue volume measurements determined by using the manual method were summarized.
Intra- (between baseline and repeat 1) and interexamination (between baseline and repeat 2) repeatability of abdominal SCAT, VAT, and TAT volume, and thigh muscle volume for the semiautomated analysis method were assessed by using the following metrics: the Bland-Altman bias (the mean of the differences between the two estimates), standard deviation (SD) of those differences, 95% limits of agreement (LOA = bias ± 1.96 SD, where LOA is limits of agreement), intraclass correlation coefficient (ICC) and its 95% confidence interval, and coefficient of variation for paired data (square root of the average of individual variances divided by the overall mean). Trends were assessed with correlation analysis and P values were computed.
Tissue volume accuracy for the semiautomated analysis method was assessed by using regression analysis. Each of the estimated tissue volume measures (abdominal SCAT, VAT, and TAT, and thigh muscle) obtained by means of the semiautomated analysis method was used as a single predictor in a univariate linear regression predicting its reference standard (corresponding manually determined volumes). From each regression, four metrics were obtained: the intercept of the regression line, the slope of the regression line, the average bias of the regression (defined as the square root of the average squared difference between the regression line and the x = y identity line), and the R2 of the regression model. Bootstrap-based confidence intervals were constructed around each of the accuracy metrics. Bootstrap-based P values for comparing the regression slope and intercept to the identity line slope and intercept were computed. Intra- and interexamination repeatability for hepatic MR imaging PDFF were assessed by using the same metrics as those described previously. Accuracy of the hepatic MR imaging PDFF relative to MR spectroscopic PDFF was assessed by using linear regression analysis as described previously.
Results
Twenty subjects (18 women and two men; mean age, 50.1 years [range, 25–76 years], mean body mass index, 28.3 kg/m2 [range, 19.3–43.9 kg/m2]) were recruited between July and November 2014. All recruited subjects met screening criteria and were enrolled in this study. Cohort characteristics are summarized in Table 2. Subjects ranged widely in anthropometric characteristics (body mass index, compartment volume) and hepatic PDFF.
Table 2.
Population and Cohort Characteristics

Note.—Unless otherwise indicated, data are mean ± SD, with the range in parentheses. Volume and PDFF measurements from the three acquisitions were averaged for each subject. PDFF was estimated by means of confounder-corrected, chemical shift-encoded MR imaging.
*Data are number of patients, with percentage in parentheses.
Assessment of Volume Estimation Repeatability and Accuracy
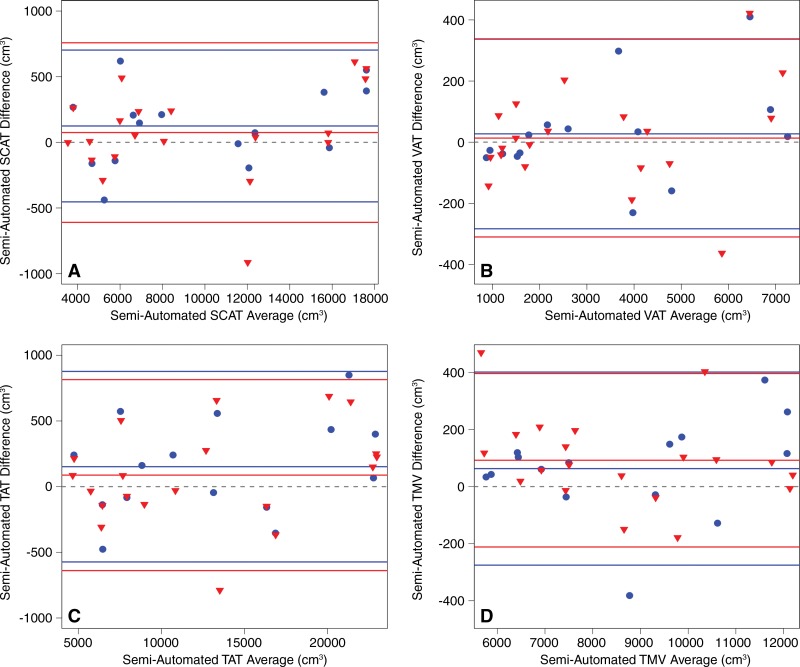
Intra- and interexamination volume estimation repeatability based on all images in the selected composite image stacks are summarized in Table 3.Intra- and interexamination ICCs ranged from 0.996 to 0.998, and coefficients of variation ranged from 1.5% to 3.6%. Bland-Altman plots show that intra- and interexamination differences and 95% limits of agreement were small relative to measure volumes (Fig 4). There was no significant association between the difference and the average in any Bland-Altman intra- or interexamination plots (intraexamination, P = .233, .187, .250, and .306; interexamination, P = .304, .358, .217, and .210 for SCAT, VAT, TAT, and thigh muscle volumes, respectively).
Table 3.
Semiautomated Abdominal Adipose and Thigh Muscle Volume Intra- and Interexamination Repeatability
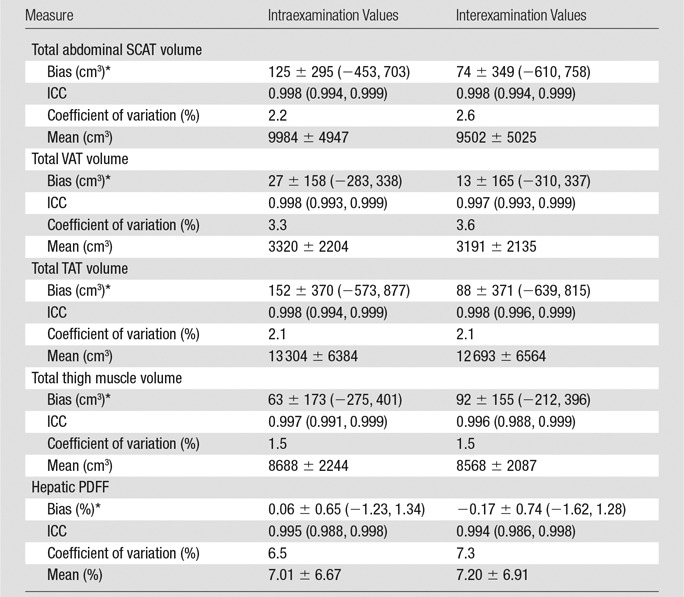
Note.—Unless otherwise indicated, data in parentheses are 95% confidence intervals. Means are the mean of the average of two intra- or interexamination measurement sets of values ± SD.
*Values for bias are ± SD, with 95% limits of agreement in parentheses.
Figure 4:
Bland-Altman plots for intraexamination (blue circle) and interexamination (red triangle) repeatability of semiautomated analysis method–determined volume estimates, respectively, for, A, abdominal SCAT; B, abdominal VAT; C, TAT; and, D, thigh muscle volume ( TMV ). Intraexamination repeatability was evaluated by comparing baseline and repeat 1. Interexamination repeatability was evaluated by comparing baseline and repeat 3. Dashed gray line for each case represents zero bias. Central solid line is at bias level for each case, and upper and lower lines are 95% limits of agreement. Note that, for each compartment, intra- and interexamination results are similar. Bland-Altman metrics are summarized in Table 3.
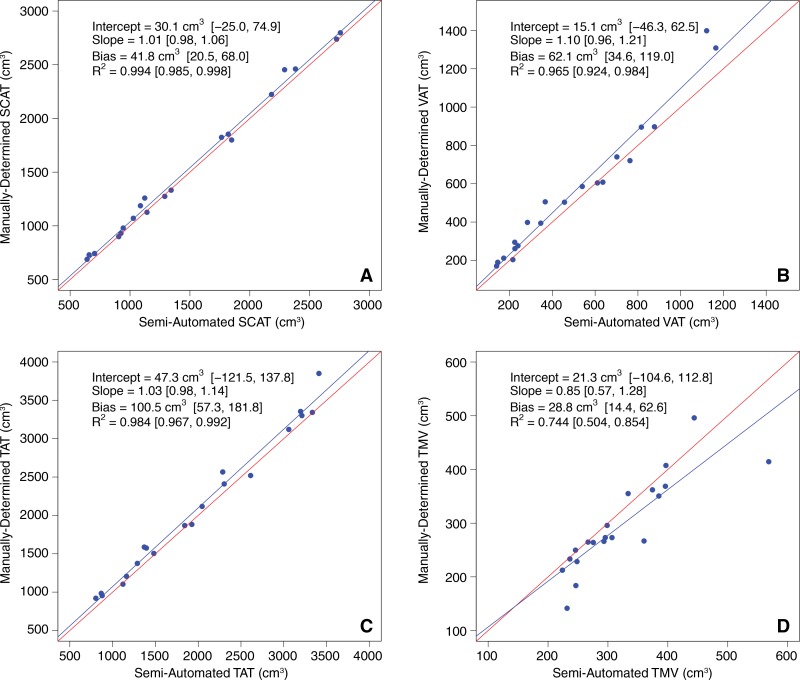
Manually determined and semiautomated method–determined tissue volumes in the selected subsets of 20 images are summarized in Table 4. Regression scatterplots and all accuracy metrics are presented in Figure 5. Abdominal SCAT, VAT, TAT, and thigh muscle semiautomated estimated volumes for the 20 selected images for each subject were close to the corresponding manually determined reference measurements. Neither the slopes nor the intercepts of the regression lines were significantly different from those of the corresponding identity lines (slope, P = .33, .16, .29, and .27; intercept, P = .25, .62, .51, and .70; for SCAT, VAT, TAT, thigh muscle volumes, respectively). Regression bias was positive in all cases, ranging from 28.8 cm3 to 100.5 cm3, indicating slight underestimation according to results with the use of the semiautomated method compared with the manually determined reference measurements.
Table 4.
Manually Determined and Semiautomated Method–determined Volume and PDFF Estimates (20 Selected Sections)

Note.—Data shown are mean ± SD with ranges in parentheses. SCAT, VAT, and TAT volumes were calculated in 15 selected sections each, thigh muscle volumes were calculated in five selected sections.
Figure 5:
Regression plots of manually determined versus semiautomated tissue volumes for, A, SCAT; B, VAT; C, TAT; and D, thigh muscle volume ( TMV ). Semiautomated estimates (predictors) are plotted on x-axes. Manually determined measurements (reference standards) are plotted on y-axes. Red line in each plot is identity line.
Assessment of PDFF Repeatability and Accuracy
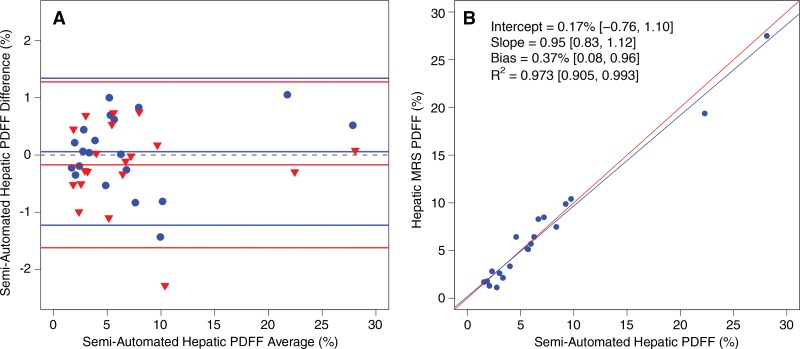
Values for intra- and interexamination hepatic MR imaging PDFF estimation repeatability are summarized in Table 3 and presented in Figure 6, A. ICCs were 0.995 and 0.994, and coefficients of variation were 6.5% and 7.3%, for intra- and interexamination repeatability, respectively. There was no significant association between the difference and the average in the Bland-Altman intraexamination (P = .388) or interexamination (P = .937) plot. Reference hepatic MR spectroscopic PDFF and semiautomated method–determined hepatic MR imaging PDFF values are summarized in Table 4. A regression scatterplot with all accuracy metrics is presented in Figure 6, B. Neither the slope nor the intercept of the regression line were significantly different from those of the identity line (slope, P = .27; intercept, P = .59).
Figure 6:
A, Bland-Altman plot for intraexamination (blue circles) and interexamination (red triangles) repeatability of semiautomated analysis method–estimated hepatic PDFF and, B, regression plot of MR spectroscopy versus semiautomated hepatic PDFF. Semiautomated PDFF (the predictor) is plotted on x-axis. MR spectroscopic PDFF (reference standard) is plotted on y-axis. Red line is identity line. Bland-Altman metrics are summarized in Table 3.
Discussion
In this prospective, cross-sectional study of adults with variable anthropometric characteristics, a semiautomated MR imaging analysis method provides very good intra- and interexamination repeatability and accuracy of adipose and muscle tissue volumes and PDFF. Tissue volume intra- and interexamination ICCs and coefficients of variation ranged from 0.986 to 0.998 and 1.5%–3.6%, respectively. By using manual segmentation in a subset of images as the reference standard, neither the slope nor the intercept of the regression lines were significantly different from identity lines for any of the assessed measures. A consistent, small, and probably clinically nonmeaningful underestimation of tissue volumes with the semiautomated analysis method was noted relative to the manual method. The hepatic MR imaging PDFF measurements also were found to be repeatable and, with MR spectroscopic PDFF as the reference standard, accurate.
Authors of prior studies (2–18) have assessed abdominal SCAT, VAT, TAT, and thigh muscle volumes by using manual, semiautomated, and automated methods. However, most investigators who used prior methods have used two-dimensional segmentation, which can introduce quantification errors, and most have relied on signal intensity threshold–based binary classification, which can cause fat volume underestimation due to partial volume effects at tissue interfaces. Moreover, none have combined these tissue volumes and hepatic PDFF estimation in one package. In this study, volumes comprising up to 248 individual images were successfully segmented in less than 10 minutes, with included estimation of hepatic PDFF. The main implication of this study is that repeatability and accuracy of tissue volume estimation has now been assessed prospectively for a commercially available, semiautomated analysis method. Current and future clinical and drug development studies may benefit from this method, as may practitioners in clinical settings where monitoring change in these measures is desired. In addition, the high repeatability and accuracy of the hepatic MR imaging PDFF estimation sequence further supports ongoing efforts to qualify hepatic MR imaging PDFF as a biomarker of hepatic steatosis and helps to justify the incorporation of PDFF estimation in this semiautomated software package.
One limitation of this study was that only a single 3-T MR imager from a single manufacturer was used; thus, reproducibility in different types of imagers was not assessed in this study. However, Karlsson et al (20) previously reported good reproducibility between 1.5-T and 3-T imagers by using the proposed method for tissue compartment volume measurements. In addition, Artz et al (30) reported good interfield-strength reproducibility for the incorporated PDFF estimation technique. The study sample consisted of 20 subjects, with the sample size determined according to feasibility rather than by means of an a priori power analysis. This was a limitation, because we potentially were underpowered to formally answer questions of accuracy. However, this sample size allowed an estimate of variability of the measures of interest, which in turn permitted preliminary assessment of performance. Nearly all subjects (18 of 20) were women. Recruitment was consecutive, and all potential subjects who were offered participation in this study were successfully enrolled; hence, there was no enrollment selection bias in the design, although there was an unintended majority of women included. The preferential inclusion of women in this study was unlikely to affect results, because subjects reflected a wide range of age, body mass index, and other anthropometric characteristics, and study aims were limited to repeatability and accuracy, and not to a clinical endpoint. An additional limitation was that all subjects were adults. This was unavoidable, because the recruitment was from an adult clinic specializing in treatment of fatty livers. Future research should include men, women, and children with geographic, racial, and ethnic and health style diversity to verify the robustness of this method.
Another limitation was that accuracy was examined in only a subset of nonrandomly selected images, but accuracy was not the major endpoint, and accuracy of the semiautomated analysis method has been assessed in prior studies (20,23). Although we did not address intra- and interoperator repeatability in our evaluation of the semiautomated analysis method, minimal operator supervision is required for its performance, and high intra- and interreader agreement have been reported. Results of a recent study (23) included intra- and interoperator coefficients of variation of 1.6% and 1.4% for VAT and 1.1% and 1.2% for abdominal SCAT, respectively.
In summary, this study showed that intra- and interexamination repeatability and accuracy with the use of a semiautomated analysis method and manual volume measurement as the reference standard, are very good. Future studies might address ways to further develop, qualify, and validate semiautomated tissue volumes as possible biomarkers of clinical endpoints. The results of this study also confirmed the expected high repeatability and accuracy of hepatic PDFF estimation with the use of a semiautomated analysis method.
Advance in Knowledge
■ Abdominal adipose and thigh muscle tissue volumes estimated by using this method showed high repeatability, with intra- and interexamination intraclass correlation coefficients ranging from 0.996 to 0.998, coefficients of variation ranging from 1.5% to 3.6%, and high accuracy compared with reference manual analysis, with regression slopes and intercepts not different from the identity line (P > .05).
Implication for Patient Care
■ Current and future clinical and drug development studies may benefit from this semiautomated tissue volume and hepatic proton density fat fraction assessment MR imaging analysis method because there are many clinical settings in which monitoring these measures and changes in them may be desired.
Received March 12, 2016; revision requested May 6 and received November 27; accepted November 30; final version accepted December 20.
Study supported by Pfizer and by the National Institutes of Health (R01 DK088925).
Disclosures of Conflicts of Interest: M.S.M. Activities related to the present article: disclosed no relevant relationships. Activities not related to the present article: contracted work through university for Alexion, AstraZeneca, Bioclinica, Biomedical Systems, Bristol Myers Squibb, Galmed, GE, Genzyme, Gilead, Icon, Isis, Janssen, NuSirt, Pfizer, Profil, Sanofi, Shire, Siemens, Synageva, Takeda, and Viryoalscopics; grants from GE and Guerbet; patents pending, licensing, and royalties for University of California, San Diego. Other relationships: disclosed no relevant relationships. W.H. disclosed no relevant relationships. J.H. disclosed no relevant relationships. M.B. Activities related to the present article: disclosed no relevant relationships. Activities not related to the present article: stockholder of Advanced MR Analytics, patents issued. Other relationships: disclosed no relevant relationships. O.D.L. Activities related to the present article: employment with Advanced MR Analytics. Activities not related to the present article: stockholder for Advanced MR Analytics, patents issued. Other relationships: disclosed no relevant relationships. T.R. Activities related to the present article: work as project manager at Advanced MR Analytics. Activities not related to the present article: stockholder for Advanced MR Analytics. Other relationships: disclosed no relevant relationships. P.T. Activities related to the present article: disclosed no relevant relationships. Activities not related to the present article: disclosed no relevant relationships. Other relationships: disclosed no relevant relationships. G.H. disclosed no relevant relationships. T.W. disclosed no relevant relationships. A.G. disclosed no relevant relationships. R.L. disclosed no relevant relationships. C.B.S. disclosed no relevant relationships.
Abbreviations:
- ICC
- intraclass correlation coefficient
- PDFF
- proton density fat fraction
- SCAT
- subcutaneous adipose tissue
- SD
- standard deviation
- TAT
- total adipose tissue
- VAT
- visceral adipose tissue
References
- 1.Horan M, Gibney E, Molloy E, McAuliffe F. Methodologies to assess paediatric adiposity. Ir J Med Sci 2015;184(1):53–68. [DOI] [PubMed] [Google Scholar]
- 2.Springer F, Ehehalt S, Sommer J, et al. Predicting volumes of metabolically important whole-body adipose tissue compartments in overweight and obese adolescents by different MRI approaches and anthropometry. Eur J Radiol 2012;81(7):1488–1494. [DOI] [PubMed] [Google Scholar]
- 3.Hu HH, Chen J, Shen W. Segmentation and quantification of adipose tissue by magnetic resonance imaging. MAGMA 2016;29(2):259–276. [DOI] [PMC free article] [PubMed] [Google Scholar]
- 4.Valentin S, Yeates TD, Licka T, Elliott J. Inter-rater reliability of trunk muscle morphometric analysis. J Back Musculoskeletal Rehabil 2015;28(1):181–190. [DOI] [PMC free article] [PubMed] [Google Scholar]
- 5.Bonekamp S, Ghosh P, Crawford S, et al. Quantitative comparison and evaluation of software packages for assessment of abdominal adipose tissue distribution by magnetic resonance imaging. Int J Obes 2008;32(1):100–111. [DOI] [PMC free article] [PubMed] [Google Scholar]
- 6.Brennan DD, Whelan PF, Robinson K, et al. Rapid automated measurement of body fat distribution from whole-body MRI. AJR Am J Roentgenol 2005;185(2):418–423. [DOI] [PubMed] [Google Scholar]
- 7.Kullberg J, Karlsson AK, Stokland E, Svensson PA, Dahlgren J. Adipose tissue distribution in children: automated quantification using water and fat MRI. J Magn Reson Imaging 2010;32(1):204–210. [DOI] [PubMed] [Google Scholar]
- 8.Würslin C, Machann J, Rempp H, Claussen C, Yang B, Schick F. Topography mapping of whole body adipose tissue using a fully automated and standardized procedure. J Magn Reson Imaging 2010;31(2):430–439. [DOI] [PubMed] [Google Scholar]
- 9.Müller HP, Raudies F, Unrath A, Neumann H, Ludolph AC, Kassubek J. Quantification of human body fat tissue percentage by MRI. NMR Biomed 2011;24(1):17–24. [DOI] [PubMed] [Google Scholar]
- 10.Wald D, Teucher B, Dinkel J, et al. Automatic quantification of subcutaneous and visceral adipose tissue from whole-body magnetic resonance images suitable for large cohort studies. J Magn Reson Imaging 2012;36(6):1421–1434. [DOI] [PubMed] [Google Scholar]
- 11.Poonawalla AH, Sjoberg BP, Rehm JL, et al. Adipose tissue MRI for quantitative measurement of central obesity. J Magn Reson Imaging 2013;37(3):707–716. [DOI] [PMC free article] [PubMed] [Google Scholar]
- 12.Thörmer G, Bertram HH, Garnov N, et al. Software for automated MRI-based quantification of abdominal fat and preliminary evaluation in morbidly obese patients. J Magn Reson Imaging 2013;37(5):1144–1150. [DOI] [PubMed] [Google Scholar]
- 13.Addeman BT, Kutty S, Perkins TG, et al. Validation of volumetric and single-slice MRI adipose analysis using a novel fully automated segmentation method. J Magn Reson Imaging 2015;41(1):233–241. [DOI] [PubMed] [Google Scholar]
- 14.Ludwig UA, Klausmann F, Baumann S, et al. Whole-body MRI-based fat quantification: a comparison to air displacement plethysmography. J Magn Reson Imaging 2014;40(6):1437–1444. [DOI] [PubMed] [Google Scholar]
- 15.Peng Q, McColl RW, Ding Y, Wang J, Chia JM, Weatherall PT. Automated method for accurate abdominal fat quantification on water-saturated magnetic resonance images. J Magn Reson Imaging 2007;26(3):738–746. [DOI] [PubMed] [Google Scholar]
- 16.Broderick BJ, Dessus S, Grace PA, Olaighin G. Technique for the computation of lower leg muscle bulk from magnetic resonance images. Med Eng Phys 2010;32(8):926–933. [DOI] [PubMed] [Google Scholar]
- 17.Brunner G, Nambi V, Yang E, et al. Automatic quantification of muscle volumes in magnetic resonance imaging scans of the lower extremities. Magn Reson Imaging 2011;29(8):1065–1075. [DOI] [PMC free article] [PubMed] [Google Scholar]
- 18.Baudin PY, Azzabou N, Carlier PG, Paragios N. Prior knowledge, random walks and human skeletal muscle segmentation. Med Image Comput Comput Assist Interv 2012;15(Pt 1):569–576. [DOI] [PubMed] [Google Scholar]
- 19.Thomas MS, Newman D, Leinhard OD, et al. Test-retest reliability of automated whole body and compartmental muscle volume measurements on a wide bore 3T MR system. Eur Radiol 2014;24(9):2279–2291. [DOI] [PubMed] [Google Scholar]
- 20.Karlsson A, Rosander J, Romu T, et al. Automatic and quantitative assessment of regional muscle volume by multi-atlas segmentation using whole-body water-fat MRI. J Magn Reson Imaging 2015;41(6):1558–1569. [DOI] [PubMed] [Google Scholar]
- 21.Andersson T, Romu T, Karlsson A, et al. Consistent intensity inhomogeneity correction in water-fat MRI. J Magn Reson Imaging 2015;42(2):468–476. [DOI] [PubMed] [Google Scholar]
- 22.Dahlqvist Leinhard O, Johansson A, Rydell J, et al. Quantitative abdominal fat estimation using MRI. Presented at the 2008 19th International Conference on Pattern Recognition. New York, NY: IEEE, 2008; 1–4. [Google Scholar]
- 23.Borga M, Thomas EL, Romu T, et al. Validation of a fast method for quantification of intra-abdominal and subcutaneous adipose tissue for large-scale human studies. NMR Biomed 2015;28(12):1747–1753. [DOI] [PubMed] [Google Scholar]
- 24.Meisamy S, Hines CD, Hamilton G, et al. Quantification of hepatic steatosis with T1-independent, T2-corrected MR imaging with spectral modeling of fat: blinded comparison with MR spectroscopy. Radiology 2011;258(3):767–775. [DOI] [PMC free article] [PubMed] [Google Scholar]
- 25.Bydder M, Hamilton G, Yokoo T, Sirlin CB. Optimal phased-array combination for spectroscopy. Magn Reson Imaging 2008;26(6):847–850. [DOI] [PMC free article] [PubMed] [Google Scholar]
- 26.Romu T, Dahlström N, Leinhard OD, Borga M. Robust water fat separated dual-echo MRI by phase-sensitive reconstruction. Magn Reson Med 2016 Oct 24. [Epub ahead of print] [DOI] [PubMed] [Google Scholar]
- 27.Rydell J, Knutsson H, Pettersson J, et al. Phase sensitive reconstruction for water/fat separation in MR imaging using inverse gradient. Presented at the International Conference on Medical Image Computing and Computer-Assisted Intervention. Berlin, Germany: Springer, 2007; 210–218. [DOI] [PubMed] [Google Scholar]
- 28.Peterson P, Romu T, Brorson H, Dahlqvist Leinhard O, Månsson S. Fat quantification in skeletal muscle using multigradient-echo imaging: Comparison of fat and water references. J Magn Reson Imaging 2016;43(1):203–212. [DOI] [PubMed] [Google Scholar]
- 29.Hamilton G, Yokoo T, Bydder M, et al. In vivo characterization of the liver fat 1H MR spectrum. NMR Biomed 2011;24(7):784–790. [DOI] [PMC free article] [PubMed] [Google Scholar]
- 30.Artz NS, Haufe WM, Hooker CA, et al. Reproducibility of MR-based liver fat quantification across field strength: Same-day comparison between 1.5T and 3T in obese subjects. J Magn Reson Imaging 2015;42(3):811–817. [DOI] [PMC free article] [PubMed] [Google Scholar]


