

Recurring genetic alterations in glioblastoma occur in three major pathways and result in changes in tumor cell behavior, which leads to induced angiogenesis, uncontrolled proliferation, abnormal invasion, and resistance to cell death, all of which affect the imaging appearance of glioblastomas.
Abstract
Glioblastoma is a highly malignant brain tumor that relentlessly defies therapy. Efforts over the past decade have begun to tease out the biochemical details that lead to its aggressive behavior and poor prognosis. There is hope that this new understanding will lead to improved treatment strategies for patients with glioblastoma, in the form of targeted, molecularly based therapies that are individualized to specific changes in individual tumors. However, these new therapies have the potential to fundamentally alter the biologic behavior of glioblastoma and, as a result, its imaging appearance. Knowledge about common genetic alterations and the resultant cellular and tissue changes (ie, induced angiogenesis and abnormal cell survival, proliferation, and invasion) in glioblastomas is important as a basis for understanding imaging findings before treatment. It is equally critical that radiologists understand which genetic pathway is targeted by each specific therapeutic agent or class of agents in order to accurately interpret changes in the imaging appearances of treated tumors.
© RSNA, 2011
Introduction
Over the past decade there have been significant advances in the way genetic alterations, gene expression, and biology of glioblastomas are understood. For radiologists, understanding the common genetic alterations (mutations, amplifications, and deletions), changes in gene expression, and resulting tumor biology are important for the following reasons: (a) imaging features of glioblastomas may correlate with gene expression, (b) imaging may provide a noninvasive technique to assess both spatial and temporal changes in gene expression, and (c) understanding the molecular and cellular changes that occur in glioblastomas is helpful in interpreting imaging findings in patients undergoing molecular-targeted therapies.
In this article, we discuss the common genetic alterations that are currently known to occur in glioblastoma and the emerging use of gene expression studies in classifying glioblastomas. We also describe four major changes that occur in glioblastomas: angiogenesis, abnormal cell proliferation, invasion, and abnormal cell survival, with a focus on both the radiologic and histopathologic features of these tumor properties (1).
Common Genetic Alterations in Glioblastomas
The common genetic alterations that occur in glioblastomas have been catalogued in recent studies by using data from the Cancer Genome Atlas Research Network; a typical glioblastoma harbors more than 60 genetic alterations (2–4). Nearly 90% of these alterations are mutations (including deletions), and the remaining 10% are chromosomal aberrations (amplifications) (Fig 1) (2).
Figure 1.

Genetic alterations in glioblastoma. Chart shows the common genetic alterations encountered in glioblastoma, which, on average, has over 60 genetic alterations, and the percentages of cases with genetic alterations of that gene. Red circles = genetic changes that are most commonly amplifications, blue circles = changes that are most commonly homozygous deletions, green circles = changes that are most commonly mutations. Brighter, lighter colored circles = more common genetic alterations. PI3K = phosphatidylinositol 3-kinase, PIK3R1 = phosphatidylinositol 3-kinase regulatory subunit, PIK3CA = phosphatidylinositol 3-kinase catalytic subunit, PTEN = phosphatase and tensin homolog, P53 = protein 53, CDKN2A = cyclin-dependent kinase inhibitor 2A, CDK4 = cyclin-dependent kinase 4, Rb1 = retinoblastoma 1, MDM2 = murine double minute 2, MDM4 = murine double minute 4, NF1 = neurofibromatosis 1, EGFR = epidermal growth factor receptor, PDGFR = platelet-derived growth factor receptor, TSC = tuberous sclerosis complex, mTOR = mammalian target of rapamycin, VEGF = vascular endothelial growth factor, IDH1 = isocitrate dehydrogenase 1.
Effects of Genetic Alterations in Signaling Pathways
Despite the large number of genetic alterations that may occur, the recurring genetic mutations, deletions, and amplifications that occur in glioblastomas affect genes that function in three major cellular pathways: the receptor tyrosine kinase (RTK)/phosphatase and tensin homolog (PTEN)/phosphatidylinositol 3-kinase (PI3K) cell proliferation signaling pathway; the p53 tumor suppression pathway; and the retinoblastoma 1 (Rb1) tumor suppression pathway (1,2). The majority of glioblastomas contain aberrations in all three major pathways (1,2).
RTK/PI3K/PTEN Signaling Pathway
The RTK/PI3K/PTEN signaling pathway is reported to be abnormal in more than 80% of glioblastomas (Fig 2) (2). The main cellular functions of this pathway are control of cell processes such as division, migration, and survival. These functions are accomplished by way of extracellular signals (eg, growth factors, cell adhesion, and contact with extracellular environment) that act on transmembrane receptors—such as epidermal growth factor receptor (EGFR), platelet-derived growth factor receptor (PDGFR), and integrins, which transmit signals through kinase-mediated phosphorylation. Alterations in this pathway may lead to autonomously increased downstream activity, which results in proangiogenic signaling and increased proliferation and survival of abnormal cells (1).
Figure 2.
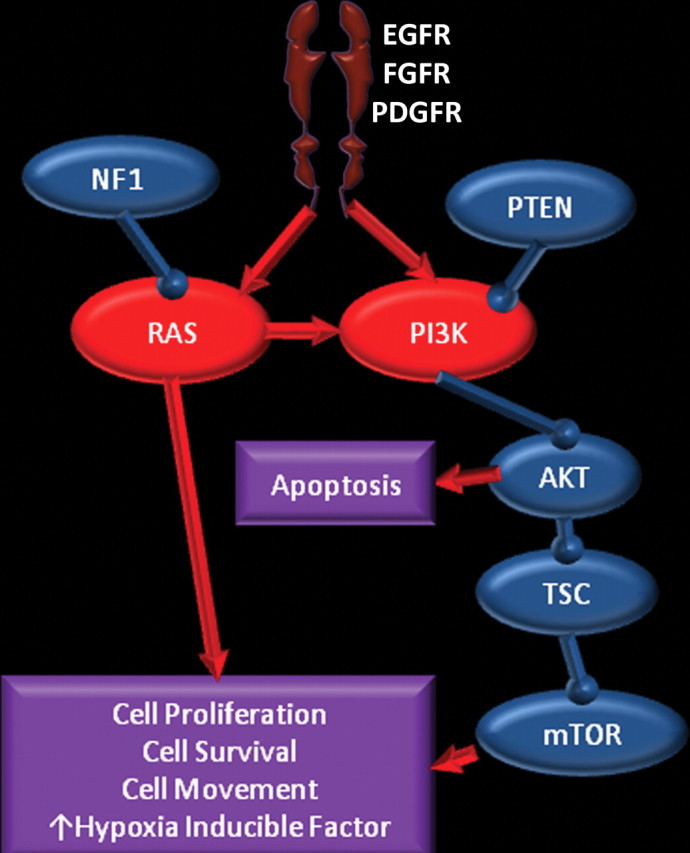
RTK/RAS/PI3K pathway. Chart shows the RTK/RAS/PI3K pathway, in which membrane receptors (such as EGFR, FGFR, and PDGFR) receive signals from growth factors, which results in activation of the RAS and PI3K pathways. Neurofibromatosis 1 (NF1) and PTEN are inhibitors of this pathway. Overexpression of receptors and immediate downstream products (eg, PI3K and RAS) or inactivation of the suppressors (eg, NF1 and PTEN) results in abnormal control of cell proliferation, survival, and migration, and an increase in hypoxia-inducible factor 1 alpha (HIF-1α), which stimulates angiogenesis. AKT = human homolog of Akt oncogene, TSC = tuberous sclerosis complex, FGFR = fibroblast growth factor receptor.
The common functional alterations in glioblastomas that may disrupt normal functioning of the RTK/PI3K/PTEN pathway are increased expression through amplification or mutation of key receptors such as EGFR and PDGFR; increased activity through amplification or mutation of the immediate downstream targets in PI3K and rat sarcoma viral oncogene homolog (RAS) pathways; and decreased activity through deletion or mutation of tumor suppressors such as PI3K and RAS inhibitors (ie, neurofibromatosis 1 and PTEN) and downstream suppressors such as tuberous sclerosis complex, mammalian target of rapamycin (mTOR), and p53. Ultimately, these genetic changes may lead to abnormal control of cellular proliferation, cell survival, and migration of glioblastoma cells, as well as increased levels of hypoxia-inducible factor 1 alpha (HIF-1α), a key component of cellular metabolism and angiogenesis (1,5).
p53 Tumor Suppression Pathway
The p53 tumor suppression pathway is inactivated in more than 80% of patients with glioblastoma (Fig 3) (2). When deoxyribonucleic acid (DNA) damage occurs in normal cells, p53 controls cell cycle progression by giving the cell time to repair DNA or by triggering apoptosis to eliminate the damaged cell. The p53 tumor suppression pathway is most commonly disrupted by a mutation or deletion of p53 itself (which occurs in 40% of glioblastomas) or by overexpression of p53 inhibitors such as murine double minute 2 (MDM2) (which may be caused by a direct genetic change or indirectly by deletions that affect cyclin-dependent kinase inhibitor 2A [CDKN2A], an MDM2 inhibitor) and murine double minute 4 (MDM4). CDKN2A is one of the most frequently altered genes in glioblastomas, with deletions occurring in approximately 50% of tumors (1).
Figure 3.
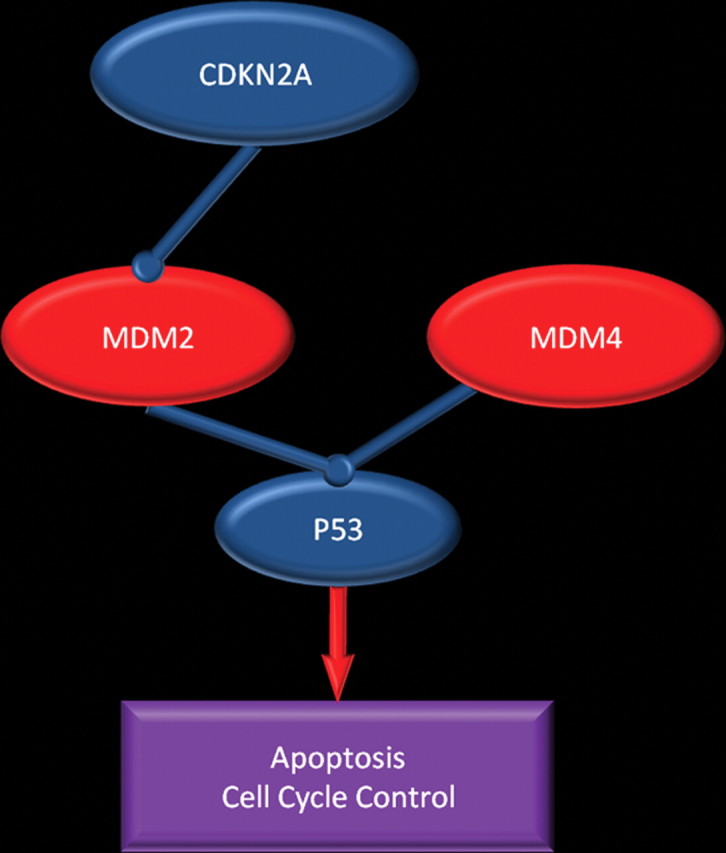
p53 pathway. Chart shows the pathway in which p53 directs cells to undergo apoptosis or stay senescent to allow DNA repair. This pathway may be disrupted in patients with glioblastoma in several ways: by mutation or deletion of p53; overexpression of p53 inhibitors (MDM2 and MDM4); overexpression of MDM2, a result of MDM2 gene amplification; and, indirectly, deletion of CDKN2A, an MDM2 inhibitor.
Rb1 Tumor Suppression Pathway
The Rb1 tumor suppression pathway is abnormal in more than 75% of patients with glioblastoma (Fig 4) (2). The Rb1 protein blocks cell cycle progression in quiescent cells; Rb1 pathway disruption may lead to unchecked cell cycle progression. In glioblastoma, the pathway may be disrupted by direct mutation of gene Rb1, which makes it ineffective, or through overexpression of cyclin-dependent kinase 4 (CDK4), which occurs either directly by way of amplification or, more commonly, by deletion of CDKN2A, which functions as an inhibitor of CDK4 (1).
Figure 4.
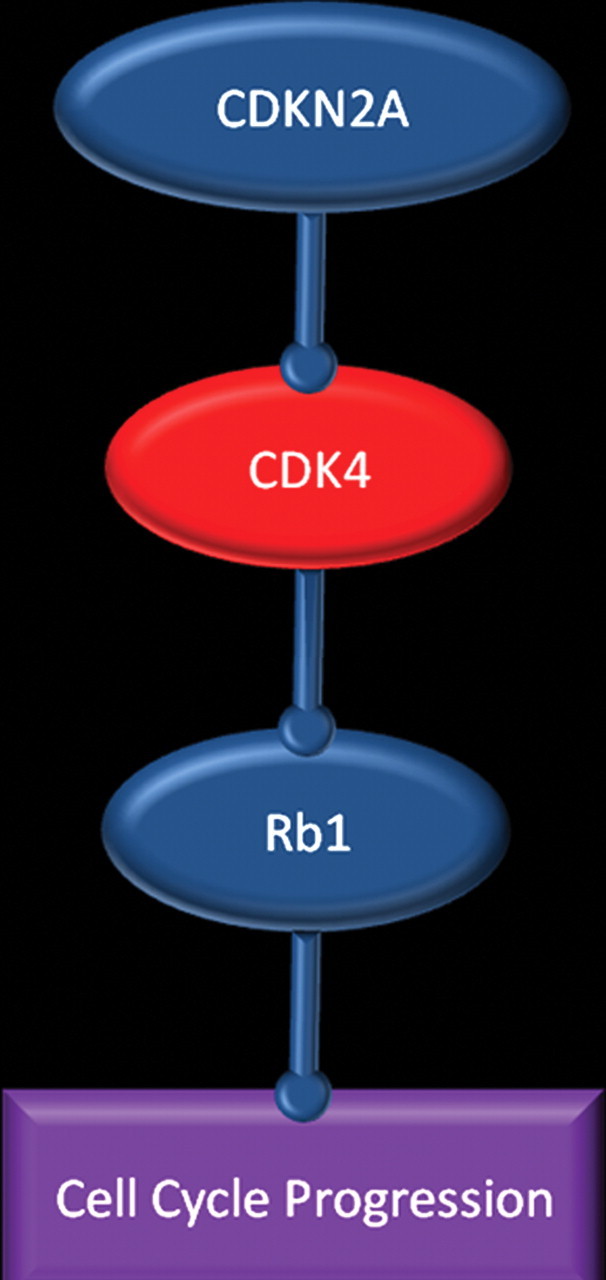
Rb1 pathway. Chart shows the pathway in which Rb1 protein blocks cell cycle progression. This pathway may be disrupted in patients with glioblastoma by direct mutation of Rb1, which makes it ineffective, or through overexpression of cyclin-dependent kinase 4 (CDK4), which occurs either directly or by deletion of CDKN2A, which inhibits CDK4.
Effects of Genetic Changes on Gene Expression and Tumor Biology
The effects of genetic alterations in glioblastoma are further enhanced by local factors such as pH level, hypoxia, hormones, growth factors, and other epigenetic factors, and they lead to changes in expression of the altered genes. As a result, both spatial and temporal variations in gene expression occur, which ultimately manifest in the tumor biology and are reflected in the heterogeneous imaging features and pathologic findings of glioblastoma. The changes in angiogenesis, cellular proliferation, cellular invasion, and cell survival and apoptosis that occur in patients with glioblastoma correlate with distinct imaging and pathologic features (Fig 5).
Figure 5.

Chart shows how imaging features of glioblastoma are a reflection of genetic changes. Genetic alterations are modified by local factors (pH, hypoxia, growth factors, and epigenetics) and result in changes in gene expression, which manifest as altered cell and tumor biology and are reflected in the imaging and pathologic appearances.
Classification of Glioblastomas
Traditionally, glioblastomas have been clinically classified as primary (ie, arising de novo as a glioblastoma) or secondary (ie, arising from a preexisting lower-grade glioma) (1,6). Several studies have reported distinct differences in the genetic alterations and gene expression patterns between primary and secondary glioblastomas (Table 1).More recently, there has been considerable interest in further categorizing glioblastomas on the basis of gene expression profiles to identify groups of tumors with similar tumor biology, prognosis, or response to therapy (7). In 2010, Verhaak et al (7) published a framework for classifying glioblastomas on the basis of gene expression (Table 2). They identified four subtypes: classic, mesenchymal, proneural, and neural. Although the three pathways that were discussed earlier were abnormal in most cases, the specific genetic alterations that produced the observed pathway abnormalities differed between subtypes. Furthermore, noticeable differences in treatment response and outcome were observed between the subtypes. There was no improvement in survival among patients with proneural glioblastoma who were heavily treated, whereas those with classic or mesenchymal disease who were heavily treated had improved survival (7). Further study of the influence of genetic alterations on the efficacy of a specific therapy may lead to the ability to tailor therapy on the basis of genetic changes and their resultant gene expression (ie, genetically informed, individualized therapy).
Table 1.
Characteristics of Primary and Secondary Glioblastomas
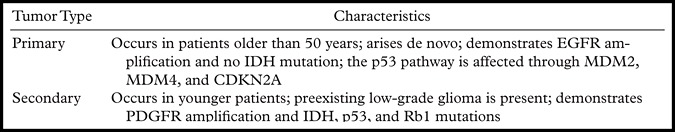
Note.—Clinically, primary glioblastoma is defined as a glioblastoma that arises de novo, whereas a secondary glioblastoma arises from a preexisting glioma. Genetic features are associated with each type of tumor, although there is overlap between the two groups. MDM4 = murine double minute 4, IDH = isocitrate dehydrogenase.
Table 2.
Classification of Glioblastomas on the Basis of Gene Expression
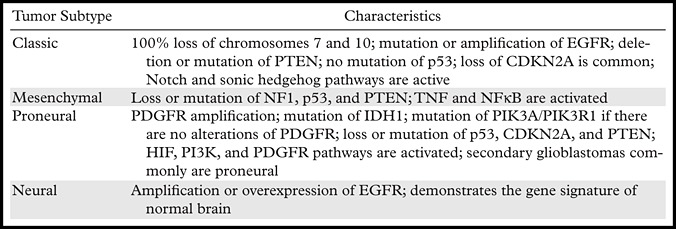
Note.—There has been considerable interest in classifying glioblastoma on the basis of gene expression. This classification system was developed by Verhaak et al (7) in 2010. PIK3R1 = phosphatidylinositol 3-kinase regulatory subunit, PIK3CA = phosphatidylinositol 3-kinase catalytic subunit, CDK4 = cyclin-dependent kinase 4, MDM4 = murine double minute 4, NF1 = neurofibromatosis 1, IDH1 = isocitrate dehydrogenase 1, TNF = tumor necrosis factor, NFêB = nuclear factor kappa of B cells.
Angiogenesis
Angiogenesis Pathway
Glioblastomas are among the most vascular tumors in humans, with angiogenesis a known hallmark of the transition from a lower-grade to a higher-grade glioma (5). HIF-1α and vascular endothelial growth factor-A (VEGF-A) are important molecules for the promotion of angiogenesis in glioblastoma (Fig 6). HIF-1α is a hypoxia-responsive DNA-binding protein that acts as a key regulator of molecular pathways (eg, angiogenesis) (8). Genetic changes in the PI3K pathway in glioblastoma (eg, in EGFR, PI3K, RAS, PTEN, neurofibromatosis type 1 [NF1], and PDGFR) may result in increased HIF-1α expression. Certain genetic alterations (eg, in EGFR, isocitrate dehydrogenase 1 [IDH1], and PTEN) also stabilize HIF-1α by decreasing its degradation. HIF-1α acts as a transcription factor to increase production of VEGF, a substance that may be important for tumors to switch from nonangiogenic to proangiogenic factor–driven growth (8). Local factors such as hypoxia, low intratumoral pH, inflammatory cytokines, and the presence of sex hormones and growth factors are also important in promoting angiogenesis by several mechanisms, including induction of the HIF-1α pathway.
Figure 6.
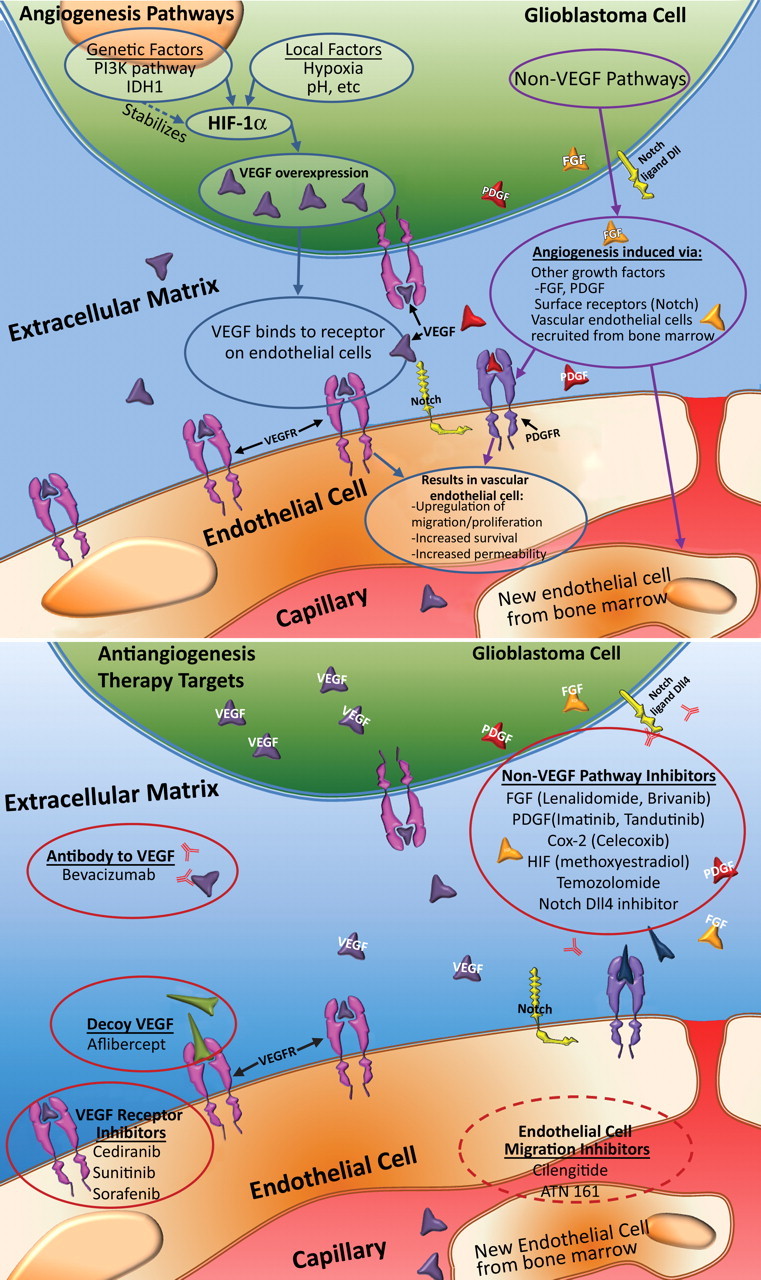
Angiogenesis in glioblastoma. Top illustration shows the cellular mechanisms involved in angiogenesis. The combination of genetic alterations and local factors results in increased HIF-1α and, ultimately, VEGF shown in purple, which diffuses out of glioblastoma cells to nearby VEGF receptors shown in pink (VEGFR) on capillary endothelial cells, a process that results in an increase in proliferation, migration, and survival of endothelial cells, as well as increased permeability. IDH1 = isocitrate dehydrogenase 1, HIF-1α = hypoxia-inducible factor 1α. Bottom illustration shows therapeutic targets in antiangiogenesis therapy. Numerous agents are currently being investigated for their antiangiogenic properties. These agents may be divided into those that directly affect the VEGF pathway, those that affect other pathways, and those that inhibit endothelial cell migration. FGF = fibroblast growth factor shown in orange, PDGF = platelet-derived growth factor shown in red.
VEGF-A is a diffusible molecule that is produced in glioblastoma cells and that binds to VEGF membrane receptors (eg, VEGFR), which are located on vascular endothelial cells. Overexpression of VEGF-A occurs in all types of glioblastoma, primarily in response to an increase in HIF-1α (1). Binding of VEGF to VEGFR in nearby capillary endothelial cells initiates a signaling cascade that results in enhanced migration and proliferation of endothelial cells, increased endothelial cell survival, and increased vascular permeability.
It is important to keep in mind that other non-VEGF pathways for angiogenesis—including the effects of other growth factors such as PDGF and fibroblast growth factor (FGF), interactions of surface receptors (eg, Notch), and the recruitment of endothelial stem cells from bone marrow—play a role in glioblastoma. These secondary pathways become more important when the primary VEGF pathway is blocked and likely contribute to the eventual decrease in effectiveness of current antiangiogenic therapies in patients with glioblastoma (9).
Angiogenic Switch
In normal tissue and low-grade gliomas, there is a balance between proangiogenic and antiangiogenic factors. At some point, a change in this balance occurs that causes a tumor to switch to a proangiogenic state (5). This change has been termed the angiogenic switch. It is believed that certain mutations in glioblastoma—such as those involving PTEN, IDH1, and EGFR—contribute to the angiogenic switch by helping to stabilize HIF-1α, which leads to increased transcription of VEGF. These factors help tip the balance of pro- and antiangiogenic factors in favor of angiogenesis (5).
Antiangiogenesis Therapy
There are three major strategies to antiangiogenesis therapy in patients with glioblastoma (Fig 6) (10,11). The first is to inhibit the VEGF pathway by targeting the VEGF molecules either with antibodies to VEGF (bevacizumab) or with a decoy VEGF (aflibercept). Another approach is direct inhibition of the receptor, VEGFR. Several drugs that inhibit VEGFR have been developed, including cediranib, sunitinib, and sorafenib (10). Antiangiogenesis therapy with bevacizumab is now approved for recurrent glioblastomas, with modest improvement in survival reported (11).
The second approach is to inhibit non-VEGF pathways. There are many non-VEGF pathway inhibitors that may have an effect on angiogenesis, including inhibitors of PDGF (imatinib and tandutinib), FGF (lenalidomide and brivanib), Cox 2 (celecoxib), HIF-1α (methoxyestradiol), and Notch, as well as temozolomide (10). The third approach is to inhibit vascular endothelial cell migration. Two drugs that are used for this purpose are cilengitide and ATN-161 (10).
Imaging Features of Angiogenesis
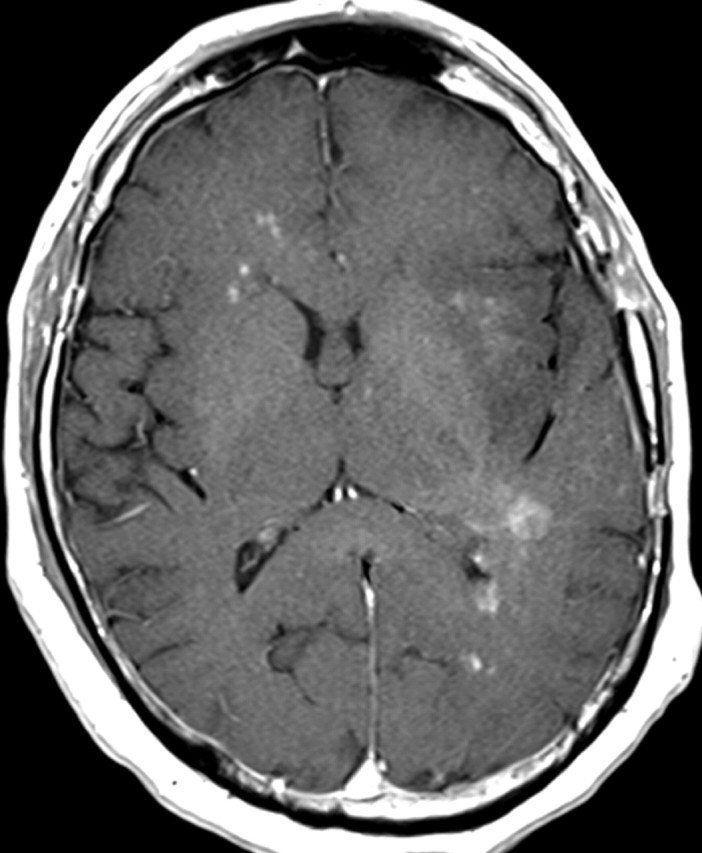
In glioblastoma, tumor-induced angiogenesis results in abundant leaky and inefficient vessels. The imaging features of angiogenesis include tumor enhancement and vasogenic edema. These changes are readily apparent on standard contrast-enhanced T1-weighted and fluid-attenuated inversion-recovery (FLAIR) or T2-weighted magnetic resonance (MR) images (Fig 7). At pathologic analysis, an increased number of vessels and proliferation of vascular endothelial cells are typical findings (Fig 8).
Recurrent glioblastoma in a 55-year-old man. (a) Axial FLAIR MR image shows an area of abnormal increased signal intensity, a finding consistent with vasogenic edema in the left parietal lobe. An area of relatively decreased signal intensity is seen around the trigone (arrow), a finding that corresponds with the more cellular portion of the tumor. (b) Axial gadolinium contrast material–enhanced T1-weighted MR image shows accompanying enhancement in the left parietal lobe. (c, d) FLAIR (c) and gadolinium contrast-enhanced T1-weighted (d) MR images obtained after the patient underwent 6 weeks of bevacizumab therapy show that both the enhancement and edema improved, a typical radiologic finding after antiangiogenesis therapy.
Figure 7a.
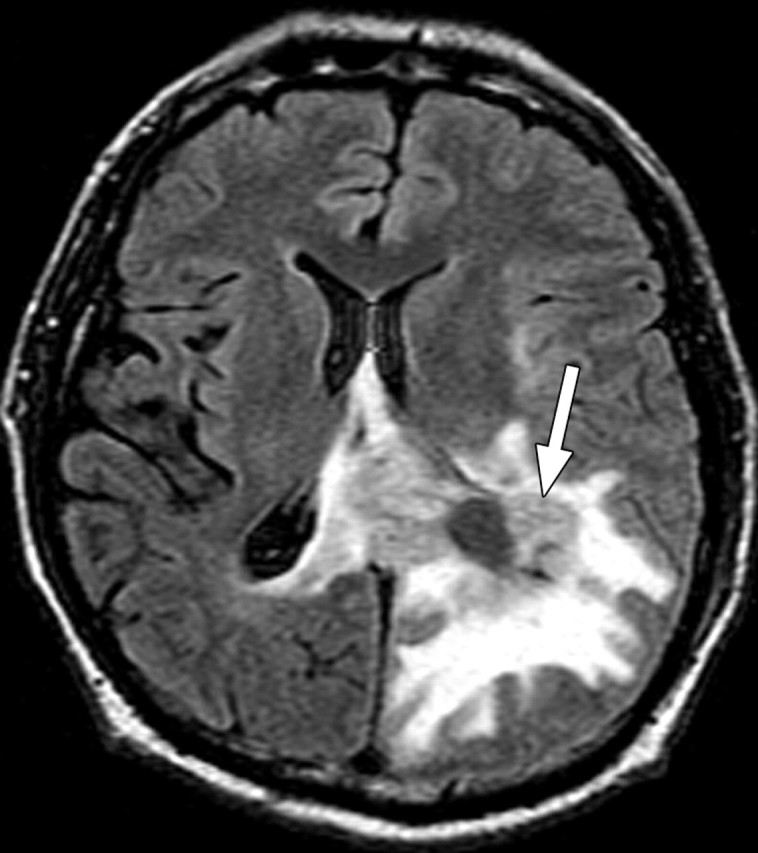
Figure 7b.
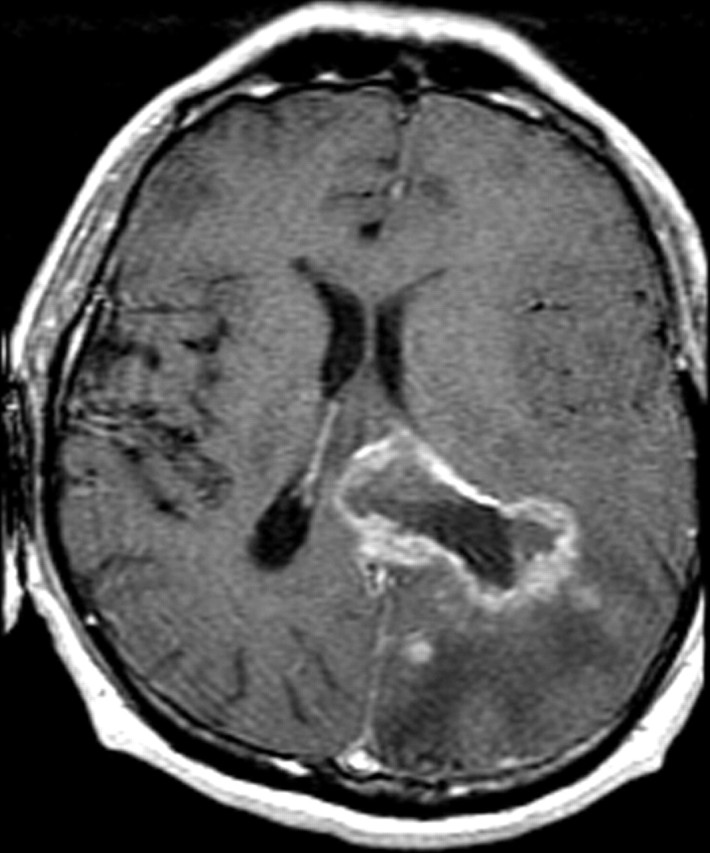
Figure 7c.
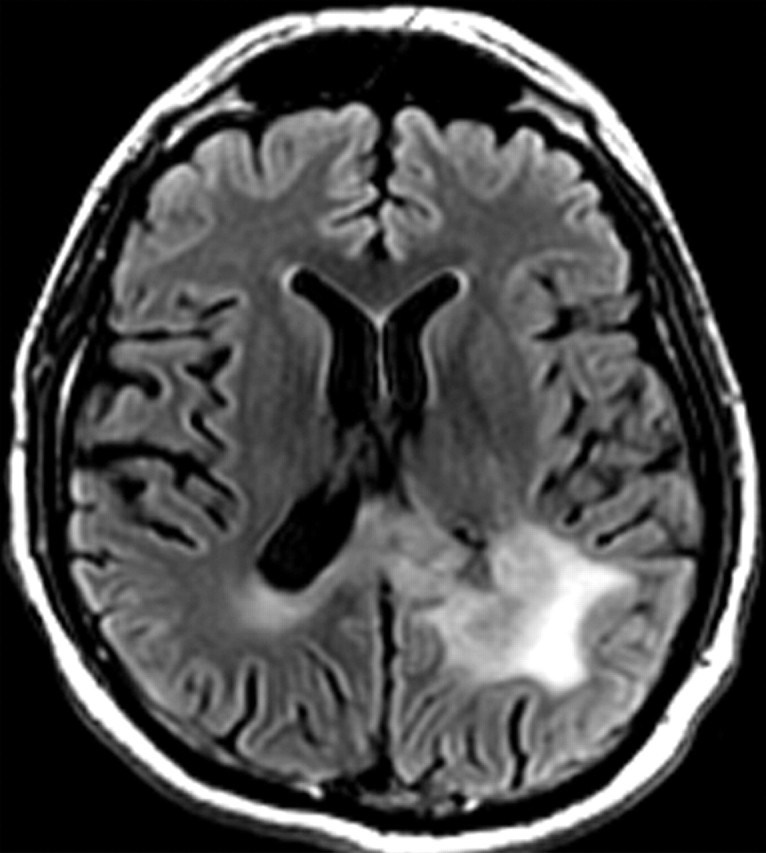
Figure 7d.
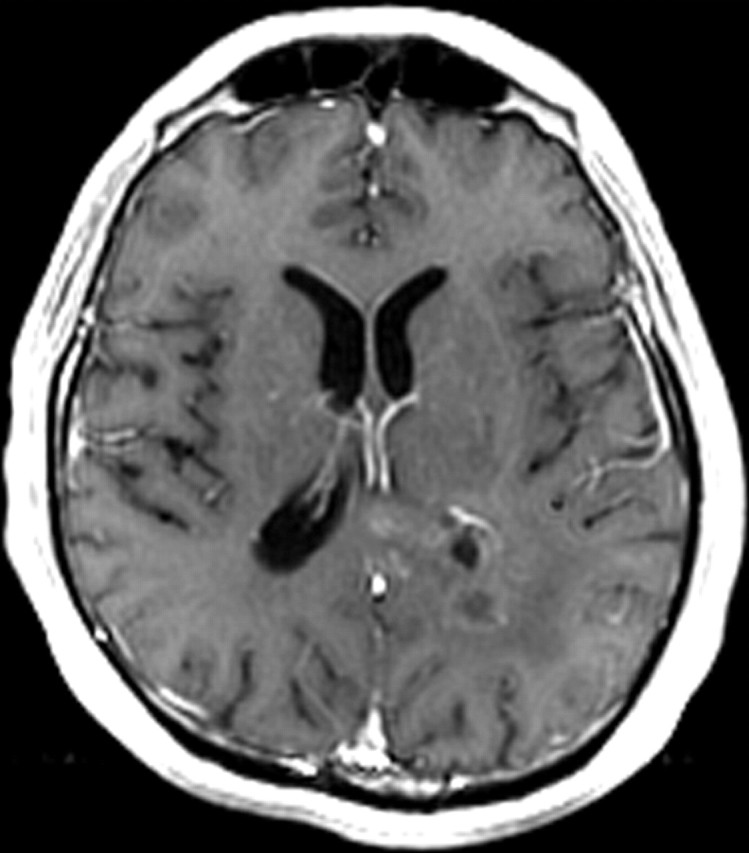
Figure 8.

Vascular proliferation. Photomicrograph (original magnification, ×200; hematoxylin-eosin [H-E] stain) of a specimen obtained during resection of glioblastoma shows serpiginous collections of endothelial cells (arrows) undergoing rapid proliferation, which is elicited by growth factors secreted by tumor cells.
MR perfusion imaging has been used to evaluate gliomas (Fig 9) (12,13). Dynamic susceptibility, dynamic contrast enhancement, and arterial spin-labeling perfusion imaging techniques have all successfully been used to evaluate glioblastomas (12,13). An increase in relative cerebral blood volume (rCBV) is an early sign of the transformation from a lower-grade to a higher-grade glioma and is thought to represent the onset of angiogenesis. Perfusion parameters such as contrast transfer coefficient and rCBV have been shown to correlate with improved survival in patients with gliomas (12,13). Barajas et al (14) also correlated diffusion and perfusion imaging findings with histologic features of aggressiveness.
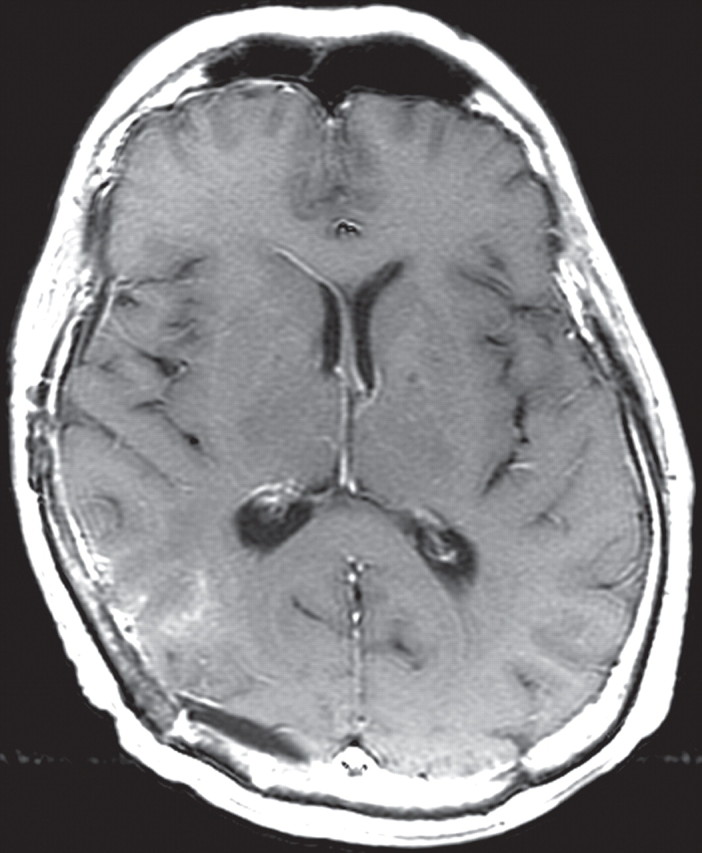
Recurrent glioblastoma in a 64-year-old man. (a) Axial color-coded MR perfusion map shows an area of increased rCBV (arrow). (b) Axial contrast-enhanced T1-weighted MR image shows a recurrent enhancing mass in the right parietal lobe, a finding that correlates with the area of increased rCBV in a. (c) Axial color-coded MR perfusion map obtained after the patient underwent 6 weeks of anti-VEGF therapy shows that rCBV returned to near-normal levels. (d) Axial contrast-enhanced T1-weighted MR image shows an accompanying reduction in the amount of enhancement of the tumor. These changes commonly occur after patients begin antiangiogenesis therapy and may be seen in a matter of days.
Figure 9a.
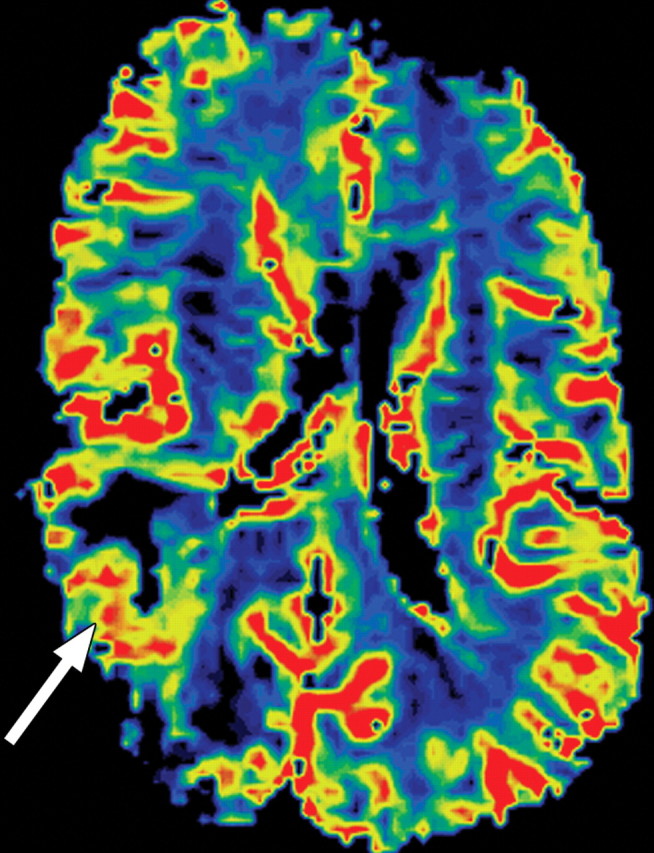
Figure 9b.
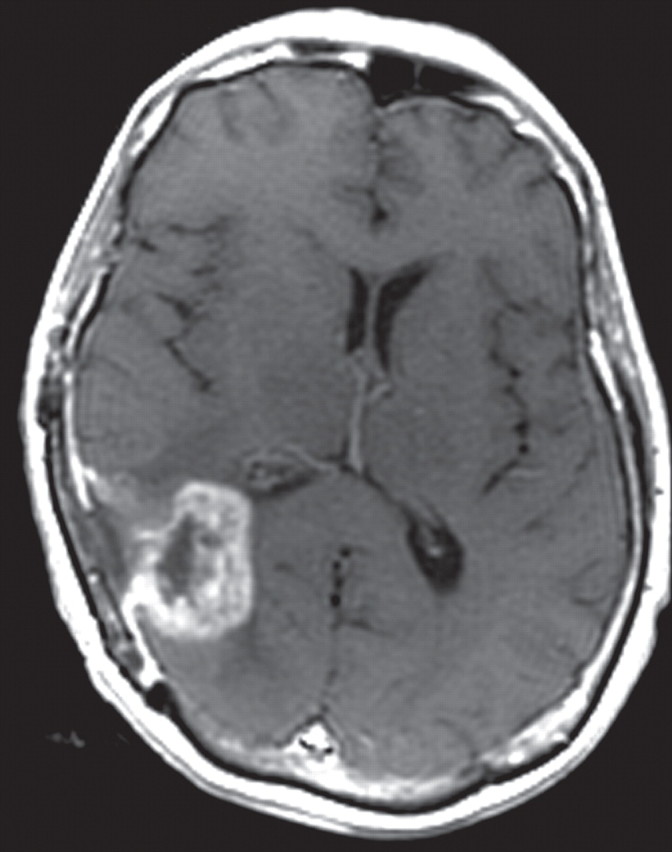
Figure 9c.
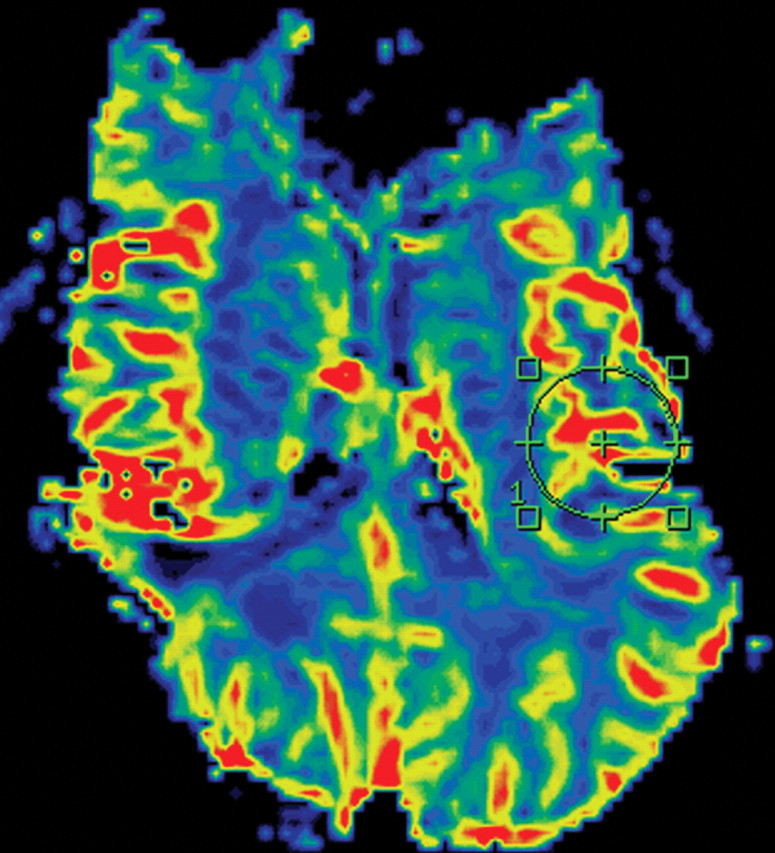
Figure 9d.
Use of MR Imaging Features to Evaluate or Predict Response to Therapy
There is increased interest in identifying MR imaging biomarkers that may help evaluate or predict response to antiangiogenic therapy (15). Antiangiogenic therapy results in decreases in tumor enhancement and edema in most patients, and, as a result, the usual measures for assessing response to therapy are no longer reliable (Fig 9). Perfusion imaging often demonstrates a rapid reduction in contrast transfer coefficient and rCBV after commencing antiangiogenesis therapy (Fig 9). Despite initial imaging findings of response to antiangiogenesis therapy in most patients with recurrent glioblastoma, tumors ultimately progress, without exception. Tumor resistance to antiangiogenic therapy results in distinct imaging and pathologic patterns of growth. MR imaging features of this pattern of recurrence are characterized by an increased area of abnormal signal intensity on T2-weighted images, with no accompanying prominent enhancement (16).
New techniques for calculating vessel size and density are emerging and may prove useful in monitoring anti-VEGF therapy (12). Diffusion imaging has also been used to assess response to antiangiogenesis therapy. After bevacizumab therapy, changes (either increases or decreases) in the apparent diffusion coefficient (ADC) correlate with decreased survival in patients with recurrent glioblastoma (17). In another study, pretreatment ADC histogram analysis was used to predict response to bevacizumab therapy in patients with glioblastoma (18). In that study, pretreatment ADC measures were found more useful for stratifying progression-free survival than were changes in enhancing tumor volume measured during treatment.
Correlating MR Imaging Features and Gene Expression Data
Studies have correlated gene expression with MR imaging and pathologic features of glioblastoma (14,19–21). Several of these studies use imaging to guide sample selection for genetic analysis, with significant variation in angiogenesis-related gene expression among samples obtained in the same patient and even greater variation among samples acquired from different patients (14,19–21). There is increased expression of angiogenesis- and hypoxia-related genes in the enhancing portions of glioblastoma compared with that of the necrotic core and the nonenhancing periphery (14,20,21). In evaluating variability among different patients, investigators have defined imaging phenotypes that correlate with gene expression. A “contrast-enhancing” phenotype, which is defined by enhancement of more than 5% of the total tumor volume, correlates with increased expression of angiogenesis- and hypoxia-associated genes (21). Significant variability in gene expression was reported among tumors that were classified as completely or incompletely enhancing (19). In this study, incompletely enhancing tumors were defined as those that contained regions of nonenhancement (not necrosis), whereas completely enhancing tumors were defined as those that contained only enhancing tumor (excluding necrosis). Completely enhancing tumors demonstrated increased expression of VEGF, as well as several factors related to hypoxia-induced angiogenesis pathways, compared with incompletely enhancing tumors. Furthermore, patients with completely enhancing tumors had decreased survival compared with those with incompletely enhancing tumors (19).
Cell Proliferation
Glioblastomas are heterogeneous tumors with regions that undergo high levels of unrestrained cellular growth (6,22). A synergistic interplay of numerous molecular changes cause both oncogene activation and tumor suppressor inactivation, which ultimately lead to uncontrolled cellular proliferation and survival of the tumor (1,22).
Proliferation Pathways
Multiple genetic alterations and changes in gene expression ultimately lead to aberrant control of the cell cycle in glioblastomas. Rb1 and p53 are the two most common tumor suppression pathways that are known to be inactivated in most patients with glioblastoma (1,23,24). Rb1 and p53 are key regulators of cell cycle progression from the G1 to the S phase (1). In patients with glioblastoma, control by Rb1 is usually circumvented by mutation of Rb1, loss of chromosome 13q, or increased activity of Rb1 inhibitors (1,25,26). Decrease or loss of function of p53 most commonly results from point mutations, loss of chromosome 17p, or increased expression of p53 inhibitors such as MDM4 (26,27). Inactivation of p53 leads to inappropriate progression of cell cycles after DNA damage occurs, when the cell cycle should be arrested.
A hallmark of glioblastomas is increased activation of the PI3K/Akt signaling pathway, which contributes to oncogenesis (6). Aberrant PI3K/Akt signaling may result from changes in subunits of PI3K or Akt, which may lead to dysregulation of downstream target proteins involved in cellular growth (1,28,29). Thus, the additive effect of decreased tumor suppressor activity and increased oncogenic activity ultimately leads to unrestrained proliferation in glioblastoma tumor cells.
There are three major categories of molecular changes that may lead to an increased prolif-erative phenotype in glioblastomas (Fig 10): (a) enhanced signaling of extracellular growth factors (eg, PDGF, which activates PDGFR and elicits downstream signaling cascades that promote cellular growth); (b) increased activity of RTKs, which results from many common alterations in genes and gene expression, such as overexpression of EGFR, which is observed in approximately 40% of patients with glioblastoma (30), and EGFRvIII, a specific EGFR mutation that is a constitutively active variant of EGFR and is present in approximately 30% of patients with glioblastoma (1,31); and (c) dysregulated signaling pathways, most commonly in the PI3K/Akt/RAS pathway, with pro-oncogenic function seen in approximately 85% of patients with glioblastoma (28). Abnormalities in suppressors such as p53, Rb1, and PTEN are key factors in the lack of physiologic cellular inhibition to aberrant cellular growth.
Figure 10.
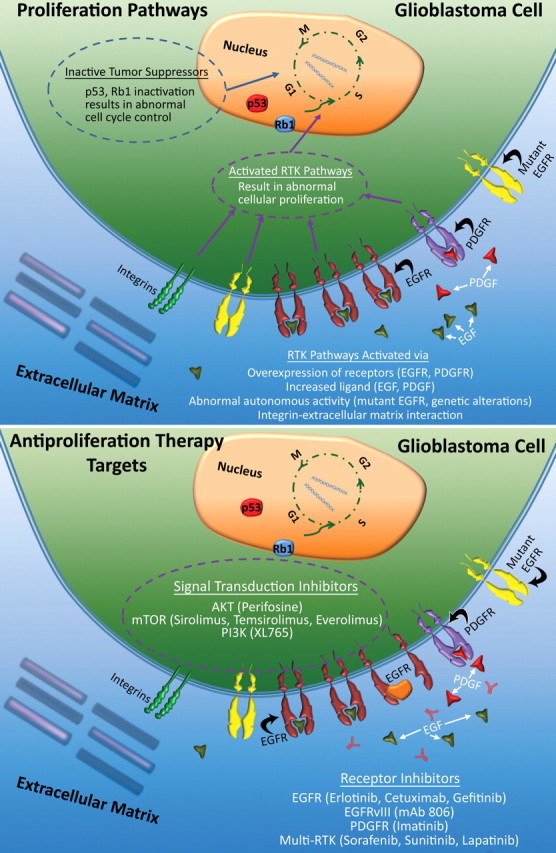
Proliferation in glioblastoma. Top illustration shows the molecular processes involved in uncontrolled tumor cell proliferation that occurs in glioblastoma, a result of the additive effects of increased RTK activity—which results from overexpression, increased ligand, inherently active mutations of receptors such as EGFRvIII, and genetic alterations in the RTK/PI3K pathway—and a decrease in suppressor activity (eg, p53 and Rb1). Bottom illustration shows the therapeutic targets of cellular proliferation; the main targets are direct inhibition of RTK function and inhibition of downstream signal transduction.
Significant communication between the major receptors and signaling pathways reinforces inappropriate regulation of any single pathway. This communication between key molecular mediators of proliferation and survival, as well as the heterogeneous cellular make-up of glioblastomas, makes guided therapy more complicated and implies a need for combination therapies (1).
Antiproliferation Therapy
There are two major antiproliferation strategies for treating glioblastoma (Fig 10). First, two small molecule inhibitors of EGFR, erlotinib and gefitinib, have undergone clinical trials in patients with glioblastoma, but results have been inconsistent. Early studies suggested that glioblastoma with EGFRvIII mutations and an intact PTEN gene may respond to EGFR inhibitors (32). Other trials have reported no significant improvements in progression-free survival (33). Cetuximab, an antibody against EGFR, was also not proved to be effective in treating glioblastoma (22). PDGFR is another RTK target that demonstrated no improvement in progression-free survival after imatinib therapy. Studies of newer, more potent PDGFR inhibitors are underway (22). A final approach to treating glioblastoma involves targeting multiple tyrosine kinase receptors (eg, EGFR, PDGFR) with multitargeting agents such as sorafenib, sunitinib, and lapatinib (22).
Second, inhibitors of signal transduction pathways target different steps in the various pathways that are known to be dysregulated in patients with glioblastoma. Many of these therapies are currently in the early phases of clinical testing. Perifosine, an Akt inhibitor, has shown promise for reducing tumor growth in animal models and is currently in clinical trials (29,34). Newer treatments, such as XL765, a dual PI3K and mTOR inhibitor, are underway, with results still pending (22). A current treatment option that uses targeted therapy has recently been reviewed by Krakstad et al (29).
Imaging and Histologic Features
There are three MR imaging features that correlate with cellular proliferation in glioblastoma: the amount of mass effect seen on conventional MR images, the level of choline measured at MR spectroscopy, and restriction of diffusion on diffusion-weighted images (Fig 11). For example, tumors with moderate or severe mass effect have been shown to have substantially higher proliferation-related gene expression, independent of the overall tumor size (21).
Glioblastoma in a 69-year-old man. (a–c) Axial diffusion-weighted (a), FLAIR (b), and gadolinium contrast-enhanced T1-weighted (c) MR images show a left temporal mass. In a, the area of increased signal intensity correlates with the more densely cellular elements of the tumor and increased cellularity and proliferation at pathologic analysis. (d–f) Axial diffusion-weighted (d), FLAIR (e), and gadolinium contrast-enhanced T1-weighted (f) MR images obtained 16 months later, while the patient was undergoing bevacizumab therapy, show increased signal intensity in the left basal ganglia (d) and a larger area of FLAIR signal abnormality (e). In f, note the relative lack of enhancement, a result of anti-VEGF therapy. (g) MR spectrum shows an increased level of choline (Cho), a marker of proliferation. After treatment, the glioblastoma recurred. Cr = creatine, NAA = N-acetyl aspartate.
Figure 11a.
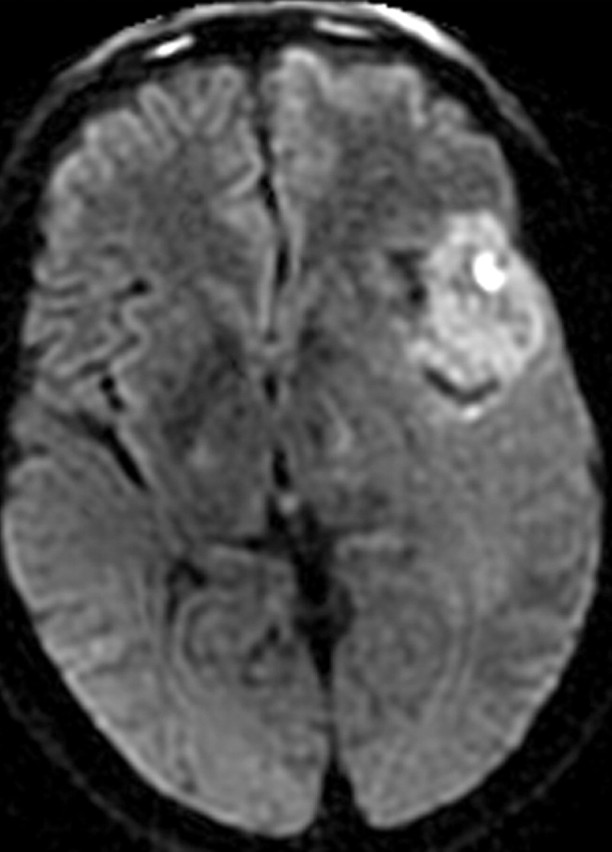
Figure 11b.
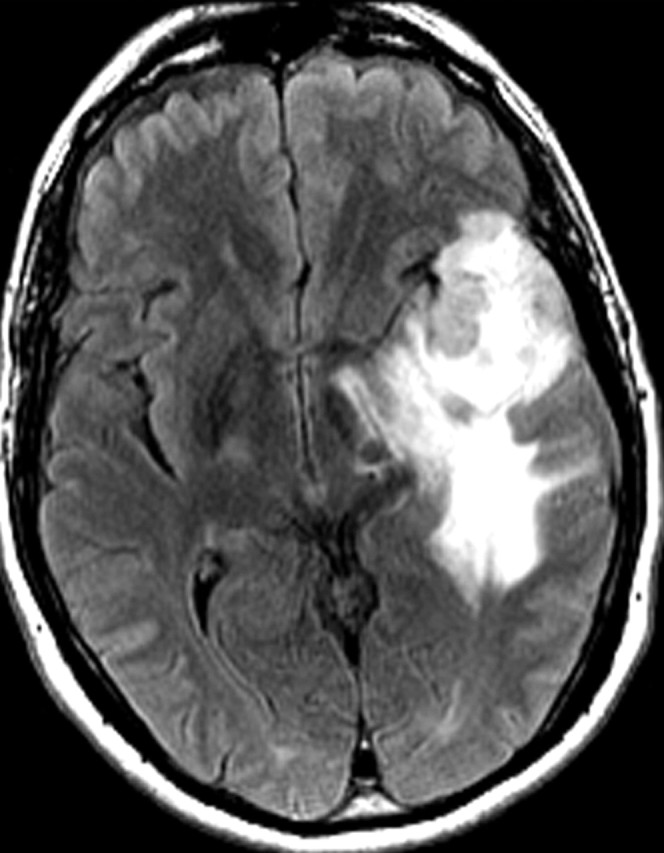
Figure 11c.
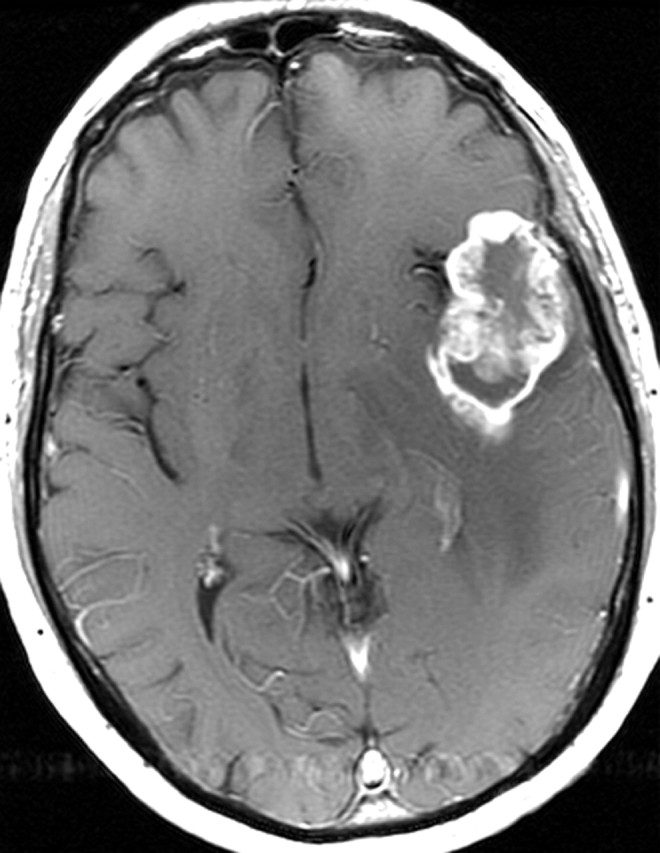
Figure 11d.
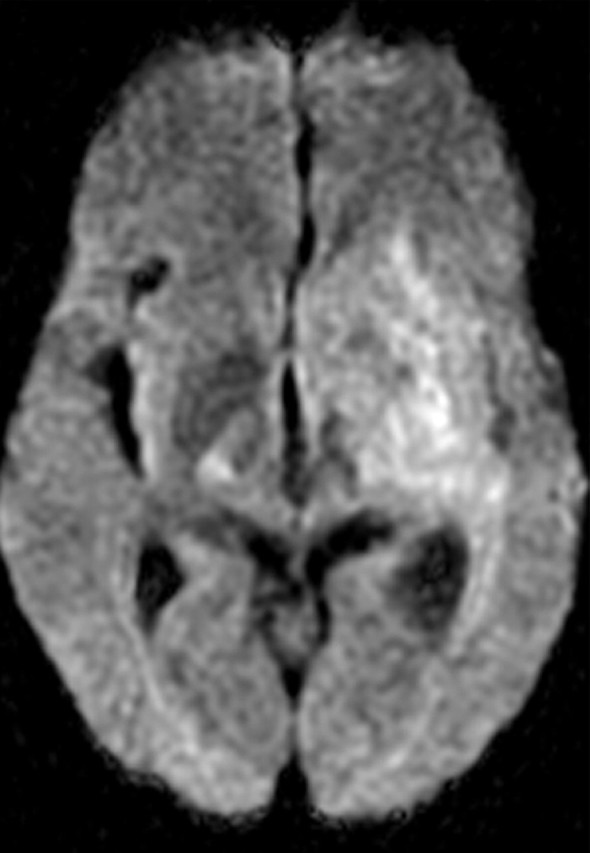
Figure 11e.
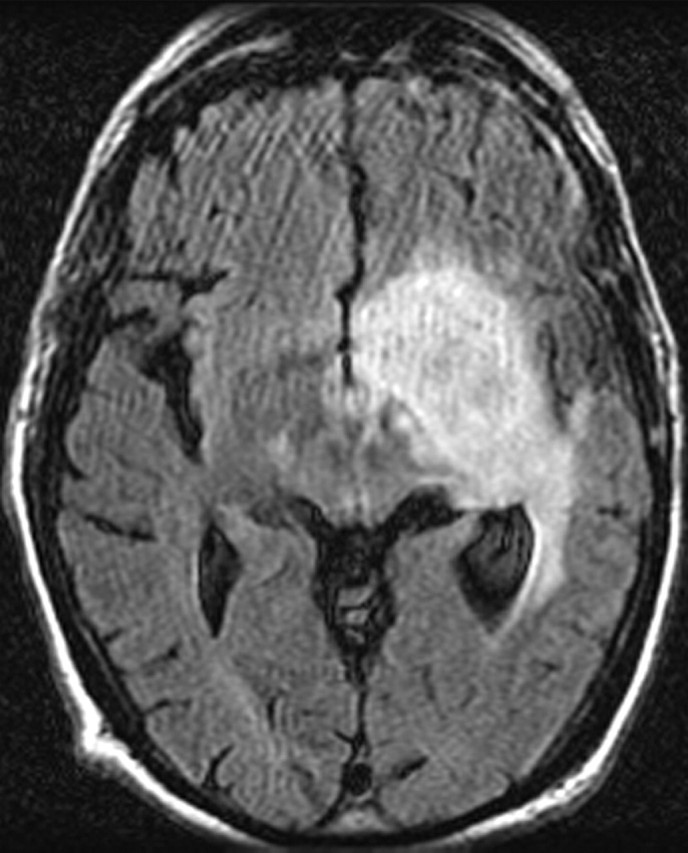
Figure 11f.
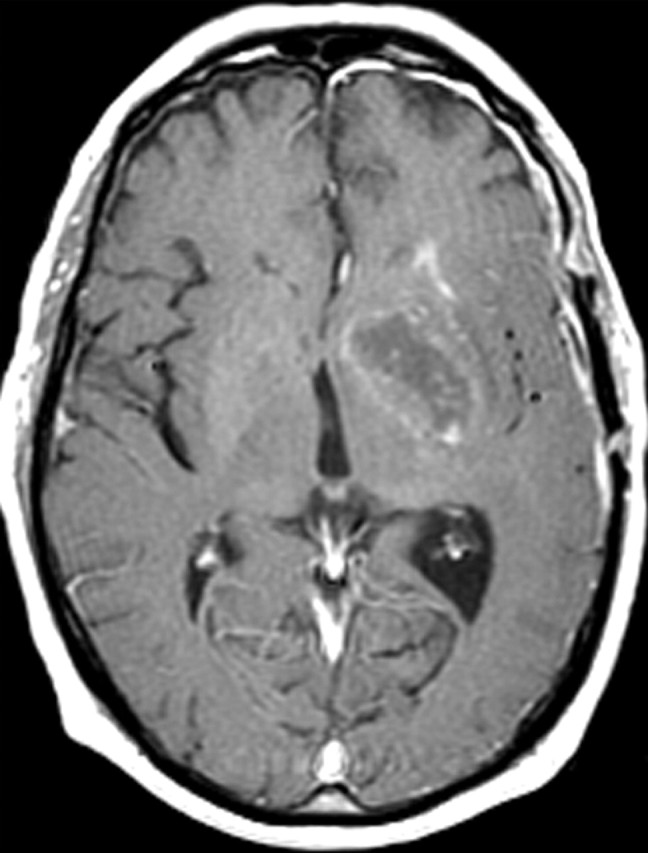
Figure 11g.

Further, choline is a marker of cell membrane turnover and is reliably identified at MR spectroscopy in patients with glioblastoma (35). There is a linear relationship between the Ki-67 labeling index, a histologic measure of proliferation, and choline levels measured at MR spectroscopy in homogeneous tumors; however, this relationship is inconsistent in more heterogeneous tumors (Fig 12) (36).
Figure 12.
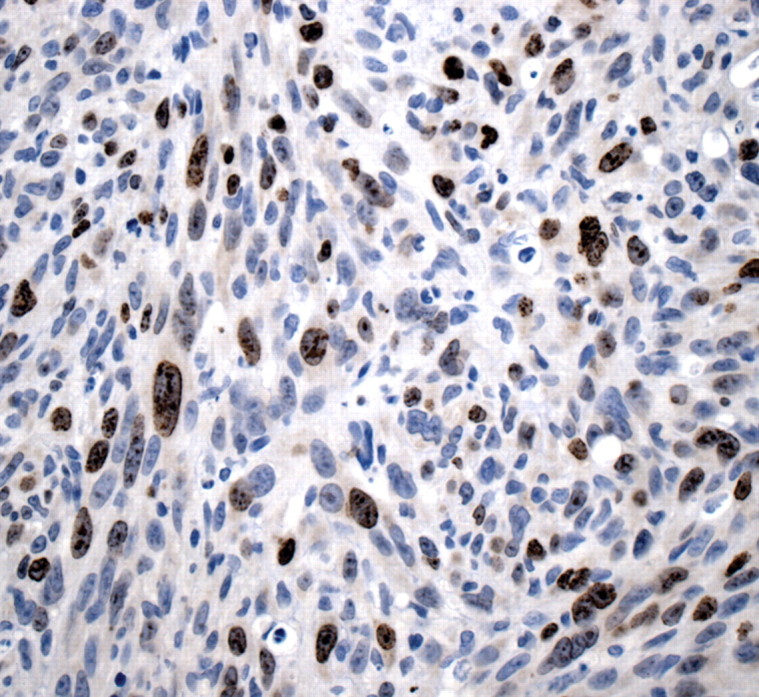
Histologic findings of proliferation. High-power photomicrograph (original magnification, ×400; Ki-67 stain) of a specimen obtained during resection of glioblastoma shows brown-stained nuclei that are immunopositive for the cell-cycle marker Ki-67, a finding indicative of the active proliferative phase of pleomorphic tumor cells.
Diffusion imaging is another tool that provides insight into cellular proliferation in patients with glioblastoma. Fraction anisotropy, which is derived from diffusion tensor imaging techniques, is correlated with tumor cell density and Ki-67 labeling (37). Investigators reported an inverse relationship between the ADC and cellular density of glioblastomas, as well as other histologic markers of aggressiveness (Fig 11) (14).
Invasion
Glioblastoma is an infiltrative tumor that is characterized by aggressive invasion of tumor cells into normal brain parenchyma, a characteristic that causes substantial morbidity and is a significant factor in the high tumor recurrence rates (2). Molecular events including changes in cell adhesion, extracellular matrix remodeling, immune modulation, and cell motility occur in a coordinated fashion to enable tumor cell invasion into surrounding tissues (Fig 13) (38).
Figure 13.
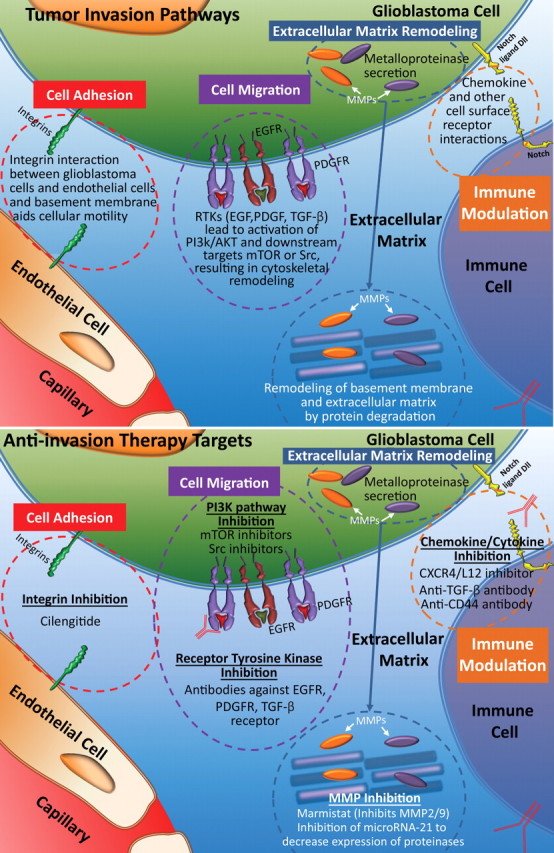
Invasion pathways. Top illustration shows the process of invasion, which involves several steps and pathways: First, cells dissociate from the tumor mass, remodel the extracellular matrix, and undergo migration. Finally, immune effector activation occurs, an important step in supporting migrating tumor cells. Bottom illustration shows invasion therapy targets, which may involve any of the four steps involved in tumor cell invasion. NFκB = nuclear factor κ of B cells, MMP = matrix metalloproteinase, TGF-β = transforming growth factor β, Src = sarcoma gene (oncogene).
Invasion Pathways
Cell Adhesion.—Alterations in cell surface adhesion molecules allow glioblastoma cells to dissociate from the tumor bulk, allowing their association with the extracellular matrix for cell migration. Cell surface molecules, cadherins, and cell adhesion molecules (CAMs), which form the adherent junctions, are frequently destabilized and disorganized in glioblastoma, allowing for tumor expansion and invasion (38). Molecules involved in gap junctions are downregulated to aid in individual tumor cell detachment. These molecular alterations of cellular adhesion are thought to be important early events in tumor invasion (38,39).
To effectively infiltrate the normal brain parenchyma, glioblastoma and endothelial cells attach themselves to the extracellular matrix by way of a set of surface receptors. The most important molecules mediating this attachment are integrins, surface receptors for extracellular matrix that also function as signaling molecules that activate focal adhesion kinase and other intracellular mediators of cell attachment and migration (40,41). In glioblastoma, integrins alphav beta1 (αvβ1), αvβ3, and αvβ5 are most frequently upregulated, and their increased expression correlates with the invasive behavior of glioblastoma.
Extracellular Matrix Remodeling.—Upon acquiring a unique cell–extracellular matrix interaction between tumor cells and normal parenchyma, additional remodeling of extracellular matrix is required to establish a favorable microenvironment that allows for tumor expansion. Further extracellular matrix remodeling consists of two distinct processes: (a) degradation of existing stroma by way of proteolysis to dissociate tumor cells from their surrounding tissue and (b) synthesis and deposition of new extracellular matrix, which primes tumor cells for migration (38,40,42).
Proteases play an important role in the degradation of the existing ground substance in glioblastomas. It has been shown that loss of the normal organization of extracellular matrix ground substance creates a favorable environment for invasion of tumor cells (39). It was repeatedly demonstrated that expression of metalloproteinases (MMPs)—especially MMP-2, MMP-9, and MMP-12—correlates with the grade of gliomas and their invasive phenotypes (39,42,43). Other proteases such as tenascin-C, urokinase plasminogen activator, and cysteine proteases are also found in patients with glioblastoma, a finding that indicates that degradation of extracellular matrix is a contributing factor to tumorigenicity and tumor invasion (39,44). Because glioblastoma cells tend to migrate along white matter tracts, de novo synthesis of extracellular matrix components during migration is also thought to be important in supporting tumor invasion and tumor-induced angiogenesis (38). Ectopic expression of various types of collagen in glioblastoma is associated with deposition of extracellular matrix and blood vessels and is correlated with infiltrative characteristics of glioblastoma and a worse prognosis (42).
Cell Migration.—Molecular signaling that is responsible for cell motility and cytoskeleton rearrangement is necessary for tumor migration and invasion. Formation and disassembly of protruding and retracting plasma membranes at the leading edge of the tumor cell are thought to be the essential processes that underlie tumor cell motility in migration (38). Growth factor pathways play an important role in tumor invasion by orchestrating the activation of a network of downstream mediators, which coordinate cellular proliferation and tumor expansion. Common mediators of these pathways, such as Akt and mTOR, are crucial regulators for both cellular proliferation and motility. The rho family of small guanosine 5’-triphosphate molecules is downstream of growth factor receptors and is a major regulator of cytoskeleton rearrangement, which is necessary for cell motility and migration (38,39,45).
Immune Modulation.—Modulation of immune response by glioblastomas is important for tumor maintenance and invasiveness. Altered chemokine and chemokine receptor expression, such as overexpression of CXC receptor 4 (CXCR4) and CXC ligand 12 (CXCL12), is commonly present in glioblastomas and serves to modulate the types of infiltrating immune cells, leading to a tumor-promoting microenvironment (46). Communication between infiltrating immune effectors (predominantly microglia) and tumor cells leads to activation of signaling cascades in invasive glioblastomas, such as overexpression of MMP-2 and activation of growth factor pathways. Transforming growth factor beta (TGF-β), a cytokine produced mainly by glioblastoma-associated microglia, enhances invasiveness by promoting survival of glioblastoma cells and altering expression of cell motility–associated genes (47). In mouse models of glioma, inhibition of TGF-β abolished micro-glia-induced glioma growth and invasion, a finding that suggests that an immune modulatory aspect of glioblastoma is important for tumorigenicity. In addition to infiltrating microglia, subpopulations of monocyte or dendritic cells and T cells are present in subsets of glioblastoma; these subpopulations promote tumor growth and invasion (48).
Anti-invasion Therapy
Strategies for inhibiting cell invasion by glioblastomas have targeted four major processes: extracellular matrix molecules, extracellular matrix remodeling, cell migration, and immune effector activation (Fig 13). Integrin inhibitors (ie, cilengitide) competitively target αvβ3 integrin that is overexpressed on tumor endothelial cells and αvβ5 that is overexpressed on glioblastoma cells. Early clinical trials of cilengitide demonstrated antitumor activity (48,49). Inhibition of extracellular matrix degradation is the main strategy to prevent extracellular matrix–dependent migration. Marimastat and prinomastat are broad-spectrum MMP inhibitors that demonstrated preclinical anti-invasion effects (50,51). Inhibiting both cell motility and cytoskeleton rearrangement by targeting different mediators of the growth factor pathway seems to be the most effective method of inhibiting tumor migration. Inhibitors of Akt (ie, perifosine and LY294002) and mTOR (ie, everolimus and temsirolimus) were both identified as effective therapeutics to reduce cellular proliferation and tumor invasion in preclinical and early clinical trials (39). Targeting chemokine receptors such as CXCL12 and CXCR4 prevents cell migration and tumor invasion in mouse models (49). Use of anti-TGF-β therapy by way of antibodies, genetic manipulation, or pharmacologic agents may reduce glioblastoma growth and invasion by preventing microglia recruitment, downstream adhesion molecule activation, and chemokine signaling (44,50).
Histologic and Imaging Features
MR imaging findings underrepresent the extent of tumor in essentially all patients with glioblastoma. Early in the pathogenesis of glioblastoma, tumor cells migrate along white matter tracts, which may appear normal at MR imaging. Findings of tumor spread also may be subtle at histologic analysis (Fig 14). Bulk tumor invasion beyond the enhancing portions of the tumor often may be recognized on FLAIR or T2-weighted MR images as areas of high signal intensity that are not as bright or in the same configuration as areas of vasogenic edema (Fig 15). An infiltrating phenotype of glioblastoma (compared with a phenotype that exhibits classic vasogenic edema) is more likely to lead to multifocal disease and decreased survival (21). Evaluation of the gene expression pattern in patients with an infiltrating pattern of glioblastoma revealed increased expression of genes associated with gliogenesis and central nervous system development (21). However, other studies have reported that vasogenic edema is a negative prognostic factor (19,52).
Histologic findings of glioblastoma invasion. (a) Low-power (original magnification, ×20; H-E stain) photomicrograph shows densely packed tumor cells at left and subtle infiltration of glioma cells into the more-normal brain parenchyma at right, a finding indicative of invasion by glioblastoma. (b) High-power (original magnification, ×600; H-E stain) photomicrograph shows individual tumor cells percolating through the neuropil at the infiltrating border.
Figure 14a.
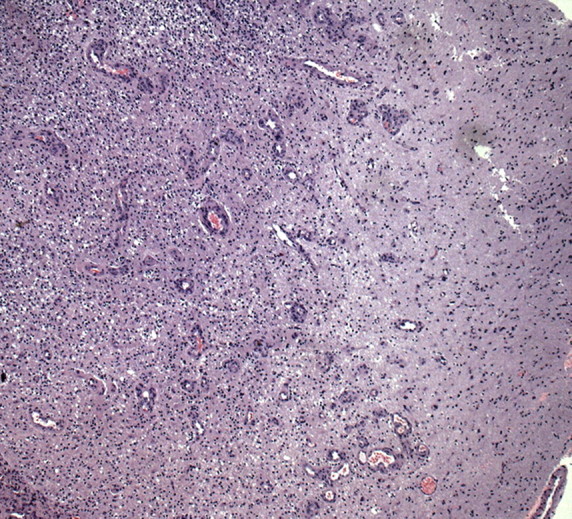
Figure 14b.

Nonenhancing progression of glioblastoma in a 66-year-old man. (a) Axial FLAIR MR image shows a zone of vasogenic edema. (b) Axial FLAIR MR image, obtained after bevacizumab therapy, shows that the edema has improved. (c–f) FLAIR MR images obtained over the next 7 months show progressing changes in signal intensity, a finding consistent with tumor invasion involving both hemispheres. (g) Axial gadolinium contrast-enhanced T1-weighted MR image shows limited enhancement even at the patient's last follow-up MR imaging evaluation.
Figure 15a.
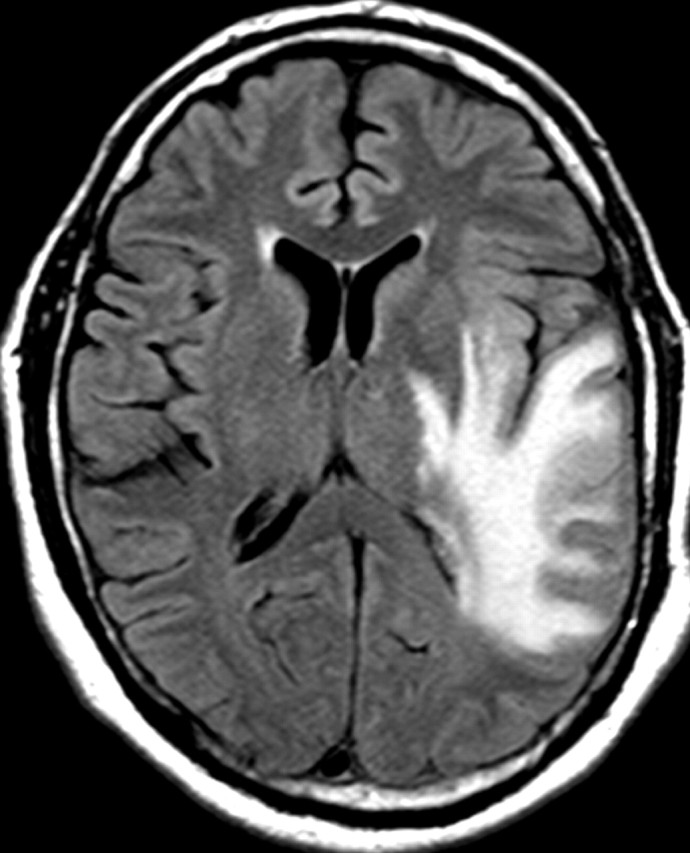
Figure 15b.
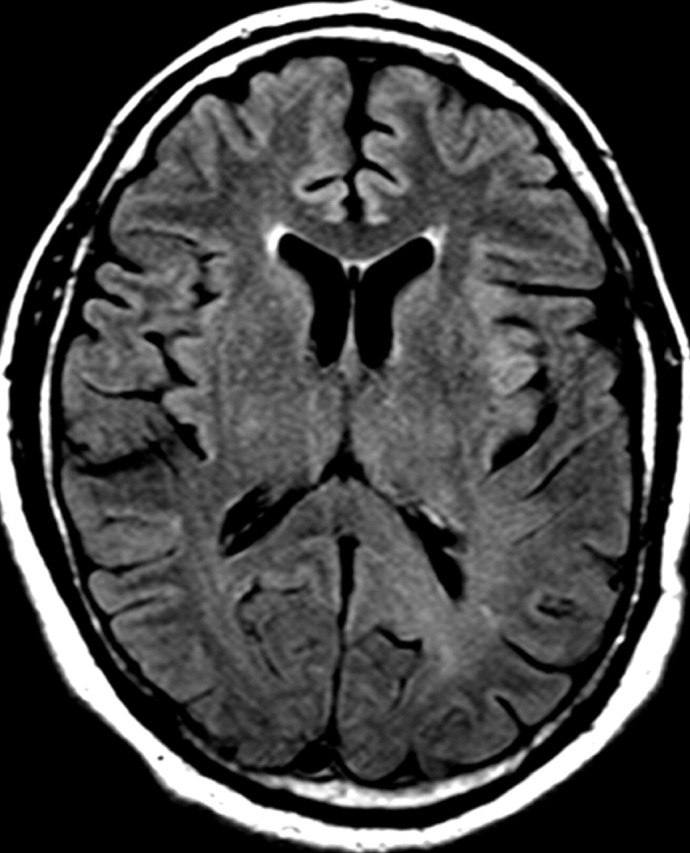
Figure 15c.
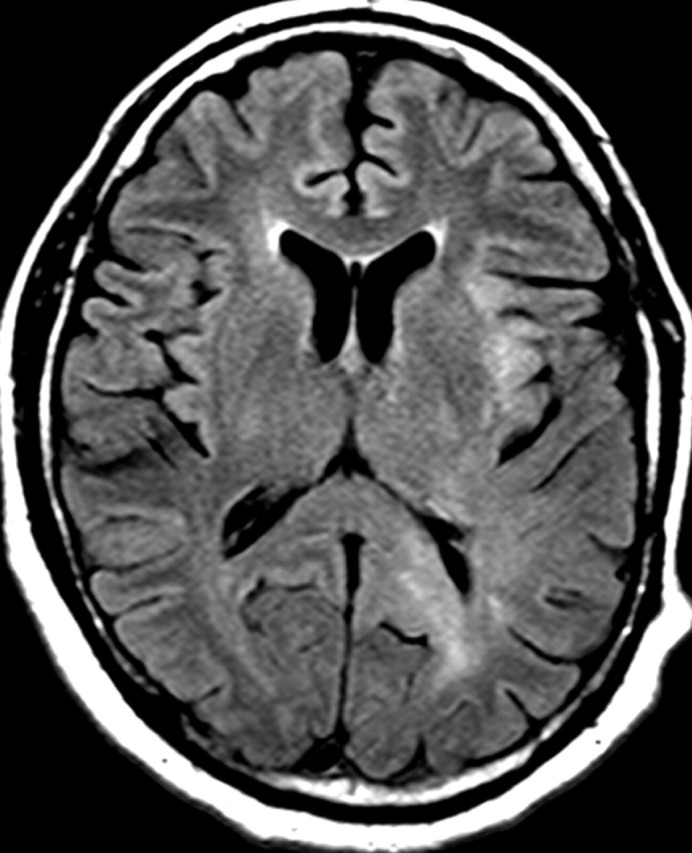
Figure 15d.
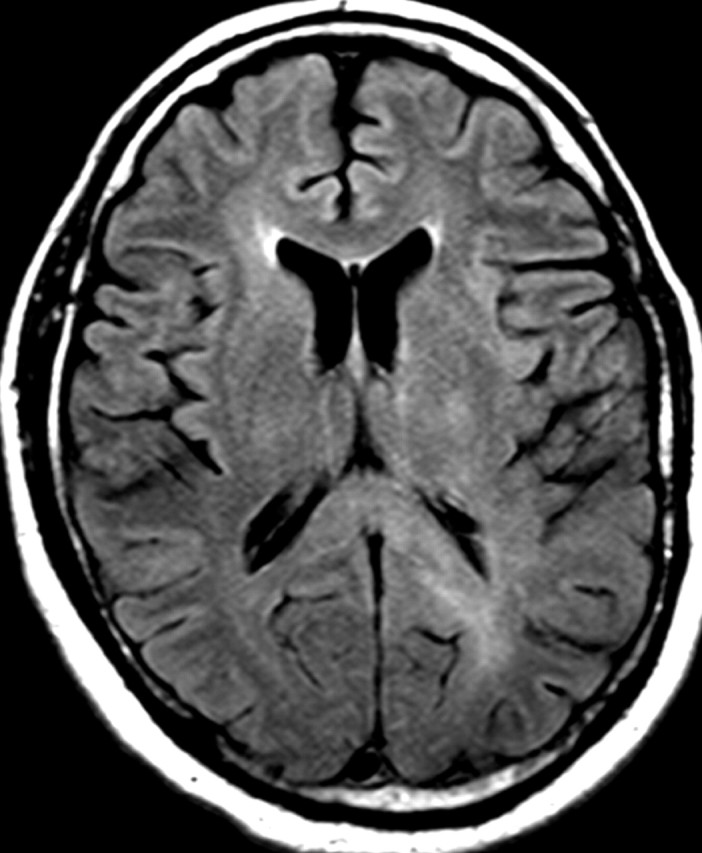
Figure 15e.
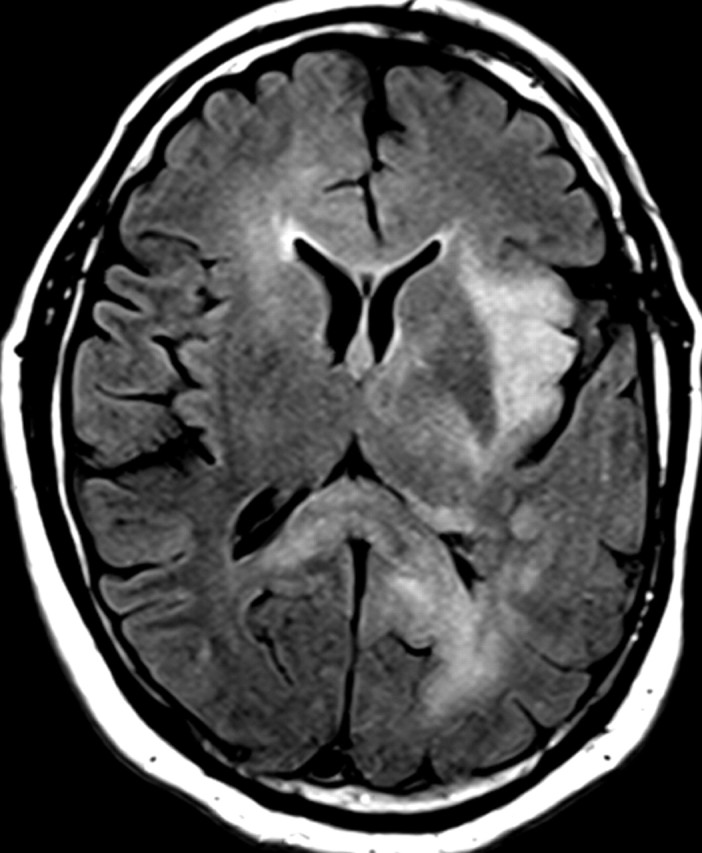
Figure 15f.
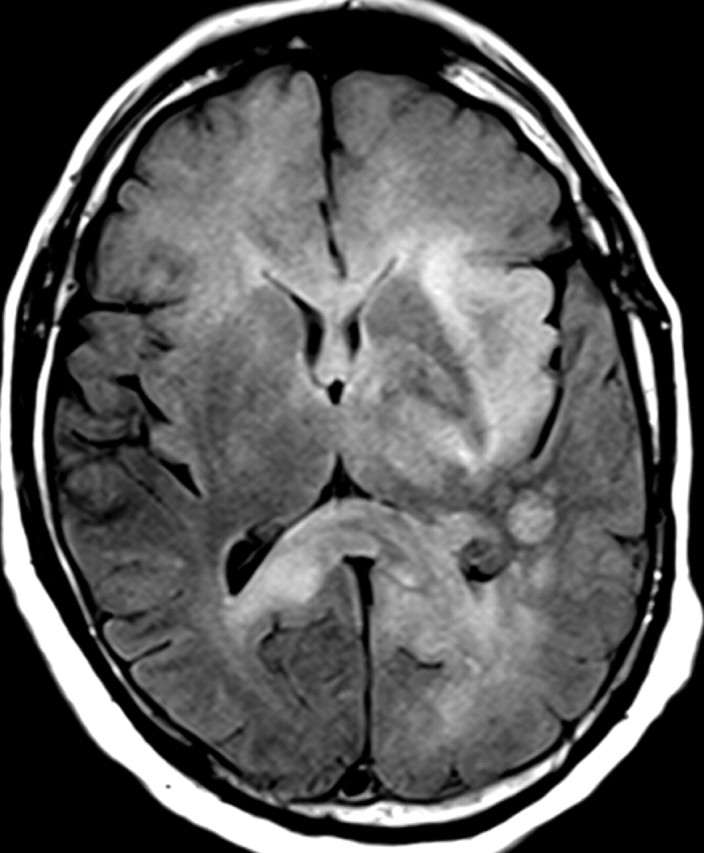
Figure 15g.
IDH1 mutations are only present in about 5% of patients with primary glioblastoma. Recent data indicate that tumors with IDH1 mutation have different imaging characteristics than those without IDH1 mutation. Tumors with IDH1 mutation tend to be multifocal, and often no abnormal enhancement is seen on T1-weighted MR images, findings that indicate that these tumors may have less angiogenesis and a more invasive or cell proliferation phenotype, as has been demonstrated in cases of gliomatosis cerebri with IDH1 mutation (53,54).
In patients with glioblastoma, therapeutic targeting of a single biochemical pathway often offers little long-term benefit because other pathways remain abnormal and continue to drive abnormal cellular behavior. For example, continued or even increased tumor invasiveness has been observed when blocking key molecular mediators of angiogenesis, a phenomenon that has led to the inclusion of progression of nonenhancing tumors in the Response Assessment for Neuro-Oncology (RANO) guidelines (Fig 15) (55,56).
Cell Survival and Antiapoptosis
Resistance to apoptosis and other cell death mechanisms leads to survival of tumor cells in the face of intrinsic and extrinsic death-inducing stresses. This resistance to death-inducing stimuli promotes increased resistance to radiation therapy and chemotherapy, a commonly observed characteristic of glioblastomas and a major factor in tumor recurrence (1,22).
Cell Survival and Apoptosis Pathways
A key feature of glioblastoma cells is their resistance to death-inducing stimuli. This resistance is the result of enhanced cell survival pathways and dysfunctional apoptotic pathways (Fig 16) (29). As was previously mentioned, RTKs such as EGFR and PDGFR help mediate cell survival signaling and activate the PI3K/Akt pathway, which leads to downstream prosurvival effects in tumor cells and increased nuclear factor kappa of B cells (NFκB) and survival. The genetic alterations that affect this prosurvival pathway mostly involve overexpression and less common mutations of EGFR and PDGFR, as well as increased activity of PI3K/Akt signaling pathways (1).
Figure 16.
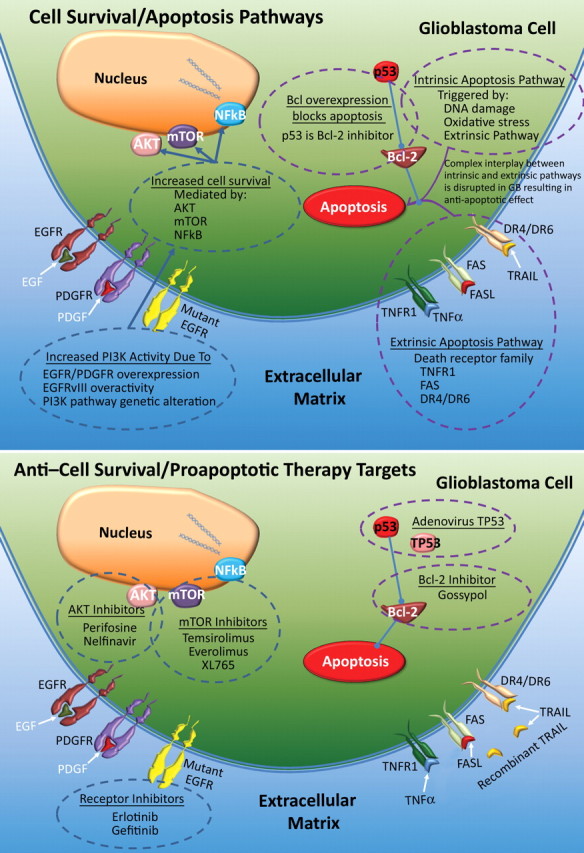
Top illustration shows disruptions in normal cell survival and normal apoptosis in glioblastoma. A combination of pro–cell survival and antiapoptotic events triggers resistance to death-inducing stimuli, and increased activity of PI3K—by way of extracellular factors (eg, EGF and PDGF) or inherently abnormal RTKs (eg, constitutively active EGFRvIII mutant)—leads to increased downstream pathway signaling effects. Decreased proapoptotic activity in the extrinsic and intrinsic apoptosis pathways is a substantial contributor to enhanced survival. Bottom illustration shows therapeutic agents used to target contributors to cell survival and antiapoptosis, which overlap those used in antiangiogenesis and antiproliferation therapies and include receptor inhibitors and inhibitors of Akt and mTOR. Other newer strategies include targeting the apoptosis pathway with gossypol, adenoviral p53 therapy to restore tumor suppressor activity, and recombinant TNF-related apoptosis-inducing ligand (TRAIL). Bcl-2 = B-cell lymphoma 2 oncogene, TNFR1 = tumor necrosis factor R1, TP53 = mutant tumor p53.
Apoptosis may be initiated by extrinsic or intrinsic signaling pathways (29). Extrinsic pathways of apoptosis involve receptors in the tumor necrosis factor family (TNFR), specifically TNF receptor type 1 (TNFR1), TNF receptor superfamily member 6 (FAS), death receptor 4 (DR4), and death receptor 5 (DR5). Ligands for these receptors are TNF-α, TNF receptor superfamily member 6 ligand (FASL), and tumor necrosis factor–related apoptosis-inducing ligand (TRAIL), respectively (57). Through caspases and NFκB, the extrinsic pathway activates the intrinsic signaling pathway, which also may be activated in response to DNA damage, oxidative stress, or lack of growth factors (58,59). Ultimately, activation of these pathways results in increased caspase activity and apoptosis. Upregulation of antiapoptotic B-cell lymphoma-2 (BCL-2), family members of BCL-2, and BCL extra large (BCL-XL) and downregulation of proapoptotic BCL-2–associated x protein (BAX) is a common anomaly in glioblastomas.
There are three major molecular changes that may lead to an increased antiapoptotic phenotype in patients with glioblastoma: (a) decreased efficacy of extracellular factors of apoptosis (eg, inhibition of the death receptor ligand CD95L), in which decoy receptor 3 (DcR3), a soluble decoy receptor that is expressed in glioblastomas and correlates with the glioma grade, binds to CD95L and prevents its interaction with the receptor (1,60); (b) decreased death receptor activity, a common aberration that inhibits the downstream effects of death receptors, most commonly TRAIL, FASL, and TNFR (eg, caspase 8–inhibitory protein inhibition of death-receptor–mediated caspase 8 activation) (1,57); and (c) unbalanced anti- and proapoptotic signaling pathways, which involves a synergistic interplay of both pathways, with increased antiapoptotic activity (eg, BCL-2 and BCL-XL) and decreased proapoptotic activity (eg, BAX, caspases, and p53), which leads to overall increased survival of tumor cells (29).
Anti–Cell Survival and Proapoptotic Targeted Therapies
There are three major anti–cell survival therapies (Fig 16): (a) Akt inhibitors; (b) receptor inhibitors, such as erlotinib and gefitinib; and (c) mTOR inhibitors, such as temsirolimus, sirolimus, and everolimus (29). Currently, studies of multiple Akt inhibitors, such as perifosine, are underway. Clinical trials of mTOR inhibitors have reported no improvements in survival.
There are also three major proapoptotic strategies: (a) antiapoptotic BCL-2 inhibitors, in which gossypol binds to antiapoptotic BCL-2 proteins, a method that is currently in clinical trials, with preliminary results showing measurable response rates (29); (b) death receptor activation, an emerging approach that involves the use of recombinant human TRAIL to induce apoptosis in glioblastoma cells (61); and (c) tumor suppressor activation, a recent target in proapoptotic therapy that was developed because of the close relationship of p53 to normal functioning of the intrinsic pathway. An example of tumor suppressor activation that has been clinically investigated is the use of adenovirus TP53 to introduce a functional copy of the TP53 gene into tumor cells (29).
Histologic and Imaging Features
Abnormal cell survival and resistance to apoptosis is thought to result in central necrosis, a characteristic feature of glioblastoma (Fig 17). The propensity of glioblastoma for necrosis is due, in part, to its resistance to apoptosis, which drives cells to necrosis as an alternative method of cell death. Abnormal cell survival is also implicated in the resistance of glioblastoma to therapy. Recently, abnormal cell survival was implicated in the presence of new areas of restricted diffusion, a curious phenomenon that develops in patients with glioblastoma who are undergoing antiangiogenesis therapy (62) (Fig 18). At histologic analysis, these regions frequently contain proliferating, densely packed tumor cells rather than the necrotic tissue that one might expect.
Recurrent glioblastoma in a 51-year-old woman. (a, b) Axial diffusion (a) and gadolinium contrast-enhanced T1-weighted (b) MR images show a glioblastoma. The patient underwent resection, radiation therapy, and temozolomide therapy; however, the glioblastoma recurred 9 months later, and bevacizumab therapy was begun. (c, d) Axial diffusion-weighted (c) and gadolinium contrast-enhanced T1-weighted (d) MR images obtained 12 weeks after the beginning of anti-VEGF therapy show a region of restricted diffusion. (e, f) Follow-up axial (e) and coronal (f) gadolinium contrast-enhanced T1-weighted MR images, obtained 16 weeks later, show diffuse tumor infiltration into the left frontal lobe and across the corpus callosum.
Figure 18a.
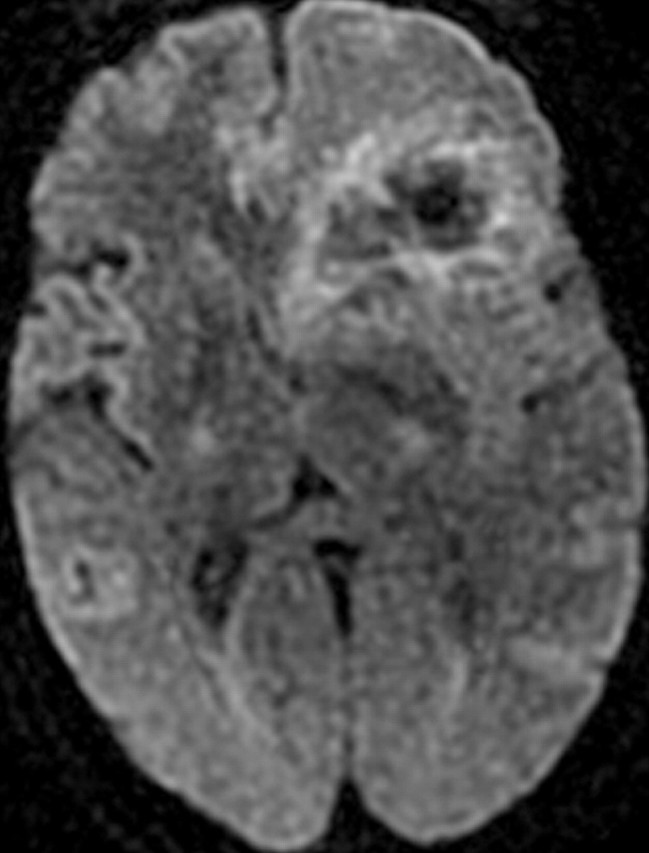
Figure 18b.
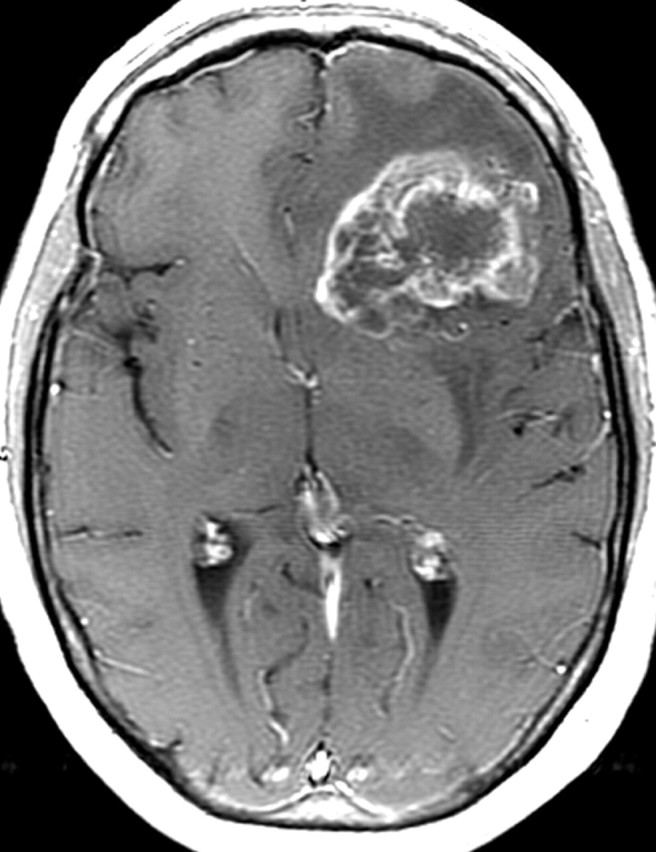
Figure 18c.
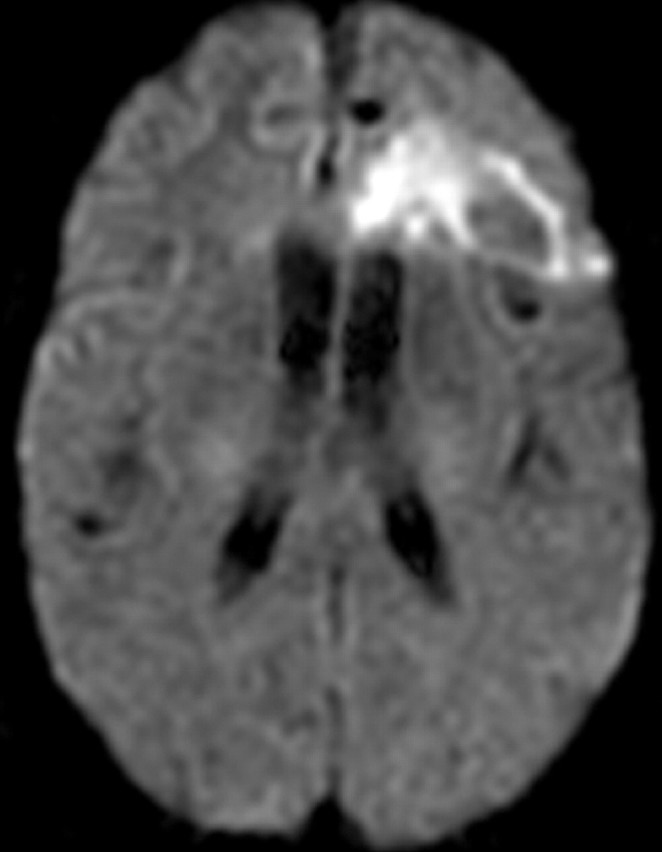
Figure 18d.
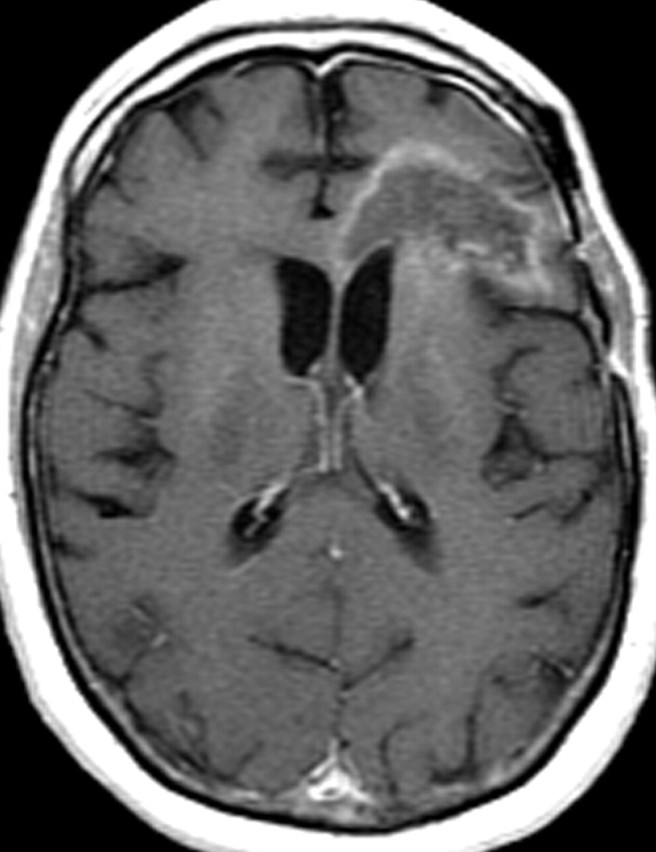
Figure 18e.
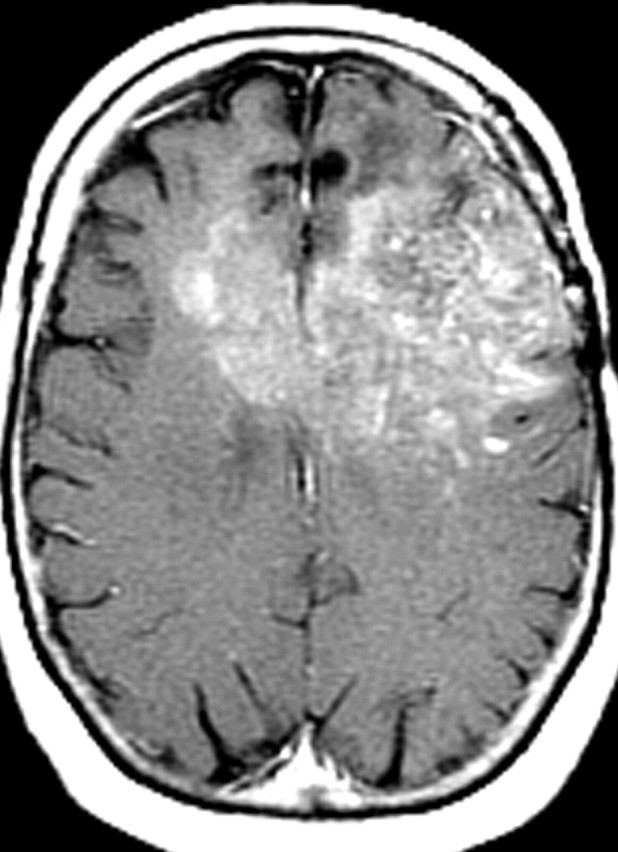
Figure 18f.
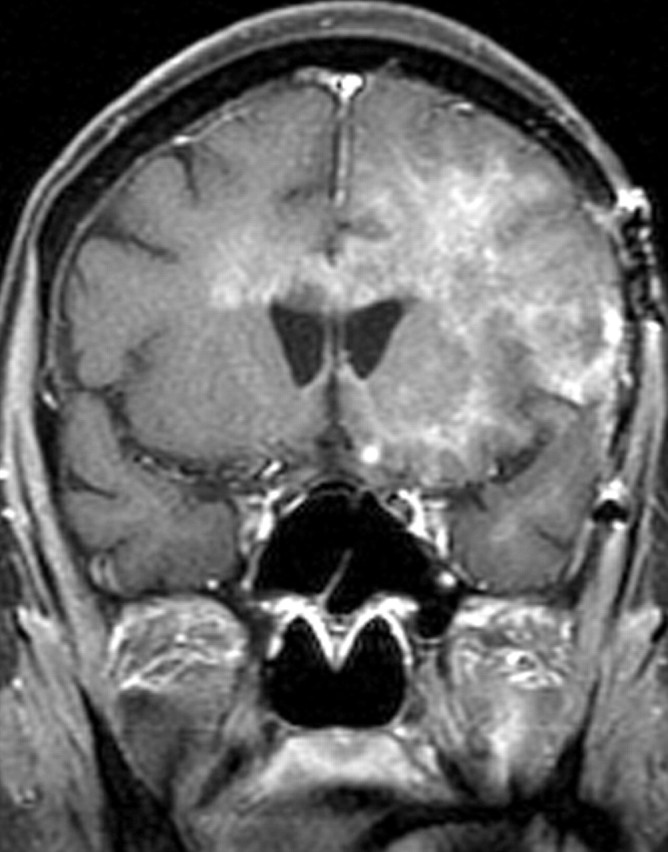
Figure 17.
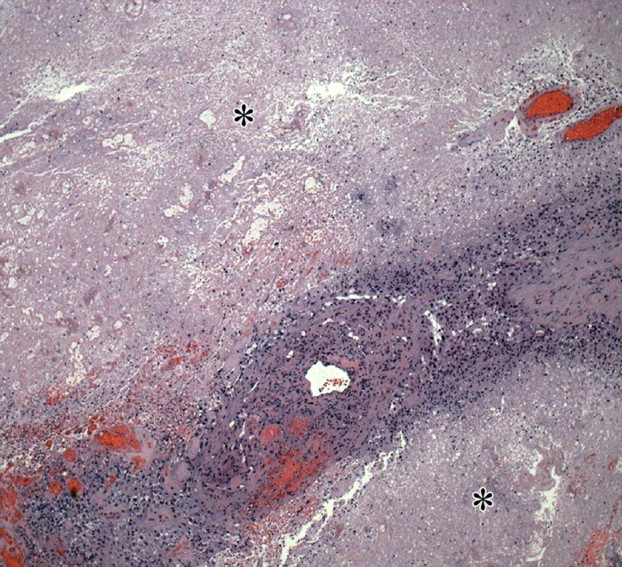
Necrosis in glioblastoma. Low-power (original magnification, ×20; H-E stain) photomicrograph shows a band of densely packed tumor cells separated by two fields of necrotic tissue (∗), a finding indicative of glioblastoma. Necrosis is a pathologic hallmark of glioblastoma and generally results from a combination of rapid proliferation and alterations in the vasculature (including thrombosis), which cannot keep up with the high metabolic needs of the tumor cells.
Further, MR imaging features have been shown to correlate with specific genetic alterations associated with cell survival and apoptosis. A high ratio of enhancing tissue volume to necrotic tissue volume (≥ 1) has been shown to correlate with EGFR overexpression in glioblastoma, a finding that may have utility in selecting patients who may benefit from treatment with EGFR inhibitors (21).
Conclusions
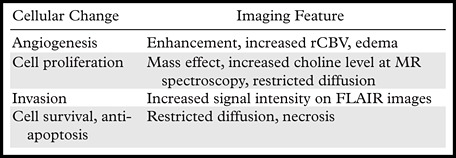
The imaging features of glioblastoma reflect the dysregulation of key pathways, a result of genetic alterations and changes in gene expression (Table 3). Targeted therapy alters the biologic behavior of glioblastoma and its imaging appearance. As we move toward a more individualized approach to therapy for glioblastoma on the basis of its specific genetic and biochemical features, radiologists may contribute to the future development of targeted agents for treatment of glioblastoma.
Table 3.
Potential Imaging Features of Underlying Cellular Changes in Glioblastoma
Acknowledgments
The authors acknowledge the support of Carl Zeiss Surgical GmbH (Oberkochen, Germany) and Medtronic Navigation (Louisville, Ky) for use of the OPMI Pentero operating microscope and StealthStation Treon navigation system, respectively. The authors also acknowledge DUSA Pharmaceuticals (Tarrytown, NY) for supplying the ALA.
Recipient of a Magna Cum Laude award for an education exhibit at the 2010 RSNA Annual Meeting.
D.A.P. and D.W.R. have disclosed financial relationships (see “Disclosures of Potential Conflicts of Interest”); all other authors have no financial relationships to disclose.
Disclosures of Potential Conflicts of Interest.—D.A.P.: Related financial activities: none. Other financial activities: consultant for Orthovita. D.W.R.: Related financial activities: Medtronic data monitoring and safety committee. Other financial activities: patent pending: method and apparatus for depth-resolved fluorescence imaging for tumor identification during surgery; patent pending: feedback controlled deep brain stimulation: selecting sites and neurotransmitters; patent pending: patient registration without fiducials; patent pending: system and method for calibration for image-guided surgery; patent pending: system and method for registering ultrasound and magnetic resonance images; patent pending: system and method for measuring soft tissue material properties in vivo.
Funding: Thework was supported in part by the National Institutes of Health [grant number R01NS052274-01A2].
Abbreviations:
- BCL-2
- B-cell lymphoma 2
- CDKN2A
- cyclin-dependent kinase inhibitor 2A
- DNA
- deoxyribonucleic acid
- EGFR
- epidermal growth factor receptor
- FLAIR
- fluid-attenuated inversion-recovery
- H-E
- hematoxylin-eosin
- HIF-1α
- hypoxia-inducible factor 1 alpha
- IDH1
- isocitrate dehydrogenase 1
- MMP
- metalloproteinase
- mTOR
- mammalian target of rapamycin
- NFκB
- nuclear factor kappa of B cells
- p53
- protein 53
- PDGFR
- platelet-derived growth factor receptor
- PTEN
- phosphatase and tensin homolog
- RAS
- rat sarcoma viral oncogene homolog
- Rb1
- retinoblastoma 1
- rCBV
- relative cerebral blood volume
- RTK
- receptor tyrosine kinase
- TRAIL
- tumor necrosis factor–related apoptosis-inducing ligan
References
- 1.Furnari FB, Fenton T, Bachoo RM, et al. Malignant astrocytic glioma: genetics, biology, and paths to treatment. Genes Dev 2007;21(21):2683–2710. [DOI] [PubMed] [Google Scholar]
- 2.Cancer Genome Atlas Research Network Comprehensive genomic characterization defines human glioblastoma genes and core pathways. Nature 2008;455(7216):1061–1068. [DOI] [PMC free article] [PubMed] [Google Scholar]
- 3.Parsons DW, Jones S, Zhang X, et al. An integrated genomic analysis of human glioblastoma multiforme. Science 2008;321(5897):1807–1812. [DOI] [PMC free article] [PubMed] [Google Scholar]
- 4.Rao SK, Edwards J, Joshi AD, Siu IM, Riggins GJ. A survey of glioblastoma genomic amplifications and deletions. J Neurooncol 2010;96(2):169–179. [DOI] [PubMed] [Google Scholar]
- 5.Jouanneau E. Angiogenesis and gliomas: current issues and development of surrogate markers. Neurosurgery 2008;62(1):31–50; discussion 50–52. [DOI] [PubMed] [Google Scholar]
- 6.Wen PY, Kesari S. Malignant gliomas in adults. N Engl J Med 2008;359(5):492–507. [DOI] [PubMed] [Google Scholar]
- 7.Verhaak RG, Hoadley KA, Purdom E, et al. Integrated genomic analysis identifies clinically relevant subtypes of glioblastoma characterized by abnormalities in PDGFRA, IDH1, EGFR, and NF1. Cancer Cell 2010;17(1):98–110. [DOI] [PMC free article] [PubMed] [Google Scholar]
- 8.Otrock ZK, Mahfouz RA, Makarem JA, Shamseddine AI. Understanding the biology of angiogenesis: review of the most important molecular mechanisms. Blood Cells Mol Dis 2007;39(2):212–220. [DOI] [PubMed] [Google Scholar]
- 9.Azam F, Mehta S, Harris AL. Mechanisms of resistance to antiangiogenesis therapy. Eur J Cancer 2010;46(8):1323–1332. [DOI] [PubMed] [Google Scholar]
- 10.Chi AS, Norden AD, Wen PY. Antiangiogenic strategies for treatment of malignant gliomas. Neurotherapeutics 2009;6(3):513–526. [DOI] [PMC free article] [PubMed] [Google Scholar]
- 11.Friedman HS, Prados MD, Wen PY, et al. Bevacizumab alone and in combination with irinotecan in recurrent glioblastoma. J Clin Oncol 2009;27(28): 4733–4740. [DOI] [PubMed] [Google Scholar]
- 12.Sorensen AG, Batchelor TT, Zhang WT, et al. A “vascular normalization index” as potential mechanistic biomarker to predict survival after a single dose of cediranib in recurrent glioblastoma patients. Cancer Res 2009;69(13):5296–5300. [DOI] [PMC free article] [PubMed] [Google Scholar]
- 13.Mills SJ, Patankar TA, Haroon HA, Balériaux D, Swindell R, Jackson A. Do cerebral blood volume and contrast transfer coefficient predict prognosis in human glioma? AJNR Am J Neuroradiol 2006; 27(4):853–858. [PMC free article] [PubMed] [Google Scholar]
- 14.Barajas RF, Hodgson JG, Chang JS, et al. Glioblastoma multiforme regional genetic and cellular expression patterns: influence on anatomic and physiologic MR imaging. Radiology 2010;254(2): 564–576. [DOI] [PMC free article] [PubMed] [Google Scholar]
- 15.Jain RK, Duda DG, Willett CG, et al. Biomarkers of response and resistance to antiangiogenic therapy. Nat Rev Clin Oncol 2009;6(6):327–338. [DOI] [PMC free article] [PubMed] [Google Scholar]
- 16.Norden AD, Young GS, Setayesh K, et al. Bevacizumab for recurrent malignant gliomas: efficacy, toxicity, and patterns of recurrence. Neurology 2008;70(10):779–787. [DOI] [PubMed] [Google Scholar]
- 17.Paldino MJ, Desjardins A, Friedman HS, Vredenburgh JJ, Barboriak DP. A change in the apparent diffusion coefficient after treatment with bevacizumab is associated with decreased survival in patients with recurrent glioblastoma multiforme. Br J Radiol 2011 Jan 11. [Epub ahead of print] [DOI] [PMC free article] [PubMed] [Google Scholar]
- 18.Pope WB, Kim HJ, Huo J, et al. Recurrent glioblastoma multiforme: ADC histogram analysis predicts response to bevacizumab treatment. Radiology 2009;252(1):182–189. [DOI] [PubMed] [Google Scholar]
- 19.Pope WB, Chen JH, Dong J, et al. Relationship between gene expression and enhancement in glioblastoma multiforme: exploratory DNA microarray analysis. Radiology 2008;249(1):268–277. [DOI] [PMC free article] [PubMed] [Google Scholar]
- 20.Van Meter T, Dumur C, Hafez N, Garrett C, Fillmore H, Broaddus WC. Microarray analysis of MRI-defined tissue samples in glioblastoma reveals differences in regional expression of therapeutic targets. Diagn Mol Pathol 2006;15(4):195–205. [DOI] [PubMed] [Google Scholar]
- 21.Diehn M, Nardini C, Wang DS, et al. Identification of noninvasive imaging surrogates for brain tumor gene-expression modules. Proc Natl Acad Sci U S A 2008;105(13):5213–5218. [DOI] [PMC free article] [PubMed] [Google Scholar]
- 22.Van Meir EG, Hadjipanayis CG, Norden AD, Shu HK, Wen PY, Olson JJ. Exciting new advances in neuro-oncology: the avenue to a cure for malignant glioma. CA Cancer J Clin 2010;60(3):166–193. [DOI] [PMC free article] [PubMed] [Google Scholar]
- 23.Schmidt EE, Ichimura K, Reifenberger G, Collins VP. CDKN2 (p16/MTS1) gene deletion or CDK4 amplification occurs in the majority of glioblastomas. Cancer Res 1994;54(24):6321–6324. [PubMed] [Google Scholar]
- 24.Ueki K, Ono Y, Henson JW, Efird JT, von Deimling A, Louis DN. CDKN2/p16 or RB alterations occur in the majority of glioblastomas and are inversely correlated. Cancer Res 1996;56(1):150–153. [PubMed] [Google Scholar]
- 25.Serrano M, Hannon GJ, Beach D. A new regulatory motif in cell-cycle control causing specific inhibition of cyclin D/CDK4. Nature 1993;366(6456):704–707. [DOI] [PubMed] [Google Scholar]
- 26.Reifenberger G, Reifenberger J, Ichimura K, Meltzer PS, Collins VP. Amplification of multiple genes from chromosomal region 12q13-14 in human malignant gliomas: preliminary mapping of the amplicons shows preferential involvement of CDK4, SAS, and MDM2. Cancer Res 1994;54(16):4299–4303. [PubMed] [Google Scholar]
- 27.Louis DN. The p53 gene and protein in human brain tumors. J Neuropathol Exp Neurol 1994;53(1):11–21. [DOI] [PubMed] [Google Scholar]
- 28.Wang H, Wang H, Zhang W, Huang HJ, Liao WS, Fuller GN. Analysis of the activation status of Akt, NFkappaB, and Stat3 in human diffuse gliomas. Lab Invest 2004;84(8):941–951. [DOI] [PubMed] [Google Scholar]
- 29.Krakstad C, Chekenya M. Survival signalling and apoptosis resistance in glioblastomas: opportunities for targeted therapeutics. Mol Cancer 2010;9:135. [DOI] [PMC free article] [PubMed] [Google Scholar]
- 30.Ekstrand AJ, James CD, Cavenee WK, Seliger B, Pettersson RF, Collins VP. Genes for epidermal growth factor receptor, transforming growth factor alpha, and epidermal growth factor and their expression in human gliomas in vivo. Cancer Res 1991;51(8):2164–2172. [PubMed] [Google Scholar]
- 31.Frederick L, Wang XY, Eley G, James CD. Diversity and frequency of epidermal growth factor receptor mutations in human glioblastomas. Cancer Res 2000;60(5):1383–1387. [PubMed] [Google Scholar]
- 32.Mellinghoff IK, Wang MY, Vivanco I, et al. Molecular determinants of the response of glioblastomas to EGFR kinase inhibitors. N Engl J Med 2005; 353(19):2012–2024. [DOI] [PubMed] [Google Scholar]
- 33.van den Bent MJ, Brandes AA, Rampling R, et al. Randomized phase II trial of erlotinib versus temozolomide or carmustine in recurrent glioblastoma: EORTC brain tumor group study 26034. J Clin Oncol 2009;27(8):1268–1274. [DOI] [PMC free article] [PubMed] [Google Scholar]
- 34.Momota H, Nerio E, Holland EC. Perifosine inhibits multiple signaling pathways in glial progenitors and cooperates with temozolomide to arrest cell proliferation in gliomas in vivo. Cancer Res 2005;65(16):7429–7435. [DOI] [PubMed] [Google Scholar]
- 35.Martínez-Bisbal MC, Celda B. Proton magnetic resonance spectroscopy imaging in the study of human brain cancer. Q J Nucl Med Mol Imaging 2009;53(6):618–630. [PubMed] [Google Scholar]
- 36.Shimizu H, Kumabe T, Shirane R, Yoshimoto T. Correlation between choline level measured by proton MR spectroscopy and Ki-67 labeling index in gliomas. AJNR Am J Neuroradiol 2000;21(4): 659–665. [PMC free article] [PubMed] [Google Scholar]
- 37.Beppu T, Inoue T, Shibata Y, et al. Fractional anisotropy value by diffusion tensor magnetic resonance imaging as a predictor of cell density and proliferation activity of glioblastomas. Surg Neurol 2005;63(1):56–61; discussion 61. [DOI] [PubMed] [Google Scholar]
- 38.Onishi M, Ichikawa T, Kurozumi K, Date I. Angiogenesis and invasion in glioma. Brain Tumor Pathol 2011;28(1):13–24. [DOI] [PubMed] [Google Scholar]
- 39.Drappatz J, Norden AD, Wen PY. Therapeutic strategies for inhibiting invasion in glioblastoma. Expert Rev Neurother 2009;9(4):519–534. [DOI] [PubMed] [Google Scholar]
- 40.Kerbel RS. Tumor angiogenesis. N Engl J Med 2008;358(19):2039–2049. [DOI] [PMC free article] [PubMed] [Google Scholar]
- 41.Leavesley DI, Ferguson GD, Wayner EA, Cheresh DA. Requirement of the integrin beta 3 subunit for carcinoma cell spreading or migration on vitronectin and fibrinogen. J Cell Biol 1992;117(5):1101–1107. [DOI] [PMC free article] [PubMed] [Google Scholar]
- 42.Liu Y, Carson-Walter EB, Cooper A, Winans BN, Johnson MD, Walter KA. Vascular gene expression patterns are conserved in primary and metastatic brain tumors. J Neurooncol 2010;99(1):13–24. [DOI] [PMC free article] [PubMed] [Google Scholar]
- 43.Chamberlain MC. Radiographic patterns of relapse in glioblastoma. J Neurooncol 2011;101(2):319–323. [DOI] [PubMed] [Google Scholar]
- 44.Millar AW, Brown PD, Moore J, et al. Results of single and repeat dose studies of the oral matrix metalloproteinase inhibitor marimastat in healthy male volunteers. Br J Clin Pharmacol 1998;45(1): 21–26. [DOI] [PMC free article] [PubMed] [Google Scholar]
- 45.Araujo J, Logothetis C. Dasatinib: a potent SRC inhibitor in clinical development for the treatment of solid tumors. Cancer Treat Rev 2010;36(6):492–500. [DOI] [PMC free article] [PubMed] [Google Scholar]
- 46.Sciumè G, Santoni A, Bernardini G. Chemokines and glioma: invasion and more. J Neuroimmunol 2010;224(1-2):8–12. [DOI] [PubMed] [Google Scholar]
- 47.Wesolowska A, Kwiatkowska A, Slomnicki L, et al. Microglia-derived TGF-beta as an important regulator of glioblastoma invasion: an inhibition of TGF-beta-dependent effects by shRNA against human TGF-beta type II receptor. Oncogene 2008;27(7):918–930. [DOI] [PubMed] [Google Scholar]
- 48.Hülper P, Schulz-Schaeffer W, Dullin C, et al. Tumor localization of an anti-TGF-β antibody and its effects on gliomas. Int J Oncol 2011;38(1):51–59. [PubMed] [Google Scholar]
- 49.Tabatabai G, Weller M, Nabors B, et al. Targeting integrins in malignant glioma. Target Oncol 2010; 5(3):175–181. [DOI] [PubMed] [Google Scholar]
- 50.Deng Y, Li W, Li Y, et al. Expression of matrix metalloproteinase-26 promotes human glioma U251 cell invasion in vitro and in vivo. Oncol Rep 2010; 23(1):69–78. [PubMed] [Google Scholar]
- 51.VanMeter TE, Rooprai HK, Kibble MM, Fillmore HL, Broaddus WC, Pilkington GJ. The role of matrix metalloproteinase genes in glioma invasion: co-dependent and interactive proteolysis. J Neurooncol 2001;53(2):213–235. [DOI] [PubMed] [Google Scholar]
- 52.Pope WB, Sayre J, Perlina A, Villablanca JP, Mischel PS, Cloughesy TF. MR imaging correlates of survival in patients with high-grade gliomas. AJNR Am J Neuroradiol 2005;26(10):2466–2474. [PMC free article] [PubMed] [Google Scholar]
- 53.Carrillo JA, Lai A, Nghiemphu PL, et al. Non-contrast enhancement in glioblastomas is associated with IDH-1 mutation and multifocality [abstr]. Neuro Oncol 2010;12(Suppl 4):iv113. [Google Scholar]
- 54.Seiz M, Tuettenberg J, Meyer J, et al. Detection of IDH1 mutations in gliomatosis cerebri, but only in tumors with additional solid component: evidence for molecular subtypes. Acta Neuropathol (Berl) 2010;120(2):261–267. [DOI] [PubMed] [Google Scholar]
- 55.Gerstner ER, Chen PJ, Wen PY, Jain RK, Batchelor TT, Sorensen G. Infiltrative patterns of glioblastoma spread detected via diffusion MRI after treatment with cediranib. Neuro Oncol 2010;12(5): 466–472. [DOI] [PMC free article] [PubMed] [Google Scholar]
- 56.Wen PY, Macdonald DR, Reardon DA, et al. Updated response assessment criteria for high-grade gliomas: response assessment in neuro-oncology working group. J Clin Oncol 2010;28(11):1963–1972. [DOI] [PubMed] [Google Scholar]
- 57.Aggarwal BB. Signalling pathways of the TNF superfamily: a double-edged sword. Nat Rev Immunol 2003;3(9):745–756. [DOI] [PubMed] [Google Scholar]
- 58.Lavrik IN, Golks A, Krammer PH. Caspases: pharmacological manipulation of cell death. J Clin Invest 2005;115(10):2665–2672. [DOI] [PMC free article] [PubMed] [Google Scholar]
- 59.Guicciardi ME, Gores GJ. Life and death by death receptors. FASEB J 2009;23(6):1625–1637. [DOI] [PMC free article] [PubMed] [Google Scholar]
- 60.Roth W, Isenmann S, Nakamura M, et al. Soluble decoy receptor 3 is expressed by malignant gliomas and suppresses CD95 ligand-induced apoptosis and chemotaxis. Cancer Res 2001;61(6):2759–2765. [PubMed] [Google Scholar]
- 61.Knight MJ, Riffkin CD, Muscat AM, Ashley DM, Hawkins CJ. Analysis of FasL and TRAIL induced apoptosis pathways in glioma cells. Oncogene 2001;20(41):5789–5798. [DOI] [PubMed] [Google Scholar]
- 62.Gerstner ER, Frosch MP, Batchelor TT. Diffusion magnetic resonance imaging detects pathologically confirmed, nonenhancing tumor progression in a patient with recurrent glioblastoma receiving bevacizumab. J Clin Oncol 2010;28(6):e91–e93. [DOI] [PubMed] [Google Scholar]