

Abstract
Cortical alpha oscillations (8–13 Hz) appear to play a role in suppressing distractions when just one sensory modality is being attended, but do they also contribute when attention is distributed over multiple sensory modalities? For an answer, we examined cortical oscillations in human subjects who were dividing attention between auditory and visual sequences. In Experiment 1, subjects performed an oddball task with auditory, visual, or simultaneous audiovisual sequences in separate blocks, while the electroencephalogram was recorded using high-density scalp electrodes. Alpha oscillations were present continuously over posterior regions while subjects were attending to auditory sequences. This supports the idea that the brain suppresses processing of visual input in order to advantage auditory processing. During a divided-attention audiovisual condition, an oddball (a rare, unusual stimulus) occurred in either the auditory or the visual domain, requiring that attention be divided between the two modalities. Fronto-central theta band (4–7 Hz) activity was strongest in this audiovisual condition, when subjects monitored auditory and visual sequences simultaneously. Theta oscillations have been associated with both attention and with short-term memory. Experiment 2 sought to distinguish these possible roles of fronto-central theta activity during multisensory divided attention. Using a modified version of the oddball task from Experiment 1, Experiment 2 showed that differences in theta power among conditions were independent of short-term memory load. Ruling out theta’s association with short-term memory, we conclude that fronto-central theta activity is likely a marker of multisensory divided attention.
Keywords: Attention, Multisensory, Oscillations, Alpha, Theta, EEG
1 Introduction
At least since James (1890), intentional ignoring has been recognized as integral to selective attention. Numerous studies have investigated intentional ignoring by asking subjects to selectively attend to one stream of information while ignoring other information (e.g., Stroop, 1935). Additionally, investigations of selective attention’s neural underpinnings suggest that the prefrontal cortex biases visual gating in the visual thalamic reticular nucleus (Wimmer et al., 2015), thus performing a critical role in selective attention. Recent work identified cortical oscillations in the alpha band (8–13 Hz) as markers of intentional ignoring (for review, Payne and Sekuler (2014)). Specifically, increased power in the alpha band has been associated with suppression of distracting signals within separate sensory streams, such as vision or audition (Kelly, Lalor, Reilly, & Foxe, 2006; Payne, Guillory, & Sekuler, 2013; Dubé, Payne, Sekuler, & Rotello, 2013; Mazaheri et al., 2014).
Demonstrating alpha oscillations’ role in perceptual discrimination, Mazaheri et al. (2014) found that pre-stimulus alpha power in distinct brain regions predicted the speed of visual and auditory discrimination. Finally, application to the scalp of transcranial magnetic stimulation (TMS) within the alpha frequency range, showed that alpha oscillations were not simply correlated with selective attention but are actually causally involved in the suppression of distracting sensory information (Romei, Gross, & Thut, 2010).
While much previous work on alpha oscillations’ role in sensory suppression has concentrated on task-related oscillatory power (Worden, Foxe, Wang, & Simpson, 2000; Kelly et al., 2006; Thut, Nietzel, Brandt, & Pascual-Leone, 2006; Romei, Rihs, Brodbeck, & Thut, 2008; Romei et al., 2010), recent research has suggested that oscillatory phase and phase-resetting may be critical for attention and ignoring (VanRullen, Busch, Drewes, & Dubois, 2011). For example, posterior alpha phase is shifted just prior to an anticipated visual distractor (Bonnefond & Jensen, 2012), and pre-stimulus phase of posterior alpha activity predicts the success or failure of stimulus detection (Mathewson, Gratton, Fabiani, Beck, & Ro, 2009). It seems, therefore, that fluctuations in cortical excitability, which have been termed “pulsed inhibition” of cortical activity, influence whether information from the environment reaches conscious awareness. Although the relationship between alpha oscillations (both power and phase) and selective attention has been repeatedly demonstrated in a wide variety of tasks, it remains to be clearly demonstrated that alpha oscillations are sustained over time if the sensory input that must be suppressed is a continuous one. We hypothesize that alpha power and phase synchrony will reflect ongoing ignoring of distracting visual information when a task demands attention to an auditory stimulus for an extended period.
For many everyday tasks, selective attention to one sensory modality at a time is critical. However, when attention is directed toward one modality, it may not always possible to shut out completely inputs from a different modality. For example, Keller and Sekuler (2015) presented subjects with simultaneous visual and auditory sequences, instructing them to attend the visual sequence while ignoring the accompanying auditory sequence. Despite this instruction, and despite the performance cost associated with failure to comply, subjects were unable to completely filter out the auditory sequences. Moreover, in tasks that do not entail distracting information in one sensory modality, it is often advantageous to share attention between multiple, concurrent sensory inputs. For example, a driver barreling down the highway while having an urgent conversation on a mobile phone tries to attend to both streams of information, visual and auditory; after all, completely ignoring one in favor of the other would have consequences. Because so many situations require division of attention between audition and vision, we felt it was imperative to investigate the neural mechanisms underlying processing of concurrent auditory and visual sensory streams.
One early study of shared attention’s neural substrate made use of functional magnetic resonance imaging to characterize the neural basis of shared attention (Johnson & Zatorre, 2006). The overall results suggest that while unimodal selective attention involves modulation of sensory specific cortical regions, shared attention recruits frontal areas of the brain. Though this work identifies some brain locations that are involved in multisensory divided attention, the actual mechanism underlying shared attention remains unknown.
Despite abundant, separate research on cortical oscillations and on multisensory attention, little has been done to systematically associate particular cortical oscillations with the allocation of attention among multiple sensory streams. Given the idea proposed by Kopell, Kramer, Malerba, and Whittington (2010) that particular frequency bands of cortical oscillations participate differentially in various cognitive functions, as well as recent research into the mechanisms by which oscillations give rise to cognition (Cannon et al., 2014), we hypothesize that different types of attentional allocation would be associated with different frequency bands of oscillatory activity. Specifically, we hypothesize that theta oscillations (4–7 Hz) play a role in multisensory divided attention, similarly to the way that alpha oscillations play a role in selective ignoring of distracting sensory information. This hypothesis reflects the fact that theta oscillations have been implicated in various functions related to multisensory divided attention, such as audio-visual integration (Sakowitz, Schürmann, & Başar, 2000) and cognitive control (Cooper, Darriba, Karayanidis, & Barceló, 2016; Cavanagh & Frank, 2014; Cavanagh, Frank, Klein, & Allen, 2010).
A recent review by Cavanagh and Frank (2014) summarized the current understanding of theta oscillations’ functional role in what the authors characterized as “cognitive control.” The review noted that studies in humans, monkeys and rats had all implicated frontal-midline theta oscillations in functions such as novelty detection (Cavanagh, Zambrano-Vazquez, & Allen, 2011) and top-down control of memory encoding (Rutishauser, Ross, Mamelak, & Schuman, 2010). That top-control can be viewed as a function that prioritizes “goal directed bias over habitual responses” (Cavanagh & Frank, 2014). It appears that phase resetting of theta oscillations enhances communication among disparate brain regions during cognitive control processes. According to this view, theta oscillations promote the cognitive control needed to prepare the brain’s response to uncertainty about stimulus conditions (Cavanagh et al., 2010).
Klimesch (1996) presented an alternative view of theta cortical oscillations, arguing for a link between those oscillations and memory processes. That view takes account of the fact that anterior theta oscillations have been associated with short-term memory (Klimesch, Doppelmayr, Russegger, & Pachinger, 1996; Arnolds, Da Silva, Aitink, Kamp, & Boeijinga, 1980). In particular, theta power was increased during the encoding of words that would later be correctly recognized, and theta synchrony was higher during a correct recognition response (Klimesch, Doppelmayr, Schimke, & Ripper, 1997). Although previous research on the role of theta oscillations has focused on theta generated in the hippocampus, Klimesch (1996) points out strong bidirectional connections between hippocampus and neocortex, which could explain how recordings of scalp EEG could were able to capture theta activity originating sub-cortically, in the hippocampus. So, several studies have reported increased theta oscillations during various cognitive tasks, but few have tried to select between competing hypotheses for the function of theta oscillations. And none has done so successfully. Therefore, an important next step will be to differentiate or reconcile these competing views.
2 Experiment 1
To investigate oscillatory activity associated with multi-sensory divided attention, we used a high-density array of scalp electrodes to capture electroencephalographic (EEG) signals while subjects were presented with Auditory, Visual, or concurrent Audio-Visual sequences. Into a few of these sequences, an unusual (“oddball”) stimulus was occasionally inserted (Squires, Squires, & Hillyard, 1975; A. Noyce & Sekuler, 2014). Subjects attended to each sequence, but made a response only when an oddball occurred. Responses were signaled by pressing a key on a keyboard.
For Auditory sequences, the oddball was an unusual auditory stimulus; for Visual sequences, the oddball was an unusual visual stimulus; for the divided-attention Audio-Visual condition, the oddball could occur in either the auditory or the visual domain. This required that in the Audio-Visual condition, attention be paid to both modalities. As performance at the oddball task would be undermined by a lapse in attention, we fashioned the characteristics of the oddball task so that subjects were likely to perform at ceiling in all conditions, rarely missing or responding slowly to an oddball stimulus. We took this as a marker of successful sustained attention.
In our experiments, stimuli were presented as sequences of events. We took care that the sequences of all types would be presented at a rate that was slow enough not to advantage auditory processing, which has a high temporal frequency cut off, over visual processing, which has a relatively low temporal frequency cut off (Freides, 1974; Welch & Warren, 1980; A. L. Noyce, Cestero, Shinn-Cunningham, & Somers, 2016).
3 Methods
3.1 Subjects
Twenty-seven subjects gave written informed consent and completed the experiment. Data from eight of these subjects were excluded from analysis because of excessive EEG artifacts, that is epoch rejection rate > 20%. Additionally, one subject’s data was excluded because after testing, he acknowledged having an attentional deficit. Of the remaining eighteen subjects, 9 were female and 9 were male. All subjects were between 18 and 24 years old, were right-handed as characterized by the Edinburgh Handedness Inventory (Oldfield, 1971), had normal or corrected-to-normal visual acuity (Snellen visual acuity 20/40 or better), and had clinically-normal hearing, e. g., pure tone thresholds at 0.25, 0.5, 1, 2, 4 and 8 kHz of at least 20 dBSPL in the better ear (Mueller & Hall, 1998). Each received $30 (U.S.) for participation.
3.2 Stimuli
An experimental session comprised 360 trials organized into six blocks, with two blocks devoted to each type of sequence. Figure 1 shows schematic representations of events in each sequence type, Visual, Auditory, and Audio-Visual. On 20% of all trials, as explained below, a oddball was inserted into a sequence. Descriptions of stimuli in each condition can be found in Table 1.
Figure 1.

Diagram depicting visual and auditory sequences in which oddball stimuli are embedded. Note that luminance-levels and pitches in this diagram are meant for illustrative purposes only. For graphical purposes, changes in loudness are represented here by changes in brightness.
Table 1.
Descriptions of the conditions in Experiment 1
| Condition | Sequence makeup | Oddball identity |
|---|---|---|
| Auditory | 250 Hz tones, varying in loudness | 350 Hz tone |
| Visual | Square regions, varying in brightness | Red disc |
| Audio-Visual | Concurrent Auditory and Visual sequences | Either red disc or 350 Hz tone |
Unimodal Visual sequences comprised eight luminances presented to a single square region ~ 8.5° per side. The luminances in a sequence were chosen randomly from the set [2, 15, 29, and 46 cd/m2]. Within a sequence, each of the four possible luminances was presented exactly twice, in random order. Stimulus were displayed on a 21-inch ViewSonic cathode ray tube monitor, set to an 85 Hz frame rate, and screen resolution of 1600 × 1200 pixels. The screen’s background luminance was clamped at 20 cd/m2. Subjects were instructed to respond by pressing the spacebar on a computer keyboard when they saw a visual oddball (a red disc in place of one of the squares in the sequence), while withholding responses otherwise.
Unimodal Auditory sequences consisted of eight 250 Hz tones delivered in succession through Bose Companion 2 Series III speakers. These were located 75 cm apart centered on the subject’s mid-sagittal plane and 92 cm from the subject’s head. The tones in a sequence were chosen randomly from four possible loudness levels, 50, 57, 65, and 73 phons; 50–70 dBSPL. Each of the four possible loudness levels appeared exactly twice on each trial, in random order. Subjects were instructed to respond as rapidly as possible to each auditory oddball (a 350 Hz tone in place of one of the tones in the sequence), while withholding responses otherwise.
Audio-Visual sequences comprised synchronous presentation of both a visual and an auditory sequence, which were described in the preceding two paragraphs. On trials with Audio-Visual sequences, subjects were instructed to respond as rapidly as possible to the presentation of an oddball stimulus, which could be either a visual oddball (a filled red disc) or an auditory oddball (a higher-pitched tone). The two types of oddballs occurred randomly and with equal frequency, 10% visual oddballs and 10% auditory oddballs. Subjects were informed that on a given trial, an oddball might occur in either sensory domain, but not in both.
To ensure that the first item in a sequence was not missed by the subject, sequences were designed so that neither the lowest luminance-level (7 cd/m2) nor the quietest tone (50 phons) appeared as the first item in a sequence.
Because of a programming error discovered only after analysis of Experiments 1 and 2 had been completed, the presentation rates of the eight items comprising a stimulus sequence varied somewhat from trial to trial. Moreover, the distributions of these randomly generated presentation rates varied by condition. The rate of presentation of the eight items in a Visual trial had a mean of ~4.84 Hz and standard deviation of ~0.23 Hz. The rate of presentation of the eight items in an Auditory trial had a mean ~5.22 Hz and standard deviation ~0.36 Hz. The rate of presentation of the eight items in an Audio-Visual trial had a mean ~6.18 Hz and standard deviation ~0.40 Hz. The General Discussion addresses the implications of this error for the interpretation of the results. As trial-to-trial differences in presentation rate produced variation in the precise timing of the end of the stimulus presentation, we analyzed EEG signals during the interval of 1000 ms following stimulus onset for all trials to maintain consistency in epoch length. This allowed us to examine whether alpha oscillations continue for a full second during selective attention as well as whether theta oscillations are present upon the onset of synchronous auditory and visual stimuli.
3.3 Procedure
Before beginning the experiment, all subjects completed 30 practice trials, 10 each of Visual, Auditory and Audio-Visual in the same order as the blocks would be presented during the experiment. Of these sequences, 30% contained an oddball. Subjects then participated in six blocks of trials: two blocks each of Visual, Auditory and Audio-Visual. In every block, 20% of the trials included an oddball stimulus in the sequence. The random order for the first three blocks was counterbalanced across subjects, and the final three blocks repeated the order of the first three blocks. Unimodal blocks consisted of 50 trials, 10 of which contained oddballs; Audio-Visual blocks consisted of 80 trials with 16 oddballs (eight visual, eight auditory). This imbalance in the total number of trials per block was meant to bring the number of visual and auditory oddballs in Audio-Visual blocks close to the number of oddballs in Visual or Auditory blocks. Self-paced breaks were allowed between each block as well as half-way through each block. Electrode impedances were checked midway through the experiment and adjusted to <50 kΩ.
Each trial began with a fixation cross in the center of the screen. One second later, the sequence of eight items, Auditory, Visual or Audio-Visual, began. Responses to oddballs were allowed at any time during the stimulus presentation, or up to one-second after the sequence’s end. A response made during the stimulus presentation terminated the sequence. When either a response was made or the time-window for response had elapsed, the color of the fixation point changed for 350 ms to provide feedback to the subject. If the response had been correct (either a response to an oddball, or correctly withholding a response if there been no oddball), the fixation cross turned green; if the response had been incorrect (either a missed oddball or a false positive), the fixation cross turned red during the feedback interval.
3.4 EEG Recording and Analysis
Electroencephalographic (EEG) signals were recorded from the scalp using a high-density, 129-electrode array (Electrical Geodesics, Inc.) and high-impedance amplifiers. All channels were adjusted for scalp impedance < 50 kΩ. Signals were sampled at 250 Hz with a 0–125 Hz analogue bandpass filter, and stored for offline analysis. Bipolar periocular channels were recorded from above and below each eye, and from a location near the outer canthus of each eye. EEG signals were preprocessed using the EEGLAB toolbox (Delorme & Makeig, 2004) for Matlab (Mathworks). The recorded signals were re-referenced to the grand average. A 0.5 Hz Butterworth high-pass filter and a 60 Hz Parks-McClellan notch filter were applied. Eye blinks were identified by visual inspection of independent component analysis (ICA) and eliminated. Epochs containing muscle artifacts or saccades, identified through ICA and visual inspection, were rejected. Wavelet analysis and plotting were performed using the FieldTrip Matlab toolbox 2013-10-24 (Oostenveld, Fries, Maris, & Schoffelen, 2011).
Time-frequency representations were computed using Morlet wavelets with a width of 4 cycles per wavelet at center frequencies between 1 and 70 Hz, in 1 Hz steps. We initially calculated wavelet theta and alpha power for each electrode during epochs extending from 600 ms prior to stimulus onset through 1600 ms after the onset of a sequence, before selecting narrower time epochs for analysis. In all presentations of results, “0 ms” refers to the time point of stimulus onset, that is the moment at which the first item of an eight-item sequence began was presented. Theta and alpha power values were log transformed in order to better approximate a normal distribution. Note that all analyses of EEG activity excluded trials in which an oddball occurred.
Based on prior work investigating alpha oscillations’ involvement in selective attention (Payne et al., 2013), we selected an a priori cluster of electrodes in the posterior region of the scalp (E62, E66-67, E70-72, E76-77, and E83-84). This cluster centers on electrode ‘Pz’ and includes symmetrical regions to the left and right of this electrode. For our analyses of theta activity associated with divided attention, we chose a second a priori cluster of electrodes in the fronocentral region of the scalp (E5-7, E12-13, E106, and E112). Based on previous investigations of the frontal-midline theta rhythm and its involvement in cognitive control (Cohen & Donner, 2013), we centered this cluster on electrode ‘Fz’ and included a circular region around this electrode. The posterior and anterior clusters are depicted in the topography plots of Figures 2 and 5.
Figure 2.
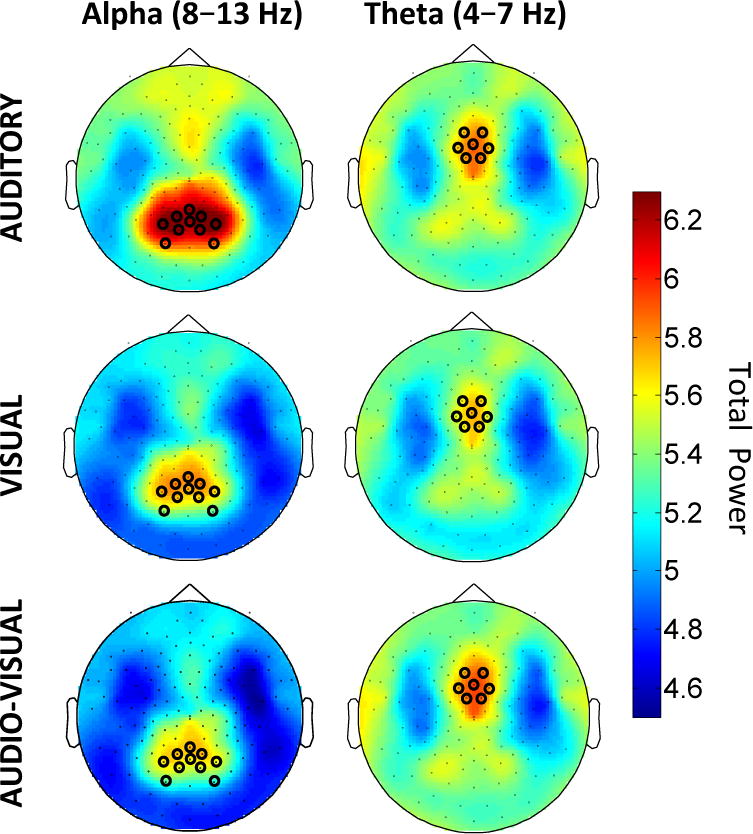
Topographies of log-transformed alpha-band (8–13 Hz) power (left) and theta-band (4–7 Hz) power (right) for each of the three conditions (top: Auditory, middle: Visual, bottom: Audio-Visual) during the first second of the stimulus presentation (0–1000 ms). Black circles mark electrode clusters of interest.
Figure 5.
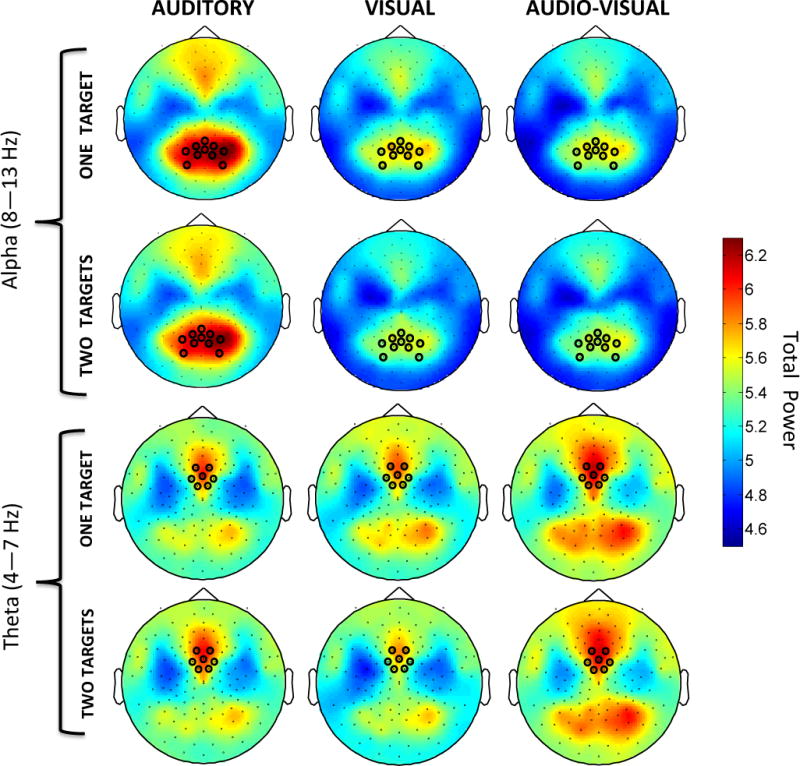
Topographies of log-transformed alpha (top) and theta (bottom) power for each of the six conditions (left: Auditory, middle: Visual, right: Audio-Visual; alternating rows for LowSTM (one target) and HighSTM (two targets) variations) during the first second of the stimulus. Black circles mark electrode clusters of interest chosen a priori.
We also analyzed the inter-trial phase coherence (ITPC) of the recorded activity within our electrode clusters of interest and within particular frequency ranges of interest (either alpha or theta) (Lachaux, Rodriguez, Martinerie, & Varela, 1999). We calculated ITPC values using the FieldTrip Matlab toolbox (Oostenveld et al., 2011), which calculated a Fourier spectrum of the data and used this spectrum to determine phase coherence at a particular frequency. The formula, adopted from Delorme and Makeig (2004), is shown in Equation 1, where || represents the complex norm, k represents a given trial, and f represents a particular frequency. If, at a given time point, the oscillatory activity in a particular frequency band across trials and across participants forms a uniform distribution, then the ITPC value will be zero. Alternatively, if the oscillatory activity in the particular frequency band is at the same phase across all trials and participants, this would yield an ITPC value of one. The ITPC therefore provides a measure of the consistency of the oscillations we observed, and may provide insight into the importance of phase in the mechanisms underlying attention. ITPC values that considered relatively high in recent work with human subjects range from approximately 10% to 20% (Behroozi, Daliri, & Shekarchi, 2016; Almeida et al., 2016).
| (1) |
4 Results
4.1 Behavior
In all conditions, oddball stimuli were detected at rates very near or at ceiling. Mean hit rates were: Visual, ~1.00; Auditory, 0.93; Visual oddball in Audio-Visual, 0.98; and Auditory oddball in Audio-Visual, 0.97). Only four of the 18 subjects made any false positive responses whatever (2, 2, 1, and 5 each, out of a total of 360 trials). The fact that oddball detection was near ceiling indicates that subjects had no apparent difficulty with attending to the stimulus sequences. Moreover, because an oddball item could replace any of the eight items in a given trial, these hit rates also imply that subjects were alert during the entire sequence rather than just at the beginning.
4.2 Alpha band oscillations
As shown in the left-hand column of Figure 2, topographies of alpha activity during the first second of stimulus presentation (0 ms – 1000 ms) showed that alpha activity was consistently present over posterior regions, including within the posterior cluster of electrodes chosen a priori. While posterior alpha power was high in the Auditory condition during the stimulus, in the Visual and Audio-Visual conditions posterior alpha power decreased following stimulus onset. This difference is apparent also in the time-frequency transforms for the posterior cluster of electrodes (see the top row of Figure 3).
Figure 3.
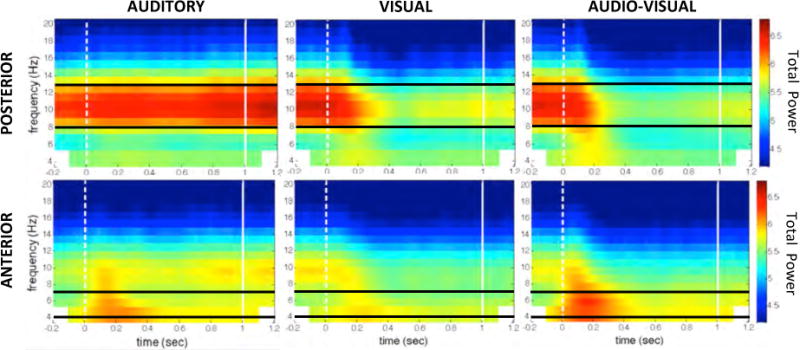
Top Row: Time-frequency transforms of the posterior electrode cluster for each of the three conditions (Auditory, Visual and Audio-Visual). Dotted white line represents stimulus onset; solid white line represents one second after stimulus onset. Horizontal black lines bracket the alpha frequency band (8–13 Hz). Bottom Row: Time-frequency transforms of the anterior electrode cluster for each of the three conditions (Auditory, Visual and Audio-Visual). Dotted white line represents stimulus onset; solid white line represents one second after stimulus onset. Horizontal black lines represent the theta frequency band analyzed (4–7 Hz).
A repeated-measures ANOVA compared alpha power in the posterior electrode cluster during stimulus sequences in all three conditions (Auditory, Visual, and Audio-Visual). The result confirmed that alpha power varied significantly with condition (F (2, 34) = 20.61, p < .001, ). Post-hoc tests revealed that this main effect was driven by higher posterior alpha power in the Auditory condition as compared to the Visual and Audio-Visual conditions (Tukey HSD, both p < .01, d = .55 and .67 respectively). As previous experiments had implicated alpha activity in selective ignoring of task-irrelevant information (Foxe, Simpson, & Ahlfors, 1998; Gomez-Ramirez et al., 2007; Mathewson et al., 2009; Snyder & Foxe, 2010; Payne & Sekuler, 2014), the continuous posterior alpha activity seen during Auditory trials is likely a marker of the suppression of visual input, perhaps so as to advantage auditory input.
4.3 Theta-band oscillations
The spatial distribution and temporal dynamics of theta-band (4–7 Hz) activity are strikingly different from that seen in the alpha band. The topographical displays in the right-hand column of Figure 2 show that theta activity is most pronounced in fronto-central regions, including within the cluster of electrodes selected a priori. Time-frequency transforms over this significant anterior cluster, shown in the bottom row of Figure 3, confirm that fronto-central theta power, especially in the Audio-Visual condition, is highest after stimulus onset and dissipates thereafter.
As explained previously, we expected that theta power would be highest in the Audio-Visual condition, reflecting theta’s involvement in multisensory divided attention. To test this, a repeated-measures ANOVA examined theta power in the anterior cluster of electrodes in the three conditions (Auditory, Audio-Visual, Visual). The results show a significant main effect of condition (F (2, 34) = 6.84, p = .003, ). A post-hoc comparison between the Audio-Visual and the Visual conditions reveal significantly higher theta power in the Audio-Visual trials (Tukey HSD, p < .01, d = .46). This confirms the notion that fronto-central theta power increases during the presentation of a stimulus that necessitates simultaneous auditory and visual attention.
5 Discussion
Using both unisensory and multi-sensory attention tasks, we characterized the cortical oscillations associated with selective attention and multisensory divided attention. These results may be explained by the idea that, in order to advantage processing of auditory inputs, persisting alpha oscillations contribute to suppression of task-irrelevant visual information. Additionally, we found that evoked theta oscillations are associated with the allocation of attention between equally task-relevant visual and auditory streams of information.
In Auditory, Visual, and Audio-Visual conditions, posterior alpha power appeared high prior to the start of the stimulus sequence. However, only in the Auditory condition did alpha oscillations persist throughout the entire duration of the stimulus. The appearance of alpha oscillations before the stimulus is consistent with previous research showing that increased pre-stimulus alpha power can serve a preparatory function in some attention tasks, such that pre-stimulus alpha power is predictive of subsequent performance (Haegens, Luther, & Jensen, 2012; Dubé et al., 2013; Payne et al., 2013). Our results show that the power of posterior alpha oscillations diminishes rapidly upon onset of a visual stimulus. Specifically, alpha power decreases and alpha phase desynchronizes. This is consistent with prior results showing that cortical alpha oscillations desynchronize with eye-opening, a phenomenon noted during the first recordings of scalp EEG, and known after the discoverer as the “Berger Effect” (Kirschfeld, 2005). However, alpha oscillations that we saw during an entire Auditory stimulus may do more than simply reflect the absence of visual stimuli. Previous research suggests that the continuous alpha power seen during the Auditory stimuli represents active visual ignoring. Payne et al. (2013) showed that in a visual cued attention task, posterior alpha oscillations represented the suppression of to-be-ignored stimuli. In their paradigm, alpha power during a stimulus that was to be ignored was a good predictor of recall accuracy for a stimulus that was to be remembered, showing that alpha oscillations were related to a suppression of intrusion of distracting information. As our subjects were instructed to maintain fixation on the cross in the center of the screen during the Auditory blocks, it may be that they adopted a strategy of suppressing distracting visual input to advantage the task-relevant auditory input. On this assumption, because no background auditory stimulus was present during Visual trials, it may not be surprising that the analogous effect of auditory ignoring was not seen. In fact, one would also not expect continuous alpha power in the Audio-Visual condition because the task mandated that subjects attend to both streams of information. Future studies may confirm this interpretation by examining changes in alpha power when simultaneous auditory and visual sequences are presented and subjects are instructed to selectively attend either the auditory or visual sequence on each trial.
The finding that alpha activity persists during an entire one-second long period of selective ignoring challenges a current view of the mechanisms that underlie auditory selective attention. Specifically, this finding reinforces the idea that attention is not simply a matter of focusing on relevant information, but that it also reflects suppression of irrelevant information, a view that is consistent with prior work (for review, Payne and Sekuler (2014)) and the early conceptualizations of attention proposed by James (1890). By showing that auditory attention involves suppression of visual information, this result projects ideas about selective attention into a multisensory context. Specifically, the result is consistent with the view from work on multisensory processing that information in one sensory modality can influence perception and memory for information from another modality (Keller & Sekuler, 2015; Teramoto, Kobayashi, & Hidaka, 2013; Hidaka et al., 2009; Sekuler, Sekuler, & Lau, 1997; Shams, Kamitani, & Shimojo, 2000; Shipley, 1964; Teramoto, Hidaka, & Sugita, 2010; McGurk & MacDonald, 1976). In other words, suppression of irrelevant information in one sensory modality can advantage the processing of information in another sensory modality.
Our results showed that fronto-central theta power is greatest when a task requires that subjects divide attention between concurrent auditory and visual streams of information. Time-frequency transforms (shown in the bottom row of Figure 3) revealed that theta activity is evoked by stimulus onset, and is highest at the beginning of the stimulus presentation. Although scalp EEG does not lend itself to precise source-localization, prior research utilizing structural neuro-imaging techniques such as MEG have indicated that fronto-central theta oscillations typically emerge from the vicinity of the mid-cingulate cortex, and show up at fronto-central scalp electrodes, as in the present study (Loose, Kaufman, Auer, & Lange, 2003).
Though theta power was clearly highest in the Audio-Visual condition, as shown in Figure 3, it is worth noting that theta oscillations in the Auditory condition followed a time course similar to that for Audio-Visual. This similarity may have come from the fact that some visual stimulation, though task-irrelevant, was nonetheless present in the Auditory condition. Subjects performed the task in a normally-lit room rather than in total darkness, and were told to maintain fixation on a cross in the center of the screen. Therefore, it may be that subjects were attending to both visual and auditory information, though perhaps not to the extent demanded by the Audio-Visual condition. As there was no equivalent auditory background noise during Visual trials, it follows that this theta marker of multisensory divided attention would be observed least in the Visual condition.
Although our results show that consistent theta-band activity occurs during multi-sensory divided attention, they do not identify the specific function that these oscillations play. The rapid onset of theta oscillations seen only during the first 250 ms of the Audio-Visual stimulus (see Figure 3) suggests that theta is associated with preparation to attend to multiple sensory modalities, perhaps by facilitating communication with other parts of the brain. This hypothesis is supported by demonstrations that cortical oscillations in the alpha and theta frequency bands reflect signals arising from distinct sub-regions of thalamus, and that each of those sub-regions can in turn be modulated by frontal cortex (Ketz, Jensen, & O’Reilly, 2014). Followup studies might apply functional connectivity analysis (Friston, 2011) to determine which areas of the brain are the targets of the phase-locked fronto-central theta oscillations that we observed.
6 Experiment 2
Though the results of Experiment 1 show that theta oscillations are associated with the multisensory divided attention of an oddball task, they do not necessarily implicate cortical theta oscillations in divided attention, specifically. One critical confound is with multi-item short-term memory. The oddball task used in the present experiment could plausibly recruit a template-matching strategy, with which subjects could hold templates in memory of the higher-pitch tone and red disc, and match each new item to that template to determine whether an oddball is present. If this is the case, then the Audio-Visual condition differs from the Auditory and Visual conditions on another dimension: the number of oddball templates held in mind (two, one visual and one auditory, as opposed to just one or the other). As theta oscillations have previously been associated with short-term memory (Klimesch et al., 1996; Arnolds et al., 1980), it will be imperative to test whether any theta oscillations observed during the audio-visual task are due to this increase in short-term memory load (the number of oddball targets held in mind) or the increase in the number of sensory streams (the difference between unisensory attention and multisensory attention). To disentangle whether the previously observed fronto-central theta oscillations are associated with divided attention or increased short-term memory load, we conducted a follow-up experiment using a modified version of the same task. In this experiment, we independently manipulated the number of oddball targets that could appear in a given block of trials and the number of sensory streams to be attended.
7 Methods
7.1 Subjects
Thirty-four subjects gave written informed consent and completed the experiment. Data from ten of these subjects were excluded from analysis due to excessive EEG artifacts (epoch rejection rate > 20%). Of the remaining twenty-four subjects, 18 were female and 6 were male. All were between 19 and 28 years old, were right-handed as characterized by the Edinburgh Handedness Inventory (Oldfield, 1971), had normal or corrected-to-normal visual acuity (Snellen visual acuity 20/40 or better), and had clinically-normal hearing, e.g., pure tone thresholds at 0.25, 0.5, 1, 2, 4 and 8 kHz of at least 20 dBSPL in the better ear (Mueller & Hall, 1998). Each received $30 (U. S.) for participation.
7.2 Stimuli
The experiment comprised 480 trials organized into six separate blocks. As in Experiment 1, two blocks each were devoted to Auditory, Visual, and Audio-Visual stimuli. To investigate the influence of short-term memory load on oscillatory activity, we varied the number of possible oddballs that could occur for each of the two blocks per condition. One block of trials for each condition contained a single oddball target (Low Short-Term Memory Load: LowSTM), while the second block of trials for each condition contained two possible oddball targets (High Short-Term Memory Load: HighSTM). Figure 4 illustrates the sequence types within both the Low and High Short-Term Memory Load conditions for Auditory, Visual, and Audio-Visual conditions. An oddball was inserted on 20% of trials, and subjects were instructed to respond as rapidly as possible with a spacebar press when they detected an oddball, as before. Descriptions of stimuli in each condition for Experiment 2 can be found in Table 2.
Figure 4.
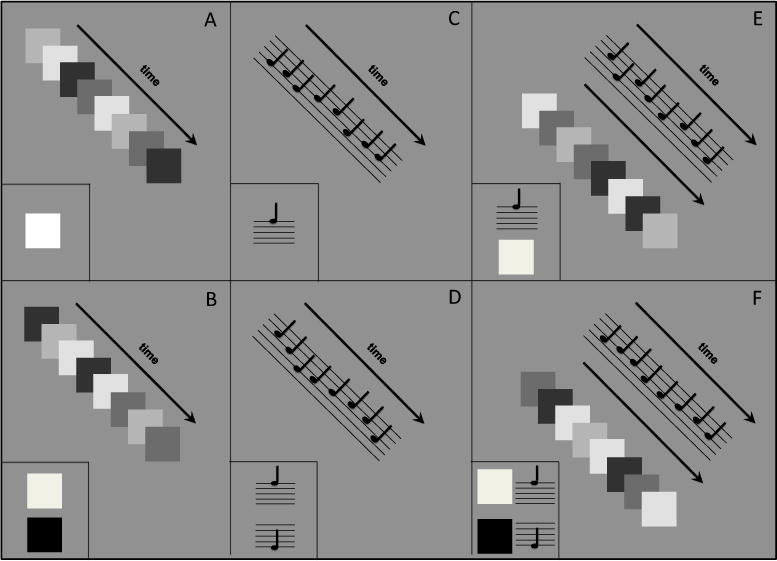
Diagram depicting visual and auditory sequences in which oddball stimuli are embedded for each of the six conditions in Experiment 2. Note that luminance-levels and pitches in this diagram are meant for illustrative purposes only. Each panel shows an example trial sequence, as well as examples of possible oddball targets which could replace one of the eight items in a sequence, shown in the bottom left corner of the panel. Panel A: an example visual sequence for the LowSTM Visual condition, and the single oddball target (an especially bright square). Panel B: an example visual sequence for the HighSTM Visual condition and the two oddball targets (an especially bright square or an especially dark square). Panel C: an example auditory sequence for the LowSTM Auditory condition and the single oddball target (an especially high pitch). Panel D: an example auditory sequence for the HighSTM Auditory condition and the two oddball targets (an especially high pitch or an especially low pitch). Panel E: an example audio-visual sequence for the LowSTM Audio-Visual condition and the two oddball targets (an especially high pitch or an especially bright square). Panel F: an example audio-visual sequence for the HighSTM Audio-Visual condition and the four oddball targets (an especially bright square, an especially dark square, an especially high pitch, or an especially low pitch).
Table 2.
Descriptions of the conditions in Experiment 2
| Condition | Sequence Makeup | One Oddball Target | Two Oddball Targets |
|---|---|---|---|
| Auditory | Pure tones, varying in pitch | 2757 Hz tone | 2757 or 1100 Hz tone |
| Visual | Square regions, varying in brightness | 70 cd/m2 square region | 70 or 10 cd/m2 square region |
| Audio-Visual | Concurrent Auditory and Visual sequences | 70 cd/m2 square region or 2757 Hz tone | 70 cd/m2 square region, 10 cd/m2 square region, 2757 Hz tone or 1100 Hz tone |
Unimodal Visual sequences consisted of eight square regions, as in Experiment 1. The luminances in the square regions in a sequence were chosen randomly from the set [14.48, 17.08, 23.25, 26.86 cd/m2]. In a Visual sequence, each of the four possible luminances was presented exactly twice, in random order. In the LowSTM condition, an oddball was an especially bright square (70 cd/m2). In the HighSTM condition, a visual oddball could be either an especially bright square (70 cd/m2) or an especially dark square (10 cd/m2), but never both within a single trial. As the results from a pilot test showed no difference in performance among the two possible oddball types, we presented only the especially bright square in the LowSTM condition.
Unimodal Auditory sequences consisted of eight tones, presented at ~70 dBSPL. Tones varied over four possible frequencies (2195, 1949, 1724, and 1519 Hz), and each of the four possible frequencies appeared exactly twice in random order on each trial. In the LowSTM condition, an oddball was an especially high pitch (2757 Hz). Although 2757 Hz is not an especially high pitch generally, it is considerably higher than the other items which make up the stimulus sequence. In the HighSTM condition, an auditory oddball could be either an especially high pitch (2757 Hz) or an especially low pitch (1100 Hz) compared to the other items in the sequence, but never both within a single trial. As the results from a pilot test showed no difference in performance among the two possible oddball types, we presented only the especially high pitch in the LowSTM condition.
Audio-Visual sequences comprised synchronous presentation of both a visual and an auditory sequence, as described in the preceding two paragraphs. In the LowSTM condition, oddball stimuli were either a visual oddball (an especially bright square at 70 cd/m2) or an auditory oddball (an especially high-pitched tone at 2757 Hz). In the HighSTM condition, there were four possible oddball types: a bright square (70 cd/m2), a dark square (10 cd/m2), a high-pitched tone (2757 Hz) or a low-pitched tone (1100 Hz). In both the HighSTM and LowSTM conditions, 10% visual oddballs and 10% auditory oddballs were presented. Subjects were informed that on a given trial, an oddball might occur in either sensory domain, but not both.
To ensure that the first item in a sequence would not be missed by the subject, all sequences were designed so that neither the lowest luminance-level (14.48 cd/m2) nor the lowest pitch (1519 Hz) could appear as the first item in a sequence. As was the case for Experiment 1, the presentation rate of the eight items in a stimulus sequence in Experiment 2 varied from trial to trial and these distributions of rates varied among conditions: LowSTM Auditory: mean ~5.22 Hz, standard deviation ~0.35 Hz, HighSTM Auditory: mean ~5.32 Hz, standard deviation ~0.25 Hz, LowSTM Visual: mean ~4.87 Hz, standard deviation ~0.22 Hz, HighSTM Visual: mean ~4.90 Hz, standard deviation ~0.22 Hz, LowSTM Audio-Visual: mean ~6.21 Hz, standard deviation ~0.39 Hz, HighSTM Audio-Visual: mean ~6.17 Hz, standard deviation ~0.39 Hz.
7.3 Procedure
Before beginning the experiment, all subjects completed 60 practice trials (10 of each condition: LowSTM Auditory, HighSTM Auditory, LowSTM Visual, HighSTM Visual, LowSTM Audio-Visual, HighSTM Audio-Visual) containing 30% oddballs. Each subject then participated in six blocks of trials: two blocks each of Visual, Auditory and Audio-Visual for which one block was LowSTM (one oddball target was possible) or HighSTM (two possible oddball targets for each sensory modality were possible). The random order of sensory conditions (Auditory, Visual, and Audio-Visual) for the first three blocks was counterbalanced across subjects, and the final three blocks occurred in the same order as the first three blocks. For half of the subjects, the first three blocks were set in the LowSTM condition (one possible oddball target for each sensory modality) and the second three blocks were set in the HighSTM condition (two possible oddball targets for each sensory modality), and for the other half of the subjects this order was reversed. The counterbalancing of sensory conditions and the conditions of short-term memory load yielded twelve possible orders (2 subjects were tested in each order, making a total of 24 subjects). All blocks consisted of 80 trials with 16 oddballs (for Audio-Visual blocks: eight visual, eight auditory). Self-paced breaks were given between each block as well as half-way through each block. Electrode impedance was checked twice during the experiment, after the second and fourth blocks were completed. Trials were structured in the same manner as in Experiment 1. Electroencephalographic (EEG) signals were recorded from the scalp and analyzed in the same manner as in Experiment 1. To demonstrate the remarkable consistency of the effects reported, we present topographical plots and time-frequency transforms of EEG recordings for Experiment 2 using the same anterior and posterior electrode clusters that were defined in Experiment 1.
8 Results
8.1 Behavior
As in Experiment 1, the rate at which oddball stimuli were detected was at or very near ceiling in all conditions (Mean hits: LowSTM Auditory = .98, LowSTM Visual = 1.00, Auditory in LowSTM Audio-Visual = .99, Visual in LowSTM Audio-Visual = .98, HighSTM Auditory = .99, HighSTM Visual = 1.00, Auditory in HighSTM Audio-Visual = 1.00, Visual in HighSTM Audio-Visual = .98). Only fifteen of the twenty-four subjects made any false positive responses (an average of 4.3 false positives each, out of a total of 480 trials). The fact that oddball detection was near ceiling, as it had been in Experiment 1, confirms that subjects had been successfully attending to the stimulus sequences.
8.2 Alpha band oscillations
As shown in the top half of Figure 5, topographies of alpha activity during the first second of the stimulus (0 ms – 1000 ms) in each of the six conditions (LowSTM Auditory, HighSTM Auditory, LowSTM Visual, HighSTM Visual, LowSTM Audio-Visual, HighSTM Audio-Visual) show that alpha activity was consistently present over posterior regions. While posterior alpha activity in the Auditory condition has consistently high power, the posterior alpha activity in the Visual and Audio-Visual conditions is significantly diminished following stimulus onset. This difference is made even more apparent in the time-frequency transforms (see Figure 6). As expected, the alpha activity is comparable between the low (top row) and high (bottom row) short-term memory load conditions.
Figure 6.

Time-frequency transforms for each of the six conditions (Columns: Auditory, Visual and Audio-Visual, Rows: LowSTM (one target) and HighSTM (two targets)) in Experiment 2, averaged over the same posterior cluster of electrodes as in Experiment 1. Dotted white line represents stimulus onset; solid white line represents one second after stimulus onset. Horizontal black lines bracket the alpha frequency band (8–13 Hz).
A 3 × 2 repeated-measures ANOVA compared alpha power for the three conditions (Auditory, Visual, Audio-Visual) and two short-term memory loads (high, low). Results show a significant main effect of condition (F(2, 46) = 34.145, p < .001, ), but no significant effect of short-term memory load (F(1, 23) = 1.129, p = .30, ) and no interaction between condition and short-term memory load (F(2, 46) = .269, p = .77, ). This reveals a similar pattern to that observed in Experiment 1, where alpha power continues throughout the first second of stimulus duration in the Auditory condition only. In our paradigm, short-term memory load (the number of oddball targets) had no significant effect on alpha power. That there was no significant effect of short-term memory load confirms the hypothesis that alpha power is specifically related to selective attention by suppression of task-irrelevant sensory modalities.
8.3 Theta band oscillations
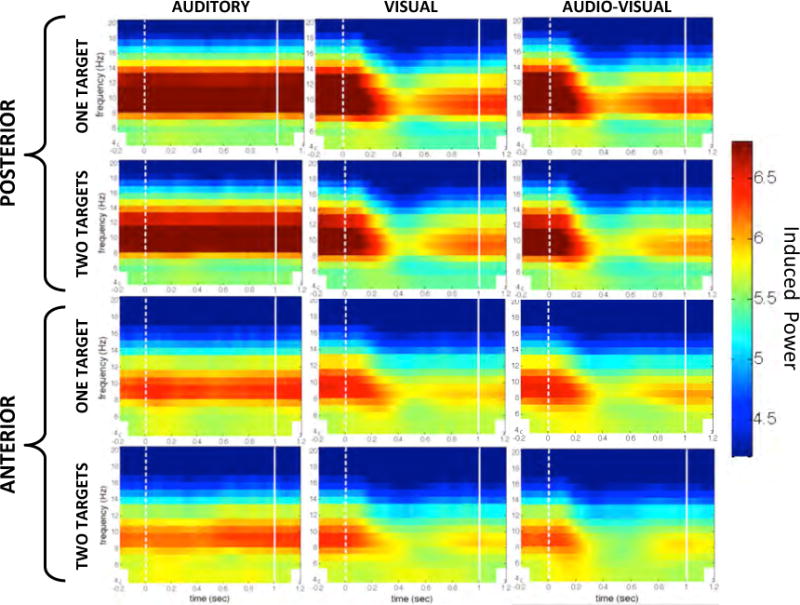
Time-frequency transforms of the theta activity, shown in Figure 7 confirm what was seen in Experiment 1, namely that fronto-central theta power, especially in the Audio-Visual condition, was highest in the first 250 ms after stimulus onset and dissipated rapidly thereafter. Note that the colormap scale for these time-frequency transforms has been slightly altered to highlight the difference in theta power among conditions. No substantial differences in theta activity are observed between short-term memory load conditions in either the topographies (see Figure 5) or the time-frequency transforms (see Figure 7), suggesting that the high theta power observed upon the onset of Audio-Visual trials is likely a marker of divided attention rather than of increased short-term memory load.
Figure 7.

Time-frequency transforms for each of the six conditions (Columns: Auditory, Visual and Audio-Visual, Alternating Rows: LowSTM (one target) and HighSTM (two targets), Top Half: Power scale from 4.5–6.5 to highlight the difference in theta power among conditions) in Experiment 2, averaged over the same anterior cluster of electrodes as in Experiment 1. Bottom Half: Power scale from 4.2–6.8, used in all other plots of oscillatory power. Dotted white line represents stimulus onset; solid white line represents one second after stimulus onset. Horizontal black lines represent the theta frequency band analyzed (4–7 Hz).
Using the same anterior cluster of electrodes as before, a repeated-measures ANOVA examined theta power in all conditions (LowSTM Auditory, HighSTM Auditory, LowSTM Visual, HighSTM Visual, LowSTM Audio-Visual, HighSTM Audio-Visual) during the time interval comprising the first one second of stimulus presentation (0–1000 ms). A main effect of condition (F(2,46) = 8.50, p < .001, ) showed that theta power differed significantly among Auditory, Visual, and Audio-Visual conditions. There was no main effect of the number of oddball targets (F(1, 23) < .001, p = .98, ), (F(1,23) = .015, p = .904, ), and no interactions between condition and the number of oddball targets (F(2,46) = 1.481, p = .23, ). This suggests that the fronto-central theta power observed does not vary with short-term memory load.
8.4 Separation of Induced and Evoked Oscillations
The results of Experiment 1 and 2 shown in Figures 3, 6, and 7 suggest that posterior alpha oscillations during selective attention to auditory stimuli are induced (not phase-locked) and are continuous from pre-stimulus through the stimulus duration, while fronto-central theta oscillations during divided attention are evoked by stimulus onset (David, Kilner, & Friston, 2006).
To test this distinction, we first calculated the averaged waveform for each subject in Experiment 2 at each electrode. For each subject, we then subtracted these averages from the activity at each electrode on each trial. This subtraction of the evoked (averaged) activity left only the induced activity. Next, we created log-transformed wavelets of this remaining activity and plotted time-frequency transforms for the significant anterior and posterior clusters of electrodes found in Experiment 1 (see Figure 8). The time-frequency transforms for the posterior electrode cluster (top two rows of Figure 8) show that the effect seen within the alpha frequency band (high alpha power pre-stimulus in all conditions and continuous alpha power during stimulus presentation in the Auditory condition specifically) remains robust. However, the time-frequency transforms for the anterior electrode cluster (bottom two rows of Figure 8) show that the effect seen within the theta frequency band (highest theta power at the onset of a trial, particularly in the Audio-Visual condition) is substantially diminished. This observation was confirmed statistically by repeating the analyses of variance conducted on the wavelets in Experiments 1 and 2, on the wavelets of induced activity after subtraction of the evoked activity. For the posterior cluster of electrodes, alpha power still varied significantly by condition (Auditory, Visual, or Audio-Visual) (F (2, 46) = 12.93, p < .001, ). This confirmed that the alpha effect observed in the posterior cluster of electrodes was not eliminated by the subtraction of evoked oscillations. An unexpected result of this analysis of variance was that short-term memory load was associated with significant variations in posterior alpha activity (F (1,23) = 4.62, p = .042, ), though the effect size was small and the ANOVA did not yield an interaction between condition and short-term memory load (F (2, 46) = 0.13, p = .88, ). In contrast to the finding that alpha power still varies by condition when evoked activity is removed, the ANOVA on theta activity in the anterior cluster of electrodes revealed no significant difference across condition (F (2, 46) = 0.19, p = .83, ) or short-term memory load (F (1, 23) < .001, p = .99, ), and no significant interaction (F (2, 46) = .39, p = .68, ). This suggests that the higher theta power we observed in the anterior cluster of electrodes during the Audio-Visual condition was evoked by stimulus onset, as the effect was eliminated when we subtracted evoked oscillations away from the induced activity.
Figure 8.
Time-frequency transforms of induced oscillations after a subtraction of the averaged waveform for each subject at each electrode from each trial in Experiment 2. Columns: Auditory, Visual and Audio-Visual, Alternating Rows: LowSTM (one target) and HighSTM (two targets), Top Half: Averaged activity over the posterior cluster of electrodes, Bottom Half: Averaged activity over the anterior cluster of electrodes. Dotted white line represents stimulus onset; solid white line represents one second after stimulus onset.
The finding that posterior alpha oscillations during selective attention are not eliminated by a subtraction of evoked activity provides further evidence that this activity is induced, while the finding that fronto-central theta oscillations during divided attention are eliminated by a subtraction of evoked activity provides further evidence that this activity is evoked. Subtracting the evoked activity also makes the induced alpha activity in both posterior and anterior clusters more clearly visible in the time-frequency transforms. The alpha activity seen in the Visual and Audio-Visual conditions toward the end of the one-second time window may reflect a ramping on of alpha oscillations in preparation for the next trial.
To further investigate the characteristic differences between induced alpha activity and evoked theta activity, we analyzed the inter-trial phase coherence (ITPC) for each of the six conditions. ITPC provides a measure of the consistency of oscillations across trials and across participants. Figure 9 depicts ITPCs during stimulus presentation for the posterior and anterior clusters of electrodes separately, across frequencies between 2 and 20 Hz.
Figure 9.

Inter-trial phase coherence within the posterior (top half) and anterior (bottom half) clusters of electrodes for each condition (first and third rows: LowSTM Auditory, LowSTM Visual, LowSTM Audio-Visual; second and fourth rows: HighSTM Auditory, HighSTM Visual, HighSTM Audio-Visual). Dotted white lines represent stimulus onset; solid white lines represent one second after stimulus onset.
The bottom half of Figure 9 shows that theta ITPC within the anterior cluster of electrodes is high at the onset of the stimulus, especially in the Audio-Visual condition, replicating our previous findings. Moreover, theta ITPC does not appear to vary by short-term memory load, providing further evidence that the fronto-central theta oscillations observed at the onset of Audio-Visual trials is not a marker of increased short-term memory load. To confirm these observations, a 3 × 2 repeated-measures ANOVA compared ITPC within the theta frequency range across the three stimulus conditions (Auditory, Visual, and Audio-Visual) and two short-term memory loads (LowSTM and HighSTM). This revealed a large main effect of condition (F (2, 46) = 21.09, p < .001, ), no significant effect of short-term memory load (F (1, 23) = .03, p = .86, ), and no interaction between the two (F (2, 46) = 1.11, p = .34, ). This pattern replicated what we observed in the power spectra, suggesting that fronto-central theta oscillations are evoked by the onset of simultaneous auditory and visual sequences.
The top half of figure 9 shows that in the posterior cluster of electrodes, the effect in the alpha frequency range is less apparent as compared to the time-frequency transforms (Figure 6). A 3 (condition) × 2 (short-term memory load) repeated-measures ANOVA on the posterior ITPC in the alpha frequency range showed that the effect of condition remained significant, though with a much smaller effect size (F (2, 46) = 5.48, p = .007, ). As expected, posterior alpha ITPC did not vary by short-term memory load (F (1, 23) = 1.68, p = .21, ) nor by the interaction between condition and short-term memory load (F (2, 46) = .17, p = .85, ).
The finding that the pattern of theta activity we observed in the power spectra remains strong in the anterior ITPC, while the pattern of alpha activity is reduced in the posterior ITPC further suggests that the fronto-central theta oscillations we observed were evoked while the posterior alpha oscillations were induced.
Given this evidence that the fronto-central theta oscillations we observed were evoked by stimulus onset, we further investigated theta’s contribution to the event-related potential (ERP). Averaging the oscillatory activity across trials and across participants from 2–30Hz, we computed ERPs for each of the six conditions (Auditory, Visual, and Audio-Visual; LowSTM and HighSTM) separately (Figure 10, left side). As depicted in Figure 10, the ERP for the Audio-Visual conditions clearly resemble a theta oscillation, in line with our interpretation that theta oscillations synchronize upon stimulus onset. To quantify this observation, we computed periodograms, which were generated by decomposing the averaged ERP data with a Fourier transform to determine the mean amplitude for discrete frequency values (1–20 Hz). Applying this procedure to each condition generated the periodograms depicted in the right-hand column of Figure 10. The periodogram for the Audio-Visual ERP reveals predominant activity at 6 Hz, indicating that theta oscillations make a substantial contribution to the overall ERP. Notably, the periodogram for the Auditory ERP shows predominant activity at 5 Hz, also within the theta frequency band (4–7 Hz). This finding is in accord with our observation of somewhat increased theta power during the Auditory condition, likely due to the multisensory nature of performing the auditory task while focusing eye gaze on a visual mark.
Figure 10.

Left Column: ERPs for the anterior cluster of electrodes for the Auditory (top panel), Visual (middle panel) and Audio-Visual (bottom panel) conditions, for the LowSTM (blue) and HighSTM (red) conditions. Blocked conditions prevented common baselining for all three conditions. The vertical bar at 0 seconds represents stimulus onset. Right: Periodograms depict the mean amplitude of oscillations at particular frequencies (1–20 Hz) for the Auditory (top panel), Visual (middle panel) and Audio-Visual (bottom panel) conditions, for both the LowSTM (blue) and HighSTM (red) conditions.
Although both alpha and theta oscillations are associated with the allocation of attention to sensory stimuli, these oscillations may operate through very different mechanisms. For example, it may be that alpha oscillations operate as a continuous suppressor of distracting information by inhibiting sensory processing, while theta may be involved in a phase-resetting that affects activity in other locations in the brain.
9 Discussion
The results of Experiment 2 confirm key conclusions suggested by Experiment 1. First, Experiment 2 showed that sustained alpha oscillations over posterior regions during an auditory attention task is highly consistent across trials and across subjects. We replicated the findings that alpha power is high in the pre-stimulus time interval for all three conditions (Auditory, Visual, and Audio-Visual), representing the preparation to selectively attend to certain sensory information, and that alpha power remains high throughout the first second of Auditory trials only, representing the suppression of processing of visual input in order to advantage processing of task-relevant auditory input. As we did not expect alpha activity to vary with short-term memory load, the absence of a significant difference in alpha power between high and low short-term memory load conditions confirmed the specificity of alpha’s role in selective attention. This is in accordance with the idea presented by Klimesch (1996) that alpha plays a critical role in the formation of long-term memories (Sheridan et al., 1988; Saletu & Grünberger, 1985) but is less involved in short-term memory.
Experiment 2 also set out to determine whether the fronto-central theta oscillations observed at the onset of trials in the Audio-Visual condition of Experiment 1 were related to divided attention (between visual and auditory streams of information) or to short-term memory load (the number of oddball targets held in mind). By independently manipulating the number of sensory streams to be attended (visual, auditory, or both simultaneously) and short-term memory load (the number of possible oddball stimuli), we determined that theta power varied with the number of sensory streams attended and not with the number of oddball targets held in short-term memory. These results confirm the hypothesis that fronto-central theta oscillations play a critical role in multisensory divided attention. In the paradigm used here, fronto-central theta oscillations appear more likely to be related to cognitive control (Cooper et al., 2016; Cavanagh & Frank, 2014) than short-term memory (Klimesch, 1996). Though we did not replicate our findings in Experiment 1 of continuously high inter-trial phase coherence in the alpha frequency range throughout Auditory trials, we did replicate the pattern of inter-trial phase coherence in the theta range (with Audio-Visual ITPC highest at stimulus onset).
10 General Discussion
Our study aimed to expand the understanding of the contributions cortical oscillatory activity makes to attention. Experiment 1 confirmed the theoretical perspective that oscillations in the alpha frequency range (8–13 Hz) are critical for selective ignoring of task-irrelevant sensory information (Payne & Sekuler, 2014; Huang & Sekuler, 2010; Romei et al., 2010). The present results expand upon this idea by demonstrating continuous posterior alpha power when subjects ignore task-irrelevant visual sequences, thereby perhaps advantaging auditory attention. During an audio-visual oddball paradigm subjects had to attend simultaneously to auditory and visual sequences. The result showed that oscillations in the theta frequency range (4–7 Hz) were associated with multisensory divided attention, independently of task difficulty. This result extends our understanding of how different frequencies of cortical oscillations participate in different forms of attentional allocation, supporting the idea proposed by Kopell et al. (2010) and expanded upon by Cannon et al. (2014) that different frequency bands of cortical oscillations are critically involved in particular cognitive functions. That the fronto-central theta oscillations observed in our data appear to be evoked by stimulus onset and dissipate quickly implies that these theta oscillations are not simply a marker of an “oscillation” of attention (switching back and forth between auditory and visual stimuli). Rather, it may be the case that these fronto-central theta oscillations reflect the engagement of divided attention mechanisms upon the onset of a divided attention task. In Experiment 2, we confirmed that these associations (alpha activity with selective attention, and theta activity with divided attention) were independent of short-term memory load. By independently varying the number of stimulus targets that subjects had to hold in short-term storage and the number of sensory streams to be attended, the experiment showed that cortical oscillatory activity in the alpha and theta bands were not related to the short-term memory load, but were consistently related to unisensory and multisensory attentional allocation required for the task. Together, these experiments provide important support for the theory that variations in oscillatory activity, measurable at the human scalp, are associated with the ability to suppress task-irrelevant information, while devoting attentional resources to task-relevant information.
The suggestion that alpha oscillations are associated with selective attention came originally from work using correlational methods (e. g., Worden et al., 2000; Kelly et al., 2006; Thut et al., 2006). Those studies correlated changes in alpha power with changes in selective attention to important (task-relevant) sensory information. To provide evidence for a causal relationship between alpha activity and selective attention, researchers subsequently turned to rate-selective repetitive trans-cranial magnetic stimulation (rTMS) (Romei et al., 2010). They measured differences in attentional effects when the brain was stimulated with pulses delivered at a rate within the alpha frequency range versus outside of this range. Our experiments demonstrated a correlation between theta activity and an instruction to divide attention between multiple sensory modalities. Future experiments, therefore, might attempt to test a causal link between theta oscillations and divided attention. Using rate-selective rTMS, one could compare performance on a divided attention task when fronto-central regions of the brain were stimulated with rTMS within the theta frequency range versus outside that range. If stimulation within the theta range specifically impaired subjects’ ability to exploit divided attention, this would confirm a causal connection between theta oscillations and the division of attention.
Although our experiments demonstrated a correlation between theta oscillations and multi-sensory divided attention, our results do not distinguish between a relationship of theta activity to divided attention generally, or a relationship between theta activity and multisensory divided attention more specifically. To address this, a followup experiment might use a task that requires attention to multiple concurrent streams of information within a single modality (such as multiple visual sequences or multiple auditory sequences).
The increase in fronto-central theta oscillations during multisensory divided attention that we observed may be explained in an alternative, but not necessarily contradictory, fashion. Namely, it could be the case that these oscillations are associated with the generation of an event-related potential (ERP). Recently, researchers have begun to converge on the idea that components of the ERP are created by synchrony among various frequencies of cortical oscillations (Gruber, Klimesch, Sauseng, & Doppelmayr, 2005). The Auditory Evoked Potential (AEP), which has been studied in great detail, is characterized by an increased negative deflection at approximately 100 ms after stimulus onset. Known also as the Auditory N1 (Picton, Hillyard, Krausz, & Galambos, 1974), this response can be seen in both the Auditory and Audio-Visual conditions of our experiment in Figure 10. The response also appears slightly more negative in response to multisensory stimuli. AEPs are also typically recorded over fronto-central regions of the brain, where we observed the strongest theta power (Picton et al., 1974). As theta oscillations have previously been associated with the Auditory N1 (Klimesch et al., 2004; Bruneau, Roux, Guérin, Garreau, & Lelord, 1993), it may be that the enhanced theta power observed in our Audio-Visual condition reflects an amplification of the Auditory N1 response when visual items are presented synchronously with auditory items. Given that numerous behavioral studies using concurrent auditory and visual stimuli have demonstrated audio-visual integration (Seilheimer, Rosenberg, & Angelaki, 2014; Driver & Noesselt, 2008; Senkowski, Schneider, Foxe, & Engel, 2008; Stein, Stanford, & Rowland, 2014), it is unsurprising that an electroencephalographic correlate of auditory processing would be enhanced by simultaneous visual information. The present study presented different conditions in different blocks of trials, which did not allow for a common baseline to compute and compare ERPs among conditions. Followup experiments in which audio-visual attention and auditory attention conditions are interleaved could determine whether the amplitude of the N1 response is increased more during audio-visual attention than during auditory attention alone.
Some researchers have adapted paradigms designed to analyze ERP components in order to explore the effects of visual stimuli on the N1 response in various tasks. They found that vision and audition appear to interact in their impact on the N1. For example, Stekelenburg and Vroomen (2007) showed that non-speech audio-visual events were associated with a faster-onset and lower-amplitude N1 than in response to auditory events alone, and Gondan, Vorberg, and Greenlee (2007) demonstrated that the auditory N1 is increased if an auditory stimulus follows a visual stimulus, compared to when the modality is unchanged. Building upon these findings, Alsius, Möttönen, Sams, Soto-Faraco, and Tiippana (2014) analyzed ERP responses to the McGurk Effect (McGurk & MacDonald, 1976). In the McGurk paradigm, two different syllables are presented simultaneously, one (“ba”) auditorily and another (“ga”) visually (by video of a face speaking the syllable), resulting in a robust perception of a third syllable (“da”). Alsius et al. (2014) found that when attention was fully focused on spoken syllables, the auditory N1 component peaked earlier to audiovisual stimuli than to auditory stimuli presented alone. In an investigation of ERP responses in audio-visual synaesthetes, Sinke et al. (2014) reported an enhanced auditory N1 amplitude in synaesthetes compared to controls. Our results shown in Figure 10 provide additional evidence that multisensory processing involving audition may yield an enhanced N1 response to the auditory stimuli.
The analysis of inter-trial phase coherence, presented in Figure 9, reveals that oscillations in the alpha band recorded from posterior electrodes are highly phase-locked throughout the trial in an auditory attention task, though this result varies somewhat from Experiment 1 to Experiment 2. Additionally, oscillations in the theta band recorded from anterior electrodes were found to be highly phase-locked at stimulus onset in an audio-visual attention task. The results of inter-trial phase coherence analyses in other experiments have been interpreted as reflecting underlying neural synchrony (Nash-Kille & Sharma, 2014), though the mechanisms that generate this synchrony are not yet fully understood. Interestingly, a recent study by (Koerner & Zhang, 2015) showed that the inter-trial phase coherence is specifically related to the generation of the N1/P1 complex (the N1 and the P1 components of the ERP taken together), correlating with amplitude and latency measures, suggesting that our characterizations of averaged activity and phase angle in fronto-central regions may be interrelated.
Our results demonstrate an association between fronto-central theta oscillations and multi-sensory divided attention, but do not address the mechanism by which attention is shared among two or more sets of information by the brain. Whether divided attention actually functions as a spotlight of attention that scans a scene (Posner, 1980), or whether division of attention is made possible by some steady-state division of attention’s limited resources (Kahneman, 1973), is still up for debate. Though our two experiments did not answer this question definitively, our results do suggest that, if fronto-central theta oscillations are causally involved in divided attention, then their involvement is brief, occurring quickly upon stimulus onset, rather than ongoing while attention is divided (at least in our task). The temporal characteristics of theta oscillations evoked by stimulus onset in our Audio-Visual condition seem ill-suited for supporting divided attention for the full one second of a stimulus sequence. In particular, it is not clear how a short period of enhanced theta could have a relatively long-lasting effect. One possibility is that this rapid-onset, brief enhancement of theta oscillations triggers attentional responses elsewhere in the brain, perhaps by synchronizing with fronto-central regions. Alternatively, it may be that the fronto-central theta oscillations we observed are a by-product of divided attention, not something in attention’s causal chain. Follow-up studies using rTMS or more difficult behavioral tasks producing a larger percentage of errors would start to answer these important questions. If theta oscillations do represent a spotlight of attention alternation between sensory streams, then it will also be important to analyze the temporal microstructure of this fluctuation to determine how rapid the alternation is or can be (VanRullen, 2013).
An important limitation to the experiments presented here is that the frequency of stimulation (approximately 4–7 Hz) is within the theta frequency band. We chose to use low frequencies of stimulation to fluctuate slowly enough that auditory processing was not advantaged over visual processing. We also chose to focus on analyzing power and inter-trial phase coherence within the 4–7 Hz frequency band despite that this overlaps with the frequency of stimulation. One consequence of this overlap is that one might be inclined to interpret the theta oscillations observed as simply a reflection of the stimulus fluctuation frequency. Indeed, when we computed ERPs for the anterior cluster of electrodes in Experiment 2 (Figure 10), it appeared that the principal frequency of oscillation seen in the Auditory condition and Audio-Visual condition matched the average rate of stimulus presentation in each of these conditions. Particularly, the bottom left panel of Figure 10 shows that the ERP from the Audio-Visual condition resembles a theta oscillation, fluctuating at about 6 Hz. This dominant fluctuation at 6 Hz is confirmed by the accompanying periodograms. For the Audio-Visual condition, whose ERP most resembled an oscillation in the theta frequency range (4–7 Hz), the periodogram reveals the highest amplitude activity at 6 Hz. These results could be interpreted as meaning that theta oscillations are a significant component of the event-related potential, in agreement with our results regarding the tight phase-locking of theta activity upon stimulus onset in this condition. This is also in accordance with our findings that theta oscillations occur only briefly at stimulus onset in the Auditory condition as well, though to a lesser extent than in the Audio-Visual condition. However, another interpretation of these results is that the theta oscillations observed are generated by the differences in the frequency of stimulation rather than differences in the allocation of attention.
That brain activity exhibits oscillations at the frequency of stimulus fluctuation has been observed previously, and is known as a steady-state visual evoked potential (SSVEP) or steady-state auditory evoked potential (SSAEP) (for a review, see Vialatte, Maurice, Dauwels, and Cichocki (2010)). However, there are some key differences between characteristics of the SSVEP/SSAEP and the characteristics of the theta oscillations observed here. First, SSVEPs/SSAEPs are found primarily over sensory cortices (occipital lobe and temporal lobe, respectively), though they may propagate to other regions. Contrary to this, the theta oscillations observed here were found in a confined anterior cluster of electrodes over fronto-central regions of cortex (see Figures 2 and 5). Though we did observe a significant cluster of theta activity in more posterior regions as well this was not the region analyzed in the present study. Second, SSVEPs/SSAEPs are entrained responses that are observed to be ongoing as the stimulus presentation continues. Unlike the ongoing oscillatory activity observed with these entrained responses, the increase in power and phase-coherence of the theta activity we observed occurred primarily within the first 250 ms of stimulus onset (see Figures 3 and 7 for time-frequency transforms; 9 for inter-trial phase coherence). Third, when SSVEPs/SSAEPs are obtained clinically, the stimuli are typically presented at a steady rate for several seconds and consist of a single, recurring item. In the study presented here, we presented subjects with only eight items per trial over the course of less than 1500 ms, with random jitter in the timing between items, and with fluctuations in luminance, loudness, or pitch. All of these factors would have reduced the chances of observing a steady-state evoked potential. Fourth, SSVEPs/SSAEPs typically do not appear at the onset of a stimulus, but rather only after some period of stimulation. The theta activity that we observe, however, occurs directly upon stimulus onset and appears to be evoked by the onset of the first item in a sequence. For example, it would be nonsensical to infer that the brain entrains to a 6 Hz oscillation before 6 Hz stimuli are presented. At the very least, multiple items in the sequence would need to be presented in order for the frequency of presentation to be inferred. However, each item in a sequence was presented for more than 125 ms and the theta oscillations appear with high inter-trial phase coherence prior to 125 ms. Moreover, the exact frequency of stimulation on a given trial was variable so could not be precisely predicted prior to trial onset. To confirm that fronto-central theta oscillations are, in fact, a marker of multisensory divided attention, future investigations could present stimuli that fluctuate outside of the theta frequency band.
The results of our study show that selective and divided attention are marked by cortical oscillations in distinct frequency bands, which are believed to reflect activity in distinct regions of cortex. The act of selectively attending to a sequence of auditory items while ignoring distracting visual input is marked by continuous alpha oscillations over posterior regions of the scalp. This finding corroborates prior evidence that alpha oscillations are important for selective ignoring of task-irrelevant information. Our research extends this idea to the ignoring of visual surroundings in a continuous manner in order to advantage processing of auditory sequences. Experiment 1 also showed that fronto-central theta oscillations at stimulus onset are associated with multisensory divided attention. Experiment 2 confirmed that these theta oscillations were more likely related to the allocation of attention to two sensory modalities than to an increase in short-term memory load. Together, these findings suggest that continuous alpha oscillations play a role in ongoing selective attention to sensory stimuli, while brief, rapid-onset theta oscillations play a role in multisensory divided attention.
Acknowledgments
Supported by CELEST, an NSF Science of Learning Center (SBE-0354378). A.S.K. was also supported by an NIH grant for Undergraduate and Graduate Training in Computational Neuroscience, 1T90DA032435-01. We are indebted to Jonathan Cannon for helpful suggestions and Avigael M. Aizenman for her help with stimulus design.
Footnotes
Publisher's Disclaimer: This is a PDF file of an unedited manuscript that has been accepted for publication. As a service to our customers we are providing this early version of the manuscript. The manuscript will undergo copyediting, typesetting, and review of the resulting proof before it is published in its final citable form. Please note that during the production process errors may be discovered which could affect the content, and all legal disclaimers that apply to the journal pertain.
References
- Almeida PR, Ferreira-Santos F, Chaves PL, Paiva TO, Barbosa F, Marques-Teixeira J. Perceived arousal of facial expressions of emotion modulates the N170, regardless of emotional category: Time domain and time-frequency dynamics. International Journal of Psychophysiology. 2016;99:48–56. doi: 10.1016/j.ijpsycho.2015.11.017. [DOI] [PubMed] [Google Scholar]
- Alsius A, Möttönen R, Sams M, Soto-Faraco S, Tiippana K. Effect of attentional load on audiovisual speech perception: evidence from ERPs. Frontiers in Psychology. 2014;5(727):1–9. doi: 10.3389/fpsyg.2014.00727. [DOI] [PMC free article] [PubMed] [Google Scholar]
- Arnolds DEAT, Da Silva FHL, Aitink JW, Kamp A, Boeijinga P. The spectral properties of hippocampal EEG related to behaviour in man. Electroencephalography and Clinical Neurophysiology. 1980;50(3–4):324–328. doi: 10.1016/0013-4694(80)90160-1. [DOI] [PubMed] [Google Scholar]
- Behroozi M, Daliri MR, Shekarchi B. Eeg phase patterns reflect the representation of semantic categories of objects. Medical and Biological Engineering and Computing. 2016;54:205–221. doi: 10.1007/s11517-015-1391-7. [DOI] [PubMed] [Google Scholar]
- Bonnefond M, Jensen O. Alpha oscillations serve to protect working memory maintenance against anticipated distracters. Current Biology. 2012;22(20):1969–1974. doi: 10.1016/j.cub.2012.08.029. [DOI] [PubMed] [Google Scholar]
- Bruneau N, Roux S, Guérin P, Garreau B, Lelord G. Auditory stimulus intensity responses and frontal midline theta rhythm. Electroencephalography and Clinical Neurophysiology. 1993;86(3):213–216. doi: 10.1016/0013-4694(93)90010-s. [DOI] [PubMed] [Google Scholar]
- Cannon J, McCarthy MM, Lee S, Lee J, Börgers C, Whittington MA, Kopell N. Neurosystems: brain rhythms and cognitive processing. Europen Journal of Neuroscience. 2014;39(5):705–719. doi: 10.1111/ejn.12453. [DOI] [PMC free article] [PubMed] [Google Scholar]
- Cavanagh JF, Frank MJ. Frontal theta as a mechanism of cognitive control. Trends in Cognitive Sciences. 2014;18(8):414–421. doi: 10.1016/j.tics.2014.04.012. [DOI] [PMC free article] [PubMed] [Google Scholar]
- Cavanagh JF, Frank MJ, Klein TJ, Allen JJ. Frontal theta links prediction errors to behavioral adaptation in reinforcement learning. Neuroimage. 2010;49(4):3198–3209. doi: 10.1016/j.neuroimage.2009.11.080. [DOI] [PMC free article] [PubMed] [Google Scholar]
- Cavanagh JF, Zambrano-Vazquez L, Allen JJB. Theta lingua franca: A common mid-frontal substrate for action monitoring processes. Psychophysiology. 2011;49(2):220–238. doi: 10.1111/j.1469-8986.2011.01293.x. [DOI] [PMC free article] [PubMed] [Google Scholar]
- Cohen MX, Donner TH. Midfrontal conflict-related theta-band power reflects neural oscillations that predict behavior. Journal of Neurophysiology. 2013;110:2752–2763. doi: 10.1152/jn.00479.2013. [DOI] [PubMed] [Google Scholar]
- Cooper PS, Darriba Á, Karayanidis F, Barceló F. Contextually sensitive power changes across multiple frequency bands underpin cognitive control. NeuroImage. 2016;132:499–511. doi: 10.1016/j.neuroimage.2016.03.010. [DOI] [PubMed] [Google Scholar]
- David O, Kilner JM, Friston KJ. Mechanisms of evoked and induced responses in meg/eeg. NeuroImage. 2006;31:1580–1591. doi: 10.1016/j.neuroimage.2006.02.034. [DOI] [PubMed] [Google Scholar]
- Delorme A, Makeig S. EEGLAB: an open source toolbox for analysis of single-trial EEG dynamics including independent component analysis. Journal of Neuroscience Methods. 2004;134(1):9–21. doi: 10.1016/j.jneumeth.2003.10.009. [DOI] [PubMed] [Google Scholar]
- Driver J, Noesselt T. Multisensory interplay reveals crossmodal influences on ‘sensory-specific’ brain regions, neural responses, and judgments. Neuron. 2008;57(1):11–23. doi: 10.1016/j.neuron.2007.12.013. [DOI] [PMC free article] [PubMed] [Google Scholar]
- Dubé C, Payne L, Sekuler R, Rotello CM. Paying attention to attention in recognition memory: insights from models and electrophysiology. Psychological Science. 2013;24(12):2398–2408. doi: 10.1177/0956797613492426. [DOI] [PMC free article] [PubMed] [Google Scholar]
- Foxe JJ, Simpson GV, Ahlfors SP. Parieto-occipital approximately 10 Hz activity reflects anticipatory state of visual attention mechanisms. Neuroreport. 1998;9(17):3929–3933. doi: 10.1097/00001756-199812010-00030. [DOI] [PubMed] [Google Scholar]
- Freides D. Human information processing and sensory modality: Cross-modal functions, information complexity, memory, and deficit. Psychological Bulletin. 1974;81(5):284–310. doi: 10.1037/h0036331. [DOI] [PubMed] [Google Scholar]
- Friston KJ. Functional and effective connectivity: A review. Brain Connectivity. 2011;1(1):13–36. doi: 10.1089/brain.2011.0008. [DOI] [PubMed] [Google Scholar]
- Gomez-Ramirez M, Higgins BA, Rycroft JA, Owen GN, Mahoney J, Shpaner M, Foxe JJ. The deployment of intersensory selective attention: a high-density electrical mapping study of the effects of theanine. Clinical Neuropharmacology. 2007;30(1):25–38. doi: 10.1097/01.WNF.0000240940.13876.17. [DOI] [PubMed] [Google Scholar]
- Gondan M, Vorberg D, Greenlee MW. Modality shift effects mimic multisensory interactions: an event-related potential study. Experimental Brain Research. 2007;182(2):199–214. doi: 10.1007/s00221-007-0982-4. [DOI] [PubMed] [Google Scholar]
- Gruber WR, Klimesch W, Sauseng P, Doppelmayr M. Alpha phase synchronization predicts P1 and N1 latency and amplitude size. Cerebral Cortex. 2005;15:371–377. doi: 10.1093/cercor/bhh139. [DOI] [PubMed] [Google Scholar]
- Haegens S, Luther L, Jensen O. Somatosensory anticipatory alpha activity increases to suppress distracting input. Journal of Cognitive Neuroscience. 2012;24(3):677–685. doi: 10.1162/jocn_a_00164. [DOI] [PubMed] [Google Scholar]
- Hidaka S, Manaka Y, Teramoto W, Sugita Y, Miyauchi R, Gyoba J, Iwaya Y. Alternation of sound location induces visual motion perception of a static object. PLoS One. 2009;4(12):e8188. doi: 10.1371/journal.pone.0008188. [DOI] [PMC free article] [PubMed] [Google Scholar]
- Huang J, Sekuler R. Attention protects the fidelity of visual memory: Behavioral and electro-physiological evidence. Journal of Neuroscience. 2010;30(40):13461–13471. doi: 10.1523/JNEUROSCI.2560-10.2010. [DOI] [PMC free article] [PubMed] [Google Scholar]
- James W. The principles of psychology. New York: H. Holt and company; 1890. [Google Scholar]
- Johnson JA, Zatorre RJ. Neural substrates for dividing and focusing attention between simultaneous auditory and visual events. Neuroimage. 2006;31(4):1673–1681. doi: 10.1016/j.neuroimage.2006.02.026. [DOI] [PubMed] [Google Scholar]
- Kahneman D. Attention and effort. Prentice-Hall; 1973. [Google Scholar]
- Keller AS, Sekuler R. Memory and learning with rapid audiovisual sequences. Journal of Vision. 2015;15(15):1–18. doi: 10.1167/15.15.7. [DOI] [PMC free article] [PubMed] [Google Scholar]
- Kelly SP, Lalor EC, Reilly RB, Foxe JJ. Increases in alpha oscillatory power reflect an active retinotopic mechanism for distracter suppression during sustained visuospatial attention. Journal of Neurophysiology. 2006;95(6):3844–3851. doi: 10.1152/jn.01234.2005. [DOI] [PubMed] [Google Scholar]
- Ketz NA, Jensen O, O’Reilly RC. Thalamic pathways underlying prefrontal cortex-medial temporal lobe oscillatory interactions. Trends in Neurosciences. 2014;38(1):3–12. doi: 10.1016/j.tins.2014.09.007. [DOI] [PubMed] [Google Scholar]
- Kirschfeld K. The physical basis of alpha waves in the electroencephalogram and the origin of the “Berger effect”. Biological Cybernetics. 2005;93(3):177–185. doi: 10.1007/s00422-005-0547-1. [DOI] [PubMed] [Google Scholar]
- Klimesch W. Memory processes, brain oscillations and eeg synchronization. International Journal of Psychophysiology. 1996;24:61–100. doi: 10.1016/s0167-8760(96)00057-8. [DOI] [PubMed] [Google Scholar]
- Klimesch W, Doppelmayr M, Russegger H, Pachinger T. Theta band power in the human scalp eeg and the encoding of new information. Neuroreport. 1996;7(7):1235–1240. doi: 10.1097/00001756-199605170-00002. [DOI] [PubMed] [Google Scholar]
- Klimesch W, Doppelmayr M, Schimke H, Ripper B. Theta synchronization and alpha desynchronization in a memory task. Psychophysiology. 1997;34(2):169–176. doi: 10.1111/j.1469-8986.1997.tb02128.x. [DOI] [PubMed] [Google Scholar]
- Klimesch W, Schack B, Schabus M, Doppelmayr M, Gruber W, Sauseng P. Phase-locked alpha and theta oscillations generate the P1-N1 complex and are related to memory performance. Cognitive Brain Research. 2004;19:302–316. doi: 10.1016/j.cogbrainres.2003.11.016. [DOI] [PubMed] [Google Scholar]
- Koerner TK, Zhang Y. Effects of background noise on inter-trial phase coherence and auditory n1-p2 responses to speech stimuli. Hearing Research. 2015;328:113–119. doi: 10.1016/j.heares.2015.08.002. [DOI] [PubMed] [Google Scholar]
- Kopell N, Kramer MA, Malerba P, Whittington MA. Are different rhythms good for different functions? Frontiers in Human Neuroscience. 2010;4:187. doi: 10.3389/fnhum.2010.00187. [DOI] [PMC free article] [PubMed] [Google Scholar]
- Lachaux JP, Rodriguez E, Martinerie J, Varela FJ. Measuring phase synchrony in brain signals. Human Brain Mapping. 1999;8(4):194–208. doi: 10.1002/(SICI)1097-0193(1999)8:4<194::AID-HBM4>3.0.CO;2-C. [DOI] [PMC free article] [PubMed] [Google Scholar]
- Loose R, Kaufman C, Auer DP, Lange KW. Human prefrontal and sensory cortical activity during divided attention tasks. Human Brain Mapping. 2003;18:249–259. doi: 10.1002/hbm.10082. [DOI] [PMC free article] [PubMed] [Google Scholar]
- Mathewson KE, Gratton G, Fabiani M, Beck DM, Ro T. To see or not to see: Pre-stimulus alpha phase predicts visual awareness. Journal of Neuroscience. 2009;29(9):2725–2732. doi: 10.1523/JNEUROSCI.3963-08.2009. [DOI] [PMC free article] [PubMed] [Google Scholar]
- Mazaheri A, van Schouwenburg MR, Dimitrijevic A, Denys D, Cools R, Jensen O. Region-specific modulations in oscillatory alpha activity serve to facilitate processing in the visual and auditory modalities. Neuroimage. 2014;87:356–362. doi: 10.1016/j.neuroimage.2013.10.052. [DOI] [PubMed] [Google Scholar]
- McGurk H, MacDonald J. Hearing lips and seeing voices. Nature. 1976;265:746–748. doi: 10.1038/264746a0. [DOI] [PubMed] [Google Scholar]
- Mueller G, Hall JW. Audiologist’s Desk Reference: Audiolologic Management, Rehabilitation and Terminology. II. Singular Publishing Group, Inc; 1998. [Google Scholar]
- Nash-Kille A, Sharma A. Inter-trial coherence as a marker of cortical phase synchrony in children with sensorineural hearing loss and auditory neuropathy spectrum disorder fitted with hearing aids and cochlear implants. Clinical Neurophysiology. 2014;125(7):1459–1470. doi: 10.1016/j.clinph.2013.11.017. [DOI] [PMC free article] [PubMed] [Google Scholar]
- Noyce A, Sekuler R. Oddball distrators demand attention: neural and behavioral responses to predictability in the flanker task. Neuropsychologia. 2014;65:18–24. doi: 10.1016/j.neuropsychologia.2014.10.002. [DOI] [PMC free article] [PubMed] [Google Scholar]
- Noyce AL, Cestero N, Shinn-Cunningham BG, Somers DC. Short-term memory stores organized by information domain. Attention, Perception & Psychophysics. 2016;78(3):960–970. doi: 10.3758/s13414-015-1056-5. [DOI] [PMC free article] [PubMed] [Google Scholar]
- Oldfield RC. The assessment and analysis of handedness: the edinburgh inventory. Neuropsychologia. 1971;9(1):97–113. doi: 10.1016/0028-3932(71)90067-4. [DOI] [PubMed] [Google Scholar]
- Oostenveld R, Fries P, Maris E, Schoffelen JM. FieldTrip: Open source software for advanced analysis of MEG, EEG, and invasive electrophysiological data. Computational Intelligence and Neuroscience. 2011;2011 doi: 10.1155/2011/156869. [DOI] [PMC free article] [PubMed] [Google Scholar]
- Payne L, Guillory S, Sekuler R. Attention-modulated alpha-band oscillations protect against intrusion of irrelevant information. Journal of Cognitive Neuroscience. 2013;25(9):1463–1476. doi: 10.1162/jocn_a_00395. [DOI] [PMC free article] [PubMed] [Google Scholar]
- Payne L, Sekuler R. On the importance of ignoring: Alpha oscillations protect selective processing. Current Directions in Psychological Science. 2014;23(3):171–177. doi: 10.1177/0963721414529145. [DOI] [PMC free article] [PubMed] [Google Scholar]
- Picton TW, Hillyard SA, Krausz HI, Galambos R. Human auditory evoked potentials. i: Evaluation of components. Electroencephalography and Clinical Neurophysiology. 1974;36:179–190. doi: 10.1016/0013-4694(74)90155-2. [DOI] [PubMed] [Google Scholar]
- Posner MI. Orienting of attention. Quarterly Journal of Experimental Psychology. 1980;32:3–25. doi: 10.1080/00335558008248231. [DOI] [PubMed] [Google Scholar]
- Romei V, Gross J, Thut G. On the role of prestimulus alpha rhythms over occipito-parietal areas in visual input regulation: Correlation or causation? Journal of Neuroscience. 2010;30(25):8692–8697. doi: 10.1523/JNEUROSCI.0160-10.2010. [DOI] [PMC free article] [PubMed] [Google Scholar]
- Romei V, Rihs T, Brodbeck V, Thut G. Resting electroencephalogram alpha-power over posterior sites indexes baseline visual cortex excitability. Neuroreport. 2008;19(2):203–208. doi: 10.1097/WNR.0b013e3282f454c4. [DOI] [PubMed] [Google Scholar]
- Rutishauser U, Ross IB, Mamelak AN, Schuman EM. Human memory strength is predicted by theta-frequency phase-locking of single neurons. Nature. 2010;464(7290):903–907. doi: 10.1038/nature08860. [DOI] [PubMed] [Google Scholar]
- Sakowitz OW, Schürmann M, Başar E. Oscillatory frontal theta responses are increased upon bisensory stimulation. Clinical Neurophysiology. 2000;111(5):884–893. doi: 10.1016/s1388-2457(99)00315-6. [DOI] [PubMed] [Google Scholar]
- Saletu B, Grünberger J. Memory dysfunction and vigilance: neurophysiological psychopharmacological aspects. Annals of the New York Academy of Sciences. 1985;444:406–427. doi: 10.1111/j.1749-6632.1985.tb37604.x. [DOI] [PubMed] [Google Scholar]
- Seilheimer RL, Rosenberg A, Angelaki DE. Models and processes of multisensory cue combination. Current Opinions in Neurobiology. 2014;25:38–46. doi: 10.1016/j.conb.2013.11.008. [DOI] [PMC free article] [PubMed] [Google Scholar]
- Sekuler R, Sekuler AB, Lau R. Sound alters visual motion perception. Nature. 1997;385(6614):308. doi: 10.1038/385308a0. [DOI] [PubMed] [Google Scholar]
- Senkowski D, Schneider T, Foxe JJ, Engel AK. Crossmodal binding through neural coherence: implications for multisensory processing. Trends in Neuroscience. 2008;31(8):401–409. doi: 10.1016/j.tins.2008.05.002. [DOI] [PubMed] [Google Scholar]
- Shams L, Kamitani Y, Shimojo S. Illusions: What you see is what you hear. Nature. 2000;408:788. doi: 10.1038/35048669. [DOI] [PubMed] [Google Scholar]
- Sheridan PH, Sato S, Foster N, Bruno GCC, Fedio P, Chase TN. Relation of EEG alpha background to parietal lobe function in Alzheimer’s disease as measured by positron emission tomography and psychometry. Neurology. 1988;38(5):747–750. doi: 10.1212/wnl.38.5.747. [DOI] [PubMed] [Google Scholar]
- Shipley T. Auditory, flutter-driving of visual flicker. Science. 1964;145(3638):1328–1330. doi: 10.1126/science.145.3638.1328. [DOI] [PubMed] [Google Scholar]
- Sinke C, Neufeld J, Wiswede D, Emrich HM, Bleich S, Münte TF, Szycik GR. N1 enhancement in synesthesia during visual and audio-visual perception in semantic cross-modal conflict situations: an ERP study. Frontiers in Human Neuroscience. 2014;8(21):1–10. doi: 10.3389/fnhum.2014.00021. [DOI] [PMC free article] [PubMed] [Google Scholar]
- Snyder AC, Foxe JJ. Anticipatory attentional suppression of visual features indexed by oscillatory alpha-band power increases: a high-density electrical mapping study. Journal of Neuroscience. 2010;30(11):4024–4032. doi: 10.1523/JNEUROSCI.5684-09.2010. [DOI] [PMC free article] [PubMed] [Google Scholar]
- Squires NK, Squires KC, Hillyard SA. Two varieties of long-latency positive waves evoked by unpredictable auditory stimuli in man. Electroencephalography and Clinical Neurophysiology. 1975;38(4):387–401. doi: 10.1016/0013-4694(75)90263-1. [DOI] [PubMed] [Google Scholar]
- Stein BE, Stanford TR, Rowland BA. Development of multisensory integration for the perspective of the individual neuron. Nature Reviews Neuroscience. 2014;15(8):520–535. doi: 10.1038/nrn3742. [DOI] [PMC free article] [PubMed] [Google Scholar]
- Stekelenburg JJ, Vroomen J. Neural correlates of multisensory integration of ecologically valid audiovisual events. Journal of Cognitive Neuroscience. 2007;19(12):1964–1973. doi: 10.1162/jocn.2007.19.12.1964. [DOI] [PubMed] [Google Scholar]
- Stroop JR. Studies of interference in serial verbal reactions. Journal of Experimental Psychology. 1935;8(6):643–662. [Google Scholar]
- Teramoto W, Hidaka S, Sugita Y. Sounds move a static visual object. PLoS One. 2010;5(8):e12255. doi: 10.1371/journal.pone.0012255. [DOI] [PMC free article] [PubMed] [Google Scholar]
- Teramoto W, Kobayashi M, Hidaka S. Vision contingent auditory pitch aftereffects. Experimental Brain Research. 2013;229:97–102. doi: 10.1007/s00221-013-3596-z. [DOI] [PubMed] [Google Scholar]
- Thut G, Nietzel A, Brandt SA, Pascual-Leone A. Alpha-band electroencephalographic activity over occipital cortex indexes visuospatial attention bias and predicts visual target detection. The Joural of Neuroscience. 2006;26(37):9494–9502. doi: 10.1523/JNEUROSCI.0875-06.2006. [DOI] [PMC free article] [PubMed] [Google Scholar]
- VanRullen R. Visual attention: A rhythmic process? Current Biology. 2013;23(24):R1110–R1112. doi: 10.1016/j.cub.2013.11.006. [DOI] [PubMed] [Google Scholar]
- VanRullen R, Busch N, Drewes J, Dubois J. Ongoing EEG phase as a trial-by-trial predictor of perceptual and attentional variability. Frontiers in Psychology. 2011;2(60):1–9. doi: 10.3389/fpsyg.2011.00060. [DOI] [PMC free article] [PubMed] [Google Scholar]
- Vialatte FB, Maurice M, Dauwels J, Cichocki A. Steady-state visually evoked potentials: Focus on essential paradigms and future perspectives. Progress in Neurobiology. 2010;90(4):418–438. doi: 10.1016/j.pneurobio.2009.11.005. [DOI] [PubMed] [Google Scholar]
- Welch R, Warren DH. Immediate perceptual response to intersensory discrepancy. Psychological Bulletin. 1980;88(3):638–667. [PubMed] [Google Scholar]
- Wimmer RD, Schmitt LI, Davidson TJ, Nakajima M, Deisseroth K, Halassa MM. Thalamic control of sensory selection in divided attention. Nature. 2015;526(7575):705–709. doi: 10.1038/nature15398. [DOI] [PMC free article] [PubMed] [Google Scholar]
- Worden MS, Foxe JJ, Wang N, Simpson GV. Anticipatory biasing of visuospatial attention indexed by retinotopically specific alpha-band electroencephalography increases over occipital cortex. The Journal of Neuroscience. 2000;20:1–6. doi: 10.1523/JNEUROSCI.20-06-j0002.2000. [DOI] [PMC free article] [PubMed] [Google Scholar]