

Supplemental Digital Content is available in the text
Keywords: coronary artery calcification, coronary artery calcium scores, health examination, uric acid
Abstract
Recently, the pathogenic role of uric acid (UA) in both systemic metabolic and atherosclerotic diseases has been investigated. We sought to determine the independent correlation between serum UA levels and coronary artery calcification, as a marker of subclinical atherosclerosis. A total of 4188 individuals without prior coronary artery disease or urate-deposition disease were included. All of the participants underwent multidetector computed tomography (MDCT) for the evaluation of coronary artery calcification (CAC) during their health check-ups. The subjects were divided into thre groups according to CAC scores (group 1: 0; group 2: 1–299; group 3: ≥300). After controlling for other confounders, serum UA levels were found to be positively associated with increasing CAC scores (P = 0.001). Adjusted mean serum UA levels in each CAC group were estimated to be 5.2 ± 0.1 mg/dL, 5.3 ± 0.1 mg/dL, and 5.6 ± 0.2 mg/dL from groups 1, 2, and 3, respectively. Subsequent subgroup analyses revealed that this positive association was only significant in participants who were male, relatively older, less overweight, and did not have diabetes mellitus (DM), hypertension, smoking history, or renal dysfunction. In conclusion, serum uric acid levels were independently associated with CAC score severity and this finding is particularly relevant to the subjects who were male, relatively older, less overweight (body mass index < 25 kg/m2), and without a history of DM, hypertension, smoking, or renal dysfunction.
1. Introduction
Uric acid (UA) is the end product of purine catabolic metabolism. The serum level of UA is influenced by multiple factors, including exogenous ingestion (particularly with an animal protein-rich diet), endogenous production by the liver, and renal excretion.[1] Over the decades, the pathological consequences of excess UA have been found to be associated with its tendency to form crystals, as manifested in gouty arthritis or UA stones. This accumulation triggers complex proinflammatory cascades, leading to increased neutrophil phagocytosis, and activation of macrophages, fibroblasts, inflammatory mediators, and complement.[2,3] However, more recent evidence suggests that the UA's pathological consequences are not confined to local tissue damage that results from its insoluble, crystallized forms. Instead, UA can cause a milieu of systemic inflammatory responses that can ultimately cause metabolic and atherosclerotic diseases. This phenomenon may at least be partially attributable to the association between hyperuricemia, free radical-induced oxidative stress, and endothelial dysfunction.[4,5]
A number of epidemiologic studies have indicated that hyperuricemia itself is closely associated with a wide range of cardiovascular risk factors such as type 2 diabetes mellitus (DM),[6] hypertension,[7,8] obesity,[9] incident kidney disease,[10] and metabolic syndrome.[11] Hyperuricemia has also been associated with overt cardiovascular events such as stroke,[12] heart failure,[13] and peripheral artery disease.[14] A number of studies have also been conducted to investigate the relationship between hyperuricemia and coronary artery disease. Particularly in high-risk populations, such as patients with acute coronary syndrome,[15] metabolic syndrome,[16] or systolic hypertension,[17] elevated serum UA level is an independent predictor of poor cardiac outcomes. However, in a relatively healthy general population, these associations are insufficiently elucidated.
Unstable coronary plaque lesions that are vulnerable to rupture tend to have focal calcium deposits. Plaque mineralization is colocalized with various bone morphogenic and proinflammatory cytokines.[18] The degree of calcification, as measured by multidetector computed tomography (MDCT), is one of the most widely accepted tools for detecting coronary atherosclerosis and estimating coronary risk assessment. This tool is also valid in asymptomatic adults.[19]
Therefore, in this study, we sought to determine whether serum UA levels are independently associated with the coronary artery calcium (CAC) scores in the populations who attended a comprehensive medical check-up course and free of overt coronary artery disease and urate deposition disease.
2. Methods
2.1. Study population
This was a cross-sectional retrospective single-center study. We consecutively collected data from 4884 subjects who underwent MDCT as part of a routine health check-up between July 2006 and September 2013 at Gangnam Severance Hospital, Yonsei University College of Medicine, Seoul, South Korea. The exclusion criteria were as follows: age <20 years or >80 years; overt coronary artery disease or urate deposition disease (including gouty arthritis and nephrolithiasis); use of medications that can affect serum UA level (i.e., diuretics, allopurinol, febuxostat, colchicine, probenecid, and benzbromarone); and incomplete medical information. Renal dysfunction was defined as estimated glomerular filtration rate (eGFR) of <60 mL/min/1.73 m2 of the body surface area. A total of 4188 subjects were ultimately included in the analysis (Fig. 1). This study was approved by the Institutional Review Board of Gangnam Severance Hospital, Yonsei University College of Medicine (IRB no. 3-2015-0128).
Figure 1.
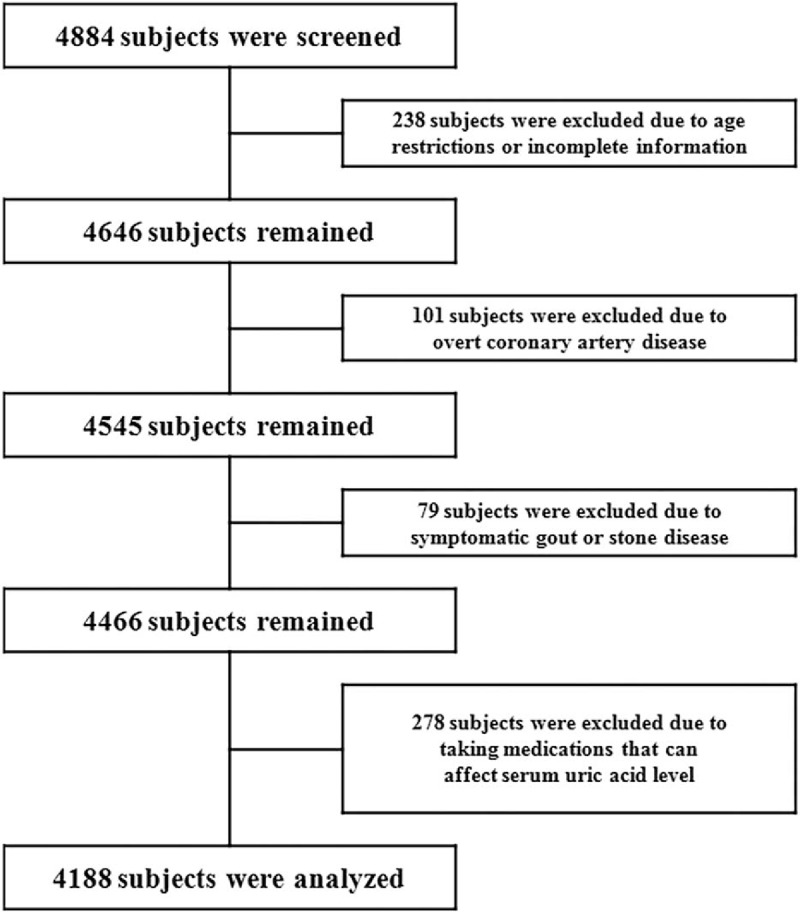
Flow diagram for participant screening, eligibility, and analysis.
2.2. Measurement of clinical and laboratory parameters
Each patient completed a questionnaire to assess smoking status and previous history of DM, hypertension, gouty arthritis, nephrolithiasis, or coronary artery disease. Height, body weight, and blood pressure were measured during the check-up visits. Blood samples were collected on the day of the MDCT scan after at least 12 hours of fasting. The following laboratory parameters, which are potentially associated with coronary risk, were evaluated: white blood cell count, hemoglobin, C-reactive protein (CRP), blood urea nitrogen (BUN), creatinine, fasting glucose, UA, total cholesterol, triglyceride, low-density lipoprotein (LDL)-cholesterol, and high-density lipoprotein (HDL)-cholesterol. Kidney function was determined by eGFR, which was based on the formula developed from the Modification of Diet in Renal Disease (MDRD) study.[20] Body mass index (BMI) was calculated as body weight (kilograms) divided by the square of height (square meters).
2.3. Multidetector computed tomography (MDCT)
Subjects were scanned using cardiac MDCT (Philips Brilliance 64; Philips Medical Systems, Best, The Netherlands) with a 3 mm slice thickness and 1.5 mm reconstruction interval. Cardiac MDCT was performed in the craniocaudal direction with the patient in the supine position, during a single breath-hold at the end-inspiratory suspension. Patients with an initial heart rate >66 beats/min before cardiac MDCT examination received a β-adrenergic blocker (25 mg atenolol; Tenormin, Hyundai, Seoul, Korea), unless β-blocking agents were contraindicated. Iodinated contrast (Optiray 350; Tyco Healthcare, Kanata, Canada) was administered at a dose of 2.0 mL/kg (not exceeding a total of 100 mL) using a two-phase injection protocol for the arterial and delayed phases of the CT images. Quantitative CACs were calculated according to the method previously described by Agatston et al.[21]. Briefly, CAC was determined as a high-attenuation area in the coronary artery whose attenuation exceeded the threshold of 130 Hounsfield units in a minimum of three contiguous pixels.
2.4. Statistical analysis
Continuous variables were compared using an independent t-test or one-way ANOVA with Bonferroni post-hoc analysis, depending on the number of groups. ANOVA for linear trend was used to assess linearity across the groups. Categorical variables were compared using Pearson's Chi-square tests with post-hoc analysis by adjusted residuals. The distribution of CAC scores was highly skewed (Supplemental Fig. 1). Therefore, participants were categorized into three groups according to their CAC scores: CAC group 1 (CAC score: 0, calcium absent); CAC group 2 (CAC score: 1–299); CAC group 3 (CAC score: ≥300). In contrast, the serum UA level was normally distributed (Supplemental Fig. 2). In order to determine if the serum UA levels were independently associated across the CAC groups, we used linear regression models by incorporating the serum UA level as a continuous dependent variable and the CAC groups as the categorical independent variable. We also included other confounding baseline parameters as independent factors and covariates. Other skewed continuous variables were logarithmically transformed when appropriate. The estimated marginal means for serum UA levels for each CAC group were calculated, and pairwise comparisons were tested by using generalized linear models. The subgroup analysis was performed based on the categorical variables.
All analyses were performed using SPSS for Windows (version 23.0; SPSS Inc, Chicago, IL) and R version 3.3.2 (http://r-project.org). All statistical tests were evaluated using a two-tailed 95% confidence interval. P-values <0.05 were considered statistically significant.
3. Results
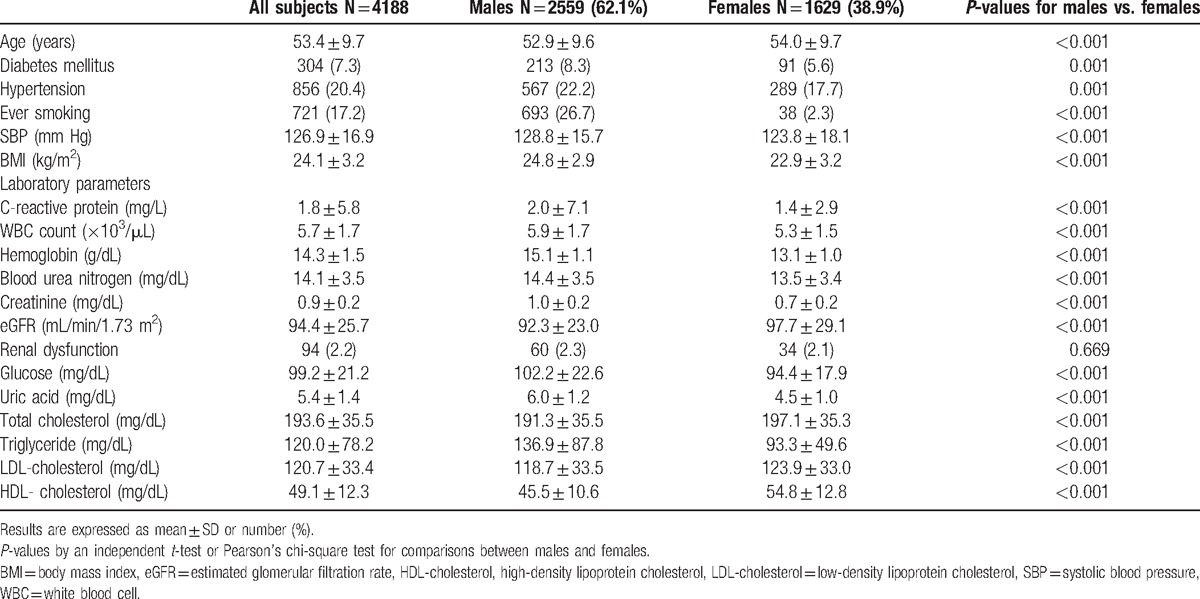
Baseline characteristics for the subjects by gender are shown in Table 1. Mean participant age was 53.4 ± 9.7 years and 62.1% were male. The prevalence of DM, hypertension, and ever smoking were 7.3%, 20.4%, and 17.2%, respectively. The average levels of eGFR and serum UA were 94.4 ± 25.7 mL/min/1.73 m2 and 5.4 ± 1.4 mg/dL (male, 6.0 ± 1.2 mg/dL; female, 4.5 ± 1.0 mg/dL), respectively. All of the baseline parameters, except for the prevalence of renal dysfunction, were significantly different between men and women (Table 1).
Table 1.
Baseline characteristics of the participants.
We first classified the subjects into three groups based on their CAC scores: CAC group 1 (CAC score: 0, calcium absent); CAC group 2 (CAC score: 1–299); and CAC group 3 (CAC score: ≥300). Based upon this classification, a total of 3016 patients (72.0%), 1024 patients (24.5%), and 148 patients (3.5%) were categorized as CAC group 1, group 2, and group 3, respectively (Supplemental Table 1). Then, we used linear trend tests to assess which parameters were linearly associated with CAC scores. We found that, as the CAC score increased, the following parameters increased significantly: age (P<0.001), BMI (P = 0.047), proportion of males (P < 0.001), DM (P < 0.001), hypertension (P < 0.001), ever smokers (P < 0.001), renal dysfunction (P < 0.001), degree of systolic blood pressure (P < 0.001), serum levels of BUN (P < 0.001), creatinine (P < 0.001), fasting glucose (P < 0.001), and UA (P < 0.001). Mean serum UA levels for each CAC group were 5.3 ± 1.4 mg/dL, 5.7 ± 1.3 mg/dL, and 5.9 ± 1.3 mg/dL in CAC groups 1, 2 and 3, respectively. By contrast, serum levels of total cholesterol (P = 0.004), LDL-cholesterol (P = 0.006), and HDL cholesterol (P = 0.003) decreased significantly as the CAC score increased (Supplemental Table 1). Additional, detailed findings between the groups are also provided in Supplemental Table 1.
Next, we explored which parameters were significantly associated with serum UA level. Male participants (B = 1.567, P < 0.001) with hypertension (B = 0.360, P < 0.001), and a history of smoking (B = 0.668, P < 0.001) were all significantly more likely to have elevated serum UA levels than were those without these characteristics. With regard to continuous variables, systolic blood pressure (B = 0.014, P < 0.001), BMI (B = 0.149, P < 0.001), serum levels of CRP (B = 0.933, P < 0.001), white blood cell count (B = 0.160, P < 0.001), hemoglobin (B = 0.418, P < 0.001), fasting glucose (B = 0.004, P < 0.001), total cholesterol (B = 0.003, P < 0.001), triglyceride (B = 2.009, P < 0.001), and LDL-cholesterol (B = 0.002, P = 0.001) were all significantly positively associated with serum UA level. In contrast, age (B = −0.007, P = 0.002), calculated eGFR (B = −1.888, P < 0.001), and serum HDL-cholesterol (B = −0.034, P < 0.001) were significantly negatively associated with serum UA level. Among these, age (B = −0.008, P < 0.001), male gender (B = 1.204, P < 0.001), DM (B = −0.216, P = 0.003), hypertension (B = 0.200, P < 0.001), BMI (B = 0.055, P < 0.001), CRP (B = 0.406, P < 0.001), hemoglobin (B = 0.048, P = 0.003), eGFR (B = −1.052, P < 0.001), fasting glucose (B = −0.004, P < 0.001), total cholesterol (B = 0.004, P = 0.016), triglyceride (B = 0.367, P = 0.008), and HDL-cholesterol (B = −0.008, P = 0.001) remained statistically significant after adjustment for other confounding variables (Table 2). As described in Table 3, the CAC score groups showed a significant positive association with serum UA levels (Model 0, P < 0.001). This statistical significance was retained throughout incremental adjustment from Model 1 to Model 3. In addition, based on these results, the multivariate-adjusted mean serum UA levels were estimated as 5.2 ± 0.1 mg/dL, 5.3 ± 0.1 mg/dL, and 5.6 ± 0.2 mg/dL in CAC groups 1, 2, and 3, respectively (P for trend = 0.001 and all pairwise comparisons were significant at P < 0.05) (Fig. 2).
Table 2.
The univariate and multivariate associations between serum uric acid level and other baseline parameters from linear regression analysis.
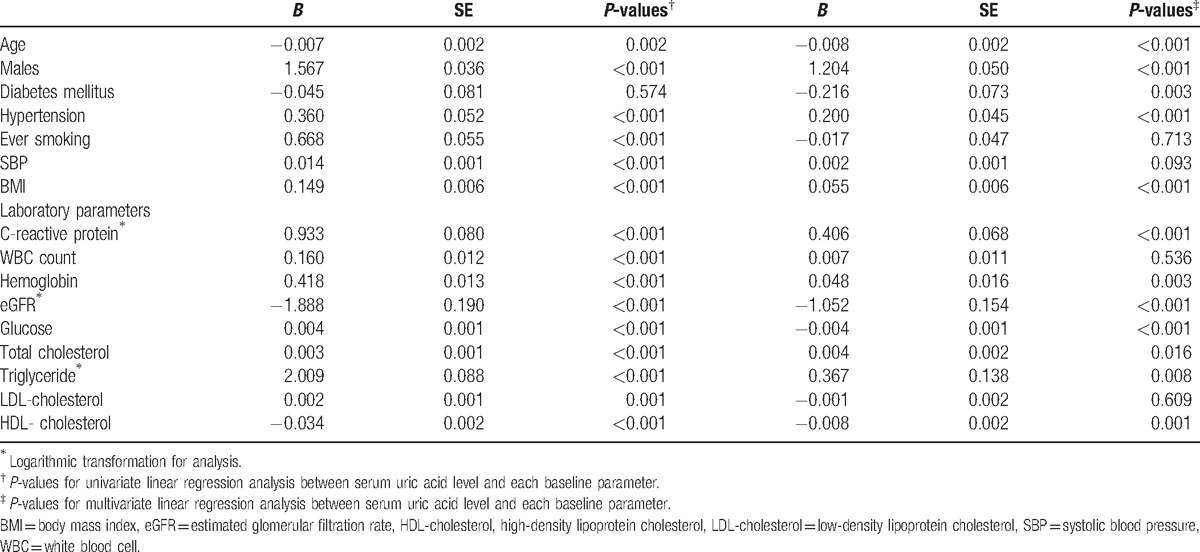
Table 3.
The univariate and multivariate-adjusted associations between serum uric acid levels and CAC groups from linear regression analysis.
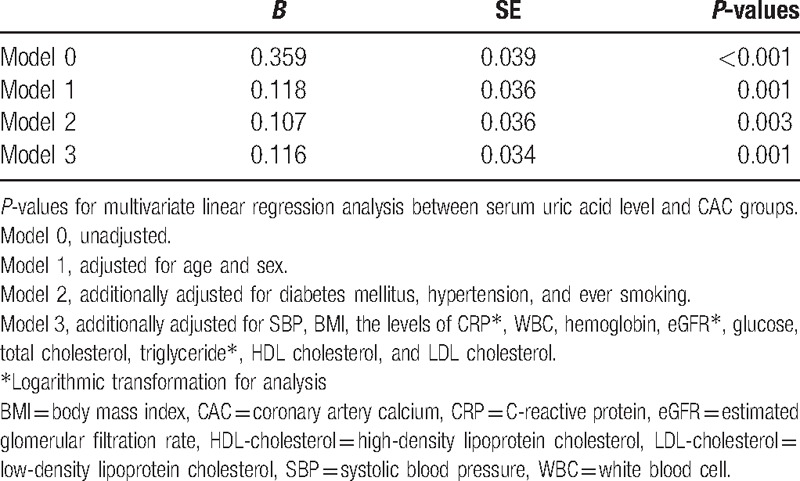
Figure 2.
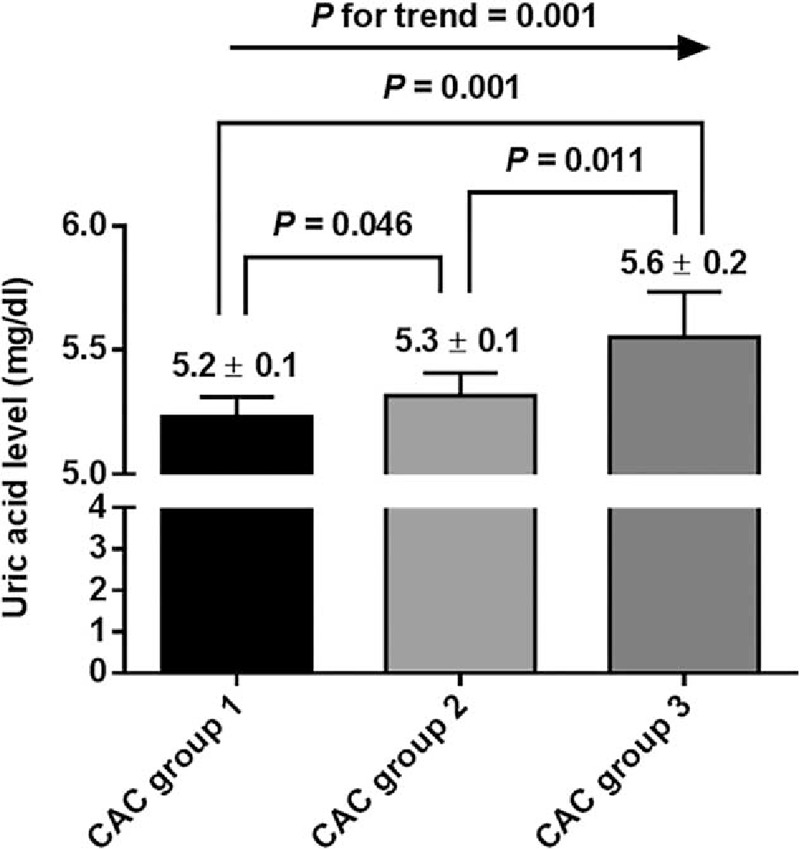
The multivariate-adjusted estimated mean levels of serum uric acid in each CAC group. CAC = coronary artery calcification.
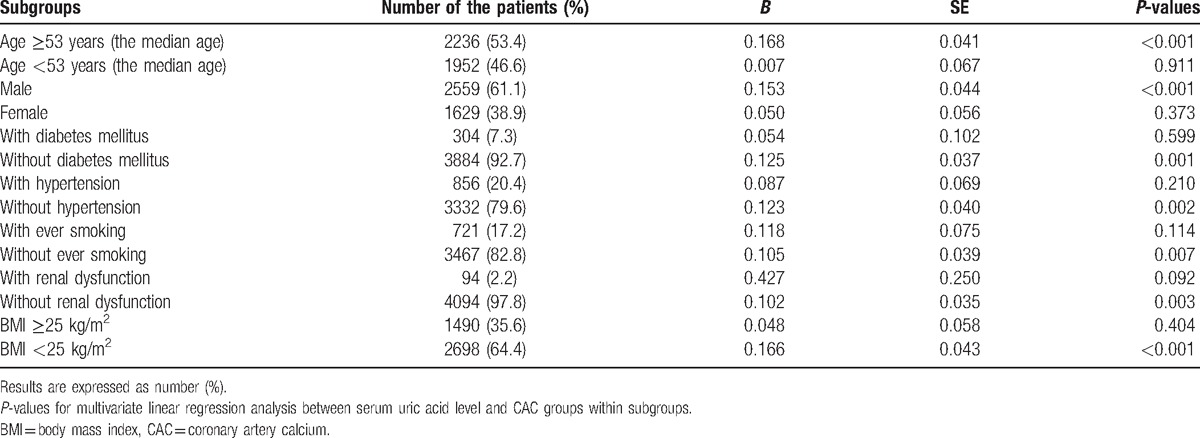
Finally, we investigated the interrelationship between CAC groups and serum UA level in our various subgroups. The differences in the number of patients, distribution of CAC scores, and serum UA levels are provided in Supplemental Table 2. Across all subgroups, the distributions of CAC scores were significantly heterogeneous. Advanced calcified coronary lesions were more likely to be found in older patients (median age ≥53 years), men, and those with DM, hypertension, history of smoking, renal dysfunction, and body mass index ≥25 kg/m2 (all P-values < 0.001). Similarly, male patients with hypertension, smoking history, renal dysfunction, or body mass index ≥25 kg/m2 were more likely to have higher serum UA levels compared to other patients (all P-values < 0.001). We then analyzed whether the independent associations between serum UA level and CAC scores were retained in these subgroups (Table 4). There were significant differences among the subgroups. The positive, independent association between serum UA level and CAC score was observed exclusively in subjects with the following characteristics: above the median age (≥53 years) (B = 0.168, P < 0.001); male gender (B = 0.153, P < 0.001) (Supplemental Figs. 3 and 4); BMI < 25 kg/m2 (B = 0.166, P < 0.001); no history of DM (B = 0.125, P = 0.001); hypertension (B = 0.123, P = 0.002); history of smoking (B = 0.105, P = 0.007); or renal dysfunction (B = 0.102, P = 0.003).
Table 4.
The multivariate-adjusted associations between serum uric acid level and CAC groups in subgroups from linear regression analysis.
4. Discussion
In this study, we found that serum UA levels were independently associated with various baseline parameters (Table 2) in relatively healthy subjects without overt coronary artery disease or symptomatic urate deposition disease. These findings were generally in agreement with previous studies that have been conducted in Asian populations.[22–25] The negative association between eGFR and serum UA was not surprising. It is well recognized that a decline in the renal excretion of UA is the most common cause of hyperuricemia. Hyperuricemia-induced renal dysfunction was also observed in some studies.[26,27] However, the causality between hyperuricemia and renal dysfunction needs further verification. The associations between serum UA levels, age, and gender may be explained by the opposite uricosuric effects of sex hormones on organic anion transporters. Androgens promote the elevation of serum UA, while estrogens inhibit it.[28] Therefore, as male age increased farther from the peak androgen level at adolescence and early adulthood as in this study, the more UA would be excreted. Similarly, this could account for the direction of the gender differences with respect to serum UA level. Furthermore, serum UA level was significantly associated with the main components of metabolic syndrome, including hypertension, increasing BMI, and serum levels of fasting glucose, triglycerides, and HDL-cholesterol. This relationship between UA and metabolic syndrome, or its components, has been commonly observed in previous reports.[29–31] At least one possible link between metabolic syndrome and hyperuricemia is that high serum insulin levels reduce renal UA excretion.[32] Furthermore, UA directly inhibited nitric oxide (NO) release.[33] Conversely, inhibition of xanthine oxidase, which is essential for UA formation, increased NO level in rats.[34] NO is not only an integral part of metabolic homeostasis,[35] but also of endothelial-dependent vasodilation. In this context, a strong positive association between UA level and hypertension can also be explained. Another potential explanation linking these mechanisms includes UA-induced inflammation with oxidative stress.[36] This mechanism could support our findings of a positive association between CRP and UA. Interestingly, DM has a significant negative association with serum UA level. That is, diabetic patients tend to have a significantly lower level of serum UA after adjusting for other confounding variables. Although the exact underlying cause of this relationship is not clear, this trend was also encountered in previous studies.[22,37] One feasible explanation for this finding is glucosuria-enhanced renal excretion of UA by inhibiting UA reabsorption in the proximal tubules.[38]
Furthermore, we demonstrated that serum UA level was independently associated with CAC score severity. We used CAC scores ≥300 for CAC group 3 (the highest category of CAC score) in our study. The clinical significance of this CAC score range has been well validated in asymptomatic, low to intermediate-risk individuals.[19] According to Greenland et al,[39] CAC scores ≥300 corresponded to a 15% 10-year coronary heart disease (CHD) risk, which was associated with 3.9-fold higher odds of CHD compared to a CAC score of 0. Similarly, CAC scores ≥300 were reported to be useful in identifying individuals at high risk for CHD (>20% 10-year risk for CHD) among those with low to intermediate risk for CHD (5–20% 10-year risk for CHD).[40,41]
It is still not clear if hyperuricemia is an independent predictor for or has a causal role in advanced calcified coronary atherosclerosis. However, recent evidence suggests that UA might play important roles in enhancing proinflammatory pathways that are crucial to the progression of atherosclerotic and metabolic lesions. This potential UA-induced vascular inflammation was linked to arterial intimal calcification. The mechanism is thought to involve inflammatory mediators including receptor activator of NF-κB ligand (RANKL), colony-stimulating factor 1 (CSF-1), tumor necrosis factor-α (TNF-α), and bone morphologic protein, as well as macrophage infiltration.[42,43] Collectively, we cautiously speculate that individuals with elevated serum UA are at greater risk for developing advanced atherosclerotic coronary calcification and future CHD than are those with a lower level of serum UA.
Based upon the distribution of CAC scores by subgroup, we next investigated the associations between serum UA levels and CAC scores in specified subgroups. The association between serum UA and CAC scores was found exclusively in individuals who were male, relatively older, less overweight, and without a history of DM, hypertension, smoking, or renal dysfunction (Table 4). The positive associations between serum UA levels and other surrogate markers of atherosclerosis have generally been validated in previous cross-sectional studies.[44–46] However, the results were not fully consistent depending on the measurement method and subgroup categories. Chen et al[46] suggests that there is a close association between serum UA level and atherosclerotic lesions regardless of the underlying comorbid conditions. In contrast, several other studies have been more compatible with our results in that the relationship between serum UA level and atherosclerotic disease depends on underlying comorbidities. For instance, subclinical atherosclerosis measured with the ankle-brachial index was associated with serum UA levels in men, but not in women.[45] This male predominance was also found in the relationship between UA levels and carotid atherosclerosis.[29] In addition, in one study of acute coronary syndrome, high serum UA levels were only associated with the severity of coronary atherosclerosis in patients without DM or hypertension.[15] The association between serum UA levels and carotid atherosclerosis was evident in patients with normal glucose metabolism, but not in those with impaired glucose metabolism or DM.[47] Similarly, this relationship was present in patients without metabolic syndrome, but not in those with metabolic syndrome.[48] According to Shankar et al,[44] peripheral arterial disease was significantly associated with serum UA level, but predominantly in nonsmoking and nondiabetic patients. Therefore, this literature and our results suggest that higher serum UA levels are more closely associated with subclinical atherosclerosis in elderly patients with fewer well-known cardiovascular risk factors than in those already affected by advanced atherosclerotic diseases. That is, in a patient with established atherosclerosis, a high serum UA level would have little effect on atherosclerosis, despite its proinflammatory potential.
The main strength of this study is that we recruited a relatively large number of individuals of both genders without underlying coronary artery disease or urate deposition disease. This design allowed us to incorporate, exclude, or adjust various confounding factors that potentially affected serum UA levels, including DM, hypertension, renal dysfunction, obesity, or UA-related medications. However, this study also has several limitations. Due to the inherent limitations of cross-sectional studies, we could not define any causal relationships among the serum UA levels, various confounders, and CACs.
In conclusion, we found that the serum UA levels were independently associated with the severity of coronary calcification as measured by MDCT. Subgroup analysis revealed that this relationship was exclusively observed in male individuals who were relatively older, less overweight (body mass index < 25 kg/m2), and without a history of DM, hypertension, smoking, or renal dysfunction. Future prospective and interventional studies are needed to clarify whether these associations are causal, or merely coincidental.
Supplementary Material
Footnotes
Abbreviations: BMI = body mass index, BUN = blood urea nitrogen, CAC = coronary artery calcification, CHD = coronary heart disease, CRP = C-reactive protein, CSF-1 = colony-stimulating factor 1, DM = diabetes mellitus, eGFR = estimated glomerular filtration rate, HDL = high-density lipoprotein, LDL = low-density lipoprotein, MDCT = multidetector computed tomography, MDRD = the Modification of Diet in Renal Disease, RANKL = receptor activator of NF-κB ligand, TNF-α = tumor necrosis factor-α, UA = uric acid.
The authors have no conflicts of interest to disclose.
Supplemental Digital Content is available for this article.
References
- [1].Bach MH, Simkin PA. Uricosuric drugs: the once and future therapy for hyperuricemia? Curr Opin Rheumatol 2014;26:169–75. [DOI] [PubMed] [Google Scholar]
- [2].Phelps P, Steele AD, McCarty DJ., Jr Compensated polarized light microscopy. Identification of crystals in synovial fluids from gout and pseudogout. JAMA 1968;203:508–12. [DOI] [PubMed] [Google Scholar]
- [3].Pessler F, Mayer CT, Jung SM, et al. Identification of novel monosodium urate crystal regulated mRNAs by transcript profiling of dissected murine air pouch membranes. Arthritis Res Ther 2008;10:R64. [DOI] [PMC free article] [PubMed] [Google Scholar]
- [4].Vasquez-Vivar J, Santos AM, Junqueira VB, et al. Peroxynitrite-mediated formation of free radicals in human plasma: EPR detection of ascorbyl, albumin-thiyl and uric acid-derived free radicals. Biochem J 1996;314(pt 3):869–76. [DOI] [PMC free article] [PubMed] [Google Scholar]
- [5].Anker SD, Leyva F, Poole-Wilson PA, et al. Relation between serum uric acid and lower limb blood flow in patients with chronic heart failure. Heart 1997;78:39–43. [DOI] [PMC free article] [PubMed] [Google Scholar]
- [6].Niskanen L, Laaksonen DE, Lindstrom J, et al. Serum uric acid as a harbinger of metabolic outcome in subjects with impaired glucose tolerance: the Finnish Diabetes Prevention Study. Diabetes Care 2006;29:709–11. [DOI] [PubMed] [Google Scholar]
- [7].Sundstrom J, Sullivan L, D’Agostino RB, et al. Relations of serum uric acid to longitudinal blood pressure tracking and hypertension incidence. Hypertension 2005;45:28–33. [DOI] [PubMed] [Google Scholar]
- [8].Turak O, Ozcan F, Tok D, et al. Serum uric acid, inflammation, and nondipping circadian pattern in essential hypertension. J Clin Hypertens (Greenwich) 2013;15:7–13. [DOI] [PMC free article] [PubMed] [Google Scholar]
- [9].Matsuura F, Yamashita S, Nakamura T, et al. Effect of visceral fat accumulation on uric acid metabolism in male obese subjects: visceral fat obesity is linked more closely to overproduction of uric acid than subcutaneous fat obesity. Metabolism 1998;47:929–33. [DOI] [PubMed] [Google Scholar]
- [10].Obermayr RP, Temml C, Gutjahr G, et al. Elevated uric acid increases the risk for kidney disease. J Am Soc Nephrol 2008;19:2407–13. [DOI] [PMC free article] [PubMed] [Google Scholar]
- [11].Choi HK, Ford ES. Prevalence of the metabolic syndrome in individuals with hyperuricemia. Am J Med 2007;120:442–7. [DOI] [PubMed] [Google Scholar]
- [12].Kim SY, Guevara JP, Kim KM, et al. Hyperuricemia and risk of stroke: a systematic review and meta-analysis. Arthritis Rheum 2009;61:885–92. [DOI] [PMC free article] [PubMed] [Google Scholar]
- [13].Holme I, Aastveit AH, Hammar N, et al. Uric acid and risk of myocardial infarction, stroke and congestive heart failure in 417,734 men and women in the Apolipoprotein MOrtality RISk study (AMORIS). J Intern Med 2009;266:558–70. [DOI] [PubMed] [Google Scholar]
- [14].Tseng CH. Independent association of uric acid levels with peripheral arterial disease in Taiwanese patients with Type 2 diabetes. Diabet Med 2004;21:724–9. [DOI] [PubMed] [Google Scholar]
- [15].Duran M, Kalay N, Akpek M, et al. High levels of serum uric acid predict severity of coronary artery disease in patients with acute coronary syndrome. Angiology 2012;63:448–52. [DOI] [PubMed] [Google Scholar]
- [16].Brodov Y, Behar S, Boyko V, et al. Effect of the metabolic syndrome and hyperuricemia on outcome in patients with coronary artery disease (from the Bezafibrate Infarction Prevention Study). Am J Cardiol 2010;106:1717–20. [DOI] [PubMed] [Google Scholar]
- [17].Franse LV, Pahor M, Di Bari M, et al. Serum uric acid, diuretic treatment and risk of cardiovascular events in the Systolic Hypertension in the Elderly Program (SHEP). J Hypertens 2000;18:1149–54. [DOI] [PubMed] [Google Scholar]
- [18].Elsevier Health Sciences, Lilly LS. Braunwald's Heart Disease Review and Assessment. 2015;312. [Google Scholar]
- [19].Greenland P, Alpert JS, Beller GA, et al. 2010 ACCF/AHA guideline for assessment of cardiovascular risk in asymptomatic adults: a report of the American College of Cardiology Foundation/American Heart Association Task Force on Practice Guidelines. Circulation 2010;122:e584–636. [DOI] [PubMed] [Google Scholar]
- [20].Levey AS, Bosch JP, Lewis JB, et al. A more accurate method to estimate glomerular filtration rate from serum creatinine: a new prediction equation. Modification of Diet in Renal Disease Study Group. Ann Intern Med 1999;130:461–70. [DOI] [PubMed] [Google Scholar]
- [21].Agatston AS, Janowitz WR, Hildner FJ, et al. Quantification of coronary artery calcium using ultrafast computed tomography. J Am Coll Cardiol 1990;15:827–32. [DOI] [PubMed] [Google Scholar]
- [22].Nakanishi N, Suzuki K, Kawashimo H, et al. Serum uric acid: correlation with biological, clinical and behavioral factors in Japanese men. J Epidemiol 1999;9:99–106. [DOI] [PubMed] [Google Scholar]
- [23].Zhang Q, Lou S, Meng Z, et al. Gender and age impacts on the correlations between hyperuricemia and metabolic syndrome in Chinese. Clin Rheumatol 2011;30:777–87. [DOI] [PubMed] [Google Scholar]
- [24].Nan H, Qiao Q, Dong Y, et al. The prevalence of hyperuricemia in a population of the coastal city of Qingdao, China. J Rheumatol 2006;33:1346–50. [PubMed] [Google Scholar]
- [25].Fu S, Luo L, Ye P, et al. Epidemiological associations between hyperuricemia and cardiometabolic risk factors: a comprehensive study from Chinese community. BMC Cardiovasc Disord 2015;15:129. [DOI] [PMC free article] [PubMed] [Google Scholar]
- [26].Iseki K, Ikemiya Y, Inoue T, et al. Significance of hyperuricemia as a risk factor for developing ESRD in a screened cohort. Am J Kidney Dis 2004;44:642–50. [PubMed] [Google Scholar]
- [27].Lee JE, Kim YG, Choi YH, et al. Serum uric acid is associated with microalbuminuria in prehypertension. Hypertension 2006;47:962–7. [DOI] [PubMed] [Google Scholar]
- [28].Ljubojevic M, Herak-Kramberger CM, Hagos Y, et al. Rat renal cortical OAT1 and OAT3 exhibit gender differences determined by both androgen stimulation and estrogen inhibition. Am J Physiol Renal Physiol 2004;287:F124–138. [DOI] [PubMed] [Google Scholar]
- [29].Ishizaka N, Ishizaka Y, Toda E, et al. Association between serum uric acid, metabolic syndrome, and carotid atherosclerosis in Japanese individuals. Arterioscler Thromb Vasc Biol 2005;25:1038–44. [DOI] [PubMed] [Google Scholar]
- [30].Onat A, Uyarel H, Hergenc G, et al. Serum uric acid is a determinant of metabolic syndrome in a population-based study. Am J Hypertens 2006;19:1055–62. [DOI] [PubMed] [Google Scholar]
- [31].Kawamoto R, Tomita H, Oka Y, et al. Relationship between serum uric acid concentration, metabolic syndrome and carotid atherosclerosis. Internal Med 2006;45:605–14. [DOI] [PubMed] [Google Scholar]
- [32].Galvan AQ, Natali A, Baldi S, et al. Effect of insulin on uric acid excretion in humans. Am J Physiol-Endocrinol Metab 1995;268:E1–5. [DOI] [PubMed] [Google Scholar]
- [33].Kang DH, Park SK, Lee IK, et al. Uric acid-induced C-reactive protein expression: implication on cell proliferation and nitric oxide production of human vascular cells. J Am Soc Nephrol 2005;16:3553–62. [DOI] [PubMed] [Google Scholar]
- [34].Khosla UM, Zharikov S, Finch JL, et al. Hyperuricemia induces endothelial dysfunction. Kidney Int 2005;67:1739–42. [DOI] [PubMed] [Google Scholar]
- [35].Cook S, Hugli O, Egli M, et al. Clustering of cardiovascular risk factors mimicking the human metabolic syndrome X in eNOS null mice. Swiss Med Wkly 2003;133:360–3. [DOI] [PubMed] [Google Scholar]
- [36].Tsouli SG, Liberopoulos EN, Mikhailidis DP, et al. Elevated serum uric acid levels in metabolic syndrome: an active component or an innocent bystander? Metabolism 2006;55:1293–301. [DOI] [PubMed] [Google Scholar]
- [37].Stamp LK, Chapman PT. Gout and its comorbidities: implications for therapy. Rheumatology (Oxford) 2013;52:34–44. [DOI] [PubMed] [Google Scholar]
- [38].Cook DG, Shaper AG, Thelle DS, et al. Serum uric acid, serum glucose and diabetes: relationships in a population study. Postgrad Med J 1986;62:1001–6. [DOI] [PMC free article] [PubMed] [Google Scholar]
- [39].Greenland P, LaBree L, Azen SP, et al. Coronary artery calcium score combined with Framingham score for risk prediction in asymptomatic individuals. JAMA 2004;291:210–5. [DOI] [PubMed] [Google Scholar]
- [40].Okwuosa TM, Greenland P, Ning H, et al. Distribution of coronary artery calcium scores by Framingham 10-year risk strata in the MESA (Multi-Ethnic Study of Atherosclerosis) potential implications for coronary risk assessment. J Am Coll Cardiol 2011;57:1838–45. [DOI] [PMC free article] [PubMed] [Google Scholar]
- [41].Simon A, Chironi G, Levenson J. Comparative performance of subclinical atherosclerosis tests in predicting coronary heart disease in asymptomatic individuals. Eur Heart J 2007;28:2967–71. [DOI] [PubMed] [Google Scholar]
- [42].Doherty TM, Asotra K, Fitzpatrick LA, et al. Calcification in atherosclerosis: bone biology and chronic inflammation at the arterial crossroads. Proc Natl Acad Sci U S A 2003;100:11201–6. [DOI] [PMC free article] [PubMed] [Google Scholar]
- [43].Otsuka F, Sakakura K, Yahagi K, et al. Has our understanding of calcification in human coronary atherosclerosis progressed? Arterioscler Thromb Vasc Biol 2014;34:724–36. [DOI] [PMC free article] [PubMed] [Google Scholar]
- [44].Shankar A, Klein BE, Nieto FJ, et al. Association between serum uric acid level and peripheral arterial disease. Atherosclerosis 2008;196:749–55. [DOI] [PubMed] [Google Scholar]
- [45].Li Y, Lu J, Wu X, et al. Serum uric acid concentration and asymptomatic hyperuricemia with subclinical organ damage in general population. Angiology 2014;65:634–40. [DOI] [PubMed] [Google Scholar]
- [46].Chen Y, Xu B, Sun W, et al. Impact of the serum uric acid level on subclinical atherosclerosis in middle-aged and elderly Chinese. J Atheroscler Thromb 2015;22:823–32. [DOI] [PubMed] [Google Scholar]
- [47].Wijnands JM, Boonen A, Dagnelie PC, et al. The cross-sectional association between uric acid and atherosclerosis and the role of low-grade inflammation: the CODAM study. Rheumatology (Oxford) 2014;53:2053–62. [DOI] [PubMed] [Google Scholar]
- [48].Takayama S, Kawamoto R, Kusunoki T, et al. Uric acid is an independent risk factor for carotid atherosclerosis in a Japanese elderly population without metabolic syndrome. Cardiovasc Diabetol 2012;11:2. [DOI] [PMC free article] [PubMed] [Google Scholar]
Associated Data
This section collects any data citations, data availability statements, or supplementary materials included in this article.