

Abstract
To function in a biological setting, RNA binding proteins (RBPs) have to discriminate between alternative binding sites in RNAs. This discrimination can occur in the ground state of an RNA-protein binding reaction, in its transition state, or in both. The extent by which RBPs discriminate at these reaction states defines RBP specificity landscapes. Here, we describe the HiTS-Kin and HiTS-EQ techniques, which combine kinetic and equilibrium binding experiments with high throughput sequencing to quantitatively assess substrate discrimination for large numbers of substrate variants at ground and transition states of RNA-protein binding reactions. We discuss experimental design, practical considerations and data analysis and outline how a combination of HiTS-Kin and HiTS-EQ allows the mapping of RBP specificity landscapes.
Introduction
In typical eukaryotic cells thousands of different proteins interact with tens of thousands of different RNAs (1–3). Binding patterns for a given RNA binding protein (RBP) are thought to arise from its inherent binding preference for each potential RNA binding site and from a host of cellular parameters, including accessibility of a given binding site, expression levels of RNAs and RBPs, and interactions between the RBP and other proteins (2). An important first step towards understanding RBP-RNA binding patterns is the delineation of inherent binding preferences of RBPs for many or even all potential binding sites in RNA (4).
The extent to which an RBP discriminates between different potential RNA substrates defines its inherent specificity (2). Several experimental approaches have been recently developed to assess inherent RBP specificity in vitro (5–9). Most of these techniques successfully identify RNA sequence and structure signatures of the most preferred substrate variants for the RBP in question. Although powerful, such approaches are not well suited to explain RBP binding to less preferred substrate variants, which are often bound in the cell (2, 3). In addition, these techniques usually assess protein-RNA binding under equilibrium conditions, and thus do not account for binding kinetics, which are likely to be an important determinant of cellular RNA protein interactions, given that biological processes are generally kinetically controlled (2).
To determine the impact of kinetics on inherent RBP specificities, we developed an approach to simultaneously measure the kinetics of protein binding to thousands of RNA variants sequence variants. The technique, HiTS-Kin, combines high throughput sequencing with experimental approaches and data analysis from classic enzymology (10). To account for the fact that inherent RBP specificity can arise from discrimination between substrate variants in ground and transition states (Fig. 1), we have recently expanded the HiTS-Kin approach by a complementary technique, HiTS-EQ (11). The combination of the HiTS-Kin and HiTS-EQ approaches allows assessment and, to a large extent, deconvolution of RBP discrimination in ground and transition state (11). The extent of substrate discrimination at different reaction stages the is called the RBP specificity landscape (11).
Figure 1.
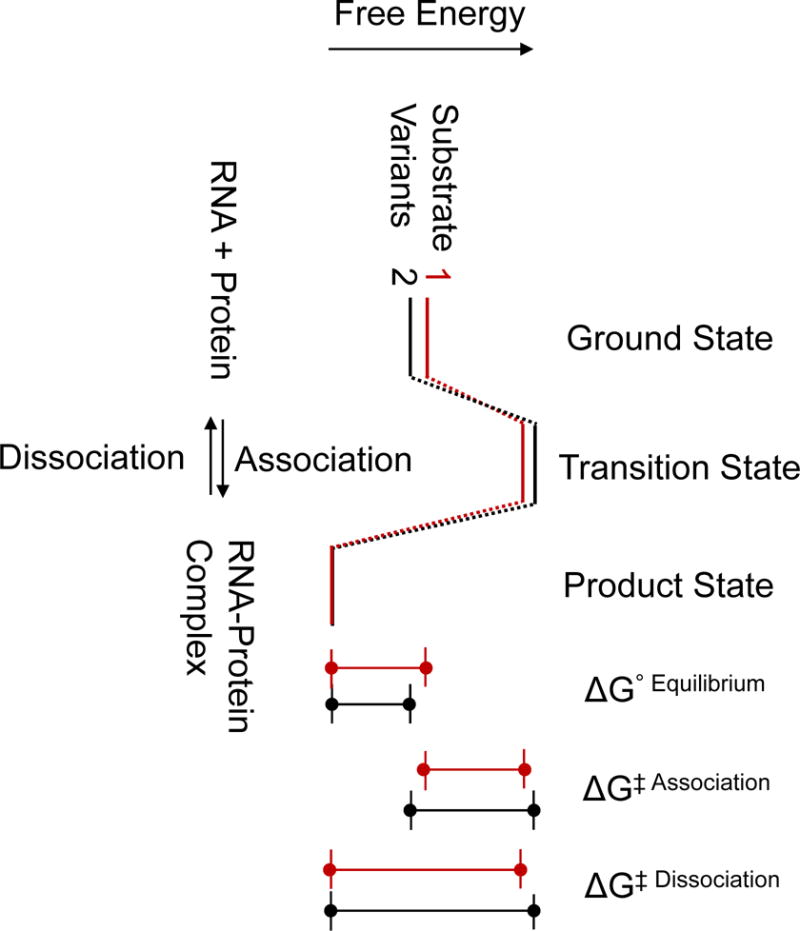
Free energy landscape for a first-order, reversible RNA-protein binding reaction. Substrate variants 1 and 2 denote two different substrates. The size marks indicate for each substrate variant the free energy differences between ground and product state (ΔG°Equilibrium), free energy differences between ground and transition state (ΔG‡Association), and free energy differences between transition and product state (ΔG‡Disssociation).
Here, we outline the experimental approaches for the HiTS-Kin and HiTS-Eq techniques and describe how the combination of these approaches allows the mapping of RBP specificity landscapes. We discuss experimental design, practical experimental considerations and data analysis. HiTS-Kin and HiTS-EQ approaches are widely applicable for RNA binding proteins and RNA processing enzymes or enzyme complexes, even in cell extracts and conceivably even in cells. The techniques do not require specialized equipment or advanced computational capacity. HiTS-Kin and HiTS-EQ readily translate conventional techniques that measure binding or processing of single RNA substrates into high throughput techniques that simultaneously characterize thousands of substrates.
Rationale and Experimental Strategy
We initially developed HiTS-Kin and HiTS-EQ to interrogate the specificity landscape of the C5 protein unit of E.coli RNase P (Fig. 2) (11). Bacterial RNase P is a ribonucleprotein enzyme that removes 5′ leader sequences from pre-tRNAs (12). The C5 protein binds the leader sequences (13). As noted, HiTS-Kin and HiTS-EQ are, however, applicable to any RNA-protein system, provided protein-bound or processed RNA can be separated from unbound or unprocessed RNA.
Figure 2.
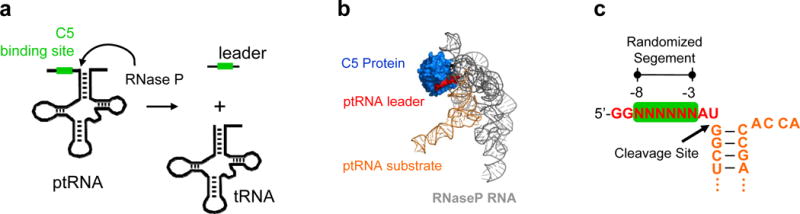
Processing of pre-tRNA by RNase P. (a) pre-tRNA processing reaction by RNase P. (b) Structure of the RNase P holoenzyme (31). (c) pre-tRNA substrate indicating the randomized region. The tRNA body is based on non-initiator pre-tRNAMet from E.coli (10). Only the substrate segment with the randomized region is shown for clarity.
The core idea of the HiTS-Kin and HiTS-EQ approaches is the simultaneous interrogation of all possible sequence variants in and around the protein binding site (Fig. 2c). The goal of the experiments is to characterize for each substrate variant the free energies associated with differences in ground, product, and transition states (Fig. 1). These free energy differences for each substrate variant constitutes the specificity landscape for a given RBP (2, 11). A specificity landscape can be established by measuring for all or most of the substrate variants either two of the (i) association rate constants, (ii) the equilibrium binding constants, or (iii) the dissociation rate constants (Fig. 1). The obtained specificity landscape indicates the extent to which the RBP discriminates between different sequence variants at the RNA binding step, at the lifetime of the RNA-protein complex, or through a combination of both (Fig. 1). Rate and equilibrium constants are readily converted into free energy values that can be correlated with free energy values calculated from structures of RNA-protein complexes (14). Models that comprehensively explain structure function relationships that govern inherent RBP specificity can thus be developed, analogous to efforts modeling transcription factor specificity (15).
HiTS-Kin and HiTS-EQ reactions are set up and monitored like reactions for individual substrates, except that a pool of substrate variants is used. The substrate pool is subjected to RNA processing or protein binding reactions. Processed (protein bound) or unprocessed (not protein bound) RNA for each timepoint or RBP concentration is isolated and converted into a cDNA library for Next Generation Sequencing (NGS), which are then sequenced. Rate constants (HiTS-Kin) and equilibrium binding constants (HiTS-EQ) are determined, and linear free energy relationships between rate constants and equilibrium binding constants are used to derive free energy changes for the various reactions stages for each substrate variant (Fig. 3).
Figure 3.
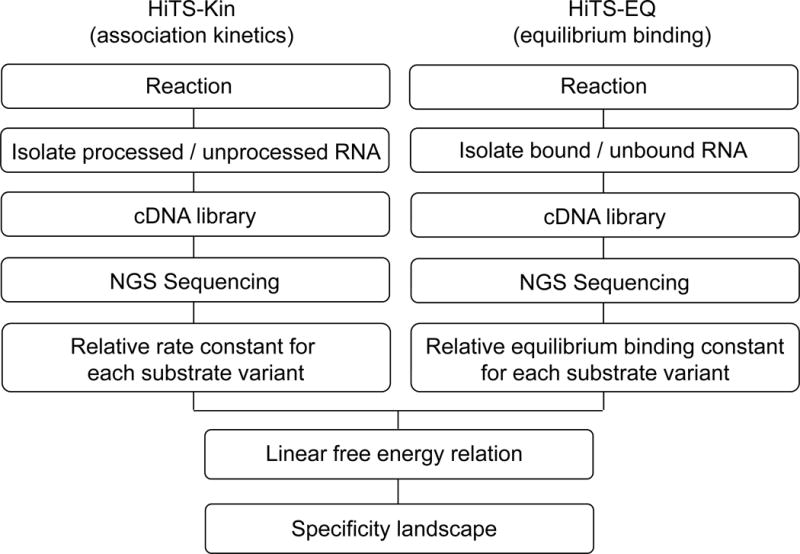
Principal steps in the HiTS-Kin and HiTS-EQ procedures and their combination to establish a specificity landscape
Substrate design
Substrates for HiTS-Kin and HiTS-EQ experiments are generated by incorporating a segment of randomized sequence into the RNA construct at the protein binding site (Fig. 2c). This can be accomplished by in vitro transcription from a DNA template with a randomized region, or by chemical synthesis of the RNA with a randomized segment. The length of the randomized segment determines the required number of sequencing reads in the experiment and thus the cost of the experiment, which is dictated largely by sequencing expenses. The binding sites of most RBPs range from 3 to 6 nucleotides (1, 2). Considering a sequencing depths of roughly 103 reads for each sequence variant, 4 data points per experiment and a replicate; a single lane in a Hi-Seq 2500 flow cell (3·108 sequencing reads) thus allows multiplexing of > 500 experiments for substrates with 3 randomized positions, or roughly 9 experiments for substrates with 6 randomized positions (Tab. 1).
Table 1.
The connection between number of randomized nucleotides, sequencing reads and experiments that can be analyzed in a single lane of a HiSeq 2500 flowcell. The calculation assumes 300,000,000 reads per flowcell lane.
| Randomized Nucleotides | Sequence Variants | Sequencing Depths (a) | Data points (4) (b) | Replicate | Number of Experiments (c) |
|---|---|---|---|---|---|
| 3 | 64 | 64,000 | 256,000 | 512,000 | 585 |
| 4 | 256 | 256,000 | 1,024,000 | 2,048,000 | 146 |
| 5 | 1,024 | 1,024,000 | 4,096,000 | 8,192,000 | 36 |
| 6 | 4,096 | 4,096,000 | 16,384,000 | 32,768,000 | 9 |
| 7 | 16,384 | 16,384,000 | 65,536,000 | 131,072,000 | 2 |
| 8 | 65,536 | 65,536,000 | 262,144,000 | 524,288,000 | 0.6 |
Each individual sequence variant is sequenced 1,000 times.
Three sample collection points (timepoints or protein concentration) plus the zero point
Experiments (including replicate) that can be sequenced in a single lane of a HiSeq 2500 flowcell (300,000,000 reads per lane).
It might prove informative to randomize not only the number of nucleotides in the exact protein binding site, but also adjacent nucleotides, because neighboring nucleotides can impact protein binding (16). It is possible to randomize RNA segments larger than 7 nucleotides, but for such constructs not all sequence variants can be monitored in a single sequencing lane. Another important consideration for selecting the size of the randomized segment is the formation of RNA structure that involves the randomized segment. Increasing the size of the randomized segment also increases the number sequence variants with diminished binding site accessibility, which is reflected in ground state effects for these substrate variants (11). Even transient RNA structures of 2 to 3 basepairs formed between the randomized region and surrounding substrate can cause sizable ground state effects (2). Since these ground state effects can be RNA-construct-specific and thus irrelevant to the RBP specificity, it is advisable to keep randomization of RNA segments beyond the protein binding site to a minimum. In addition, it is useful to alter other substrate regions, if possible, and repeat the measurements. Ground state effects caused by RNA structure of the randomized region will vary with the surrounding substrate sequences (11).
Reaction Setup
HiTS-Kin reactions
A HiTS-Kin experiment aims to delineate rate constants for each individual substrate. It is possible to measure protein-RNA binding, dissociation of a protein from RNA, or processing of RNAs. Reactions are set up as for an individual substrate, except that the substrate pool with all sequence variants is used. It is important to set up the HiTS-Kin experiment to enable monitoring of the reaction for all or at least for most of the substrate variants. For the least reactive binding variants the change in sequence reads between time points can be small, and associated signal to noise ratios are modest. Appropriate experimental approaches are thus required to account for fast and slow reactions in a substrate population. The extraction of rate constants generally requires the consideration of internal competition kinetics (17). We describe the data analysis later in this paper.
For RNA processing reactions it is important to consider which reaction step is rate limiting under the chosen reactions conditions. For example, substrate discrimination by RNase P occurs mainly during the binding step and only little selectivity is observed during the actual chemical step of the reaction (11). Therefore, reaction conditions have to ensure that substrate binding is rate limiting. If it is possible to experimentally isolate specific reaction steps, substrate discrimination at each of these steps can be specifically probed. Finally, the data analysis requires knowledge about the overall extent of the reaction (10, 11). It is therefore important to ensure that this parameter can be accurately measured.
HiTS-EQ reactions
A HiTS-EQ experiment aims to determine equilibrium binding constants for each individual substrate. As in HiTS-Kin experiments, reactions are set up like for an individual substrate, except that a pool with all sequence variants is used. It is important to verify that equilibrium is reached during the reaction time. HiTS-EQ measurements can be conducted with protein or RNA excess. Protein excess allows for a potentially simpler data analysis because each binding reaction can be treated as a simple competitive binding reaction, provided the concentration of free protein in the reaction remains largely unchanged. If this condition cannot be fulfilled, but also for RNA excess over the protein, the vast system of coupled equilibria for all substrate variants has to be considered. However, the data treatment is similar to that applied to internal competition kinetics (11). It is important to note that with RNA excess only preferred substrate variants will eventually bind to the protein. Therefore, insight under these reaction conditions might be limited. As noted for HiTS-Kin experiments, it is critical to determine the final extent of the binding reaction (17).
Sample collection
Choice of time points or concentrations
To obtain maximal information from HiTS-Kin or HiTS-EQ experiments, it is critical to capture the full spectrum of rate constants or affinities, from fast (tight) for preferred substrate variants to slow (weak) for those least preferred. Rate constants for substrate variants can differ by several orders of magnitude (10). Timepoints (HiTS-Kin) or protein concentrations (HiTS-EQ) must be chosen accordingly. Since the sample collected at each point has to be converted into and analyzed as separate sequencing library, sequencing capacity can become limiting for substrates with more than 6 randomized nucleotides (Tab. 1). On a practical level, three points, plus the zero point are a good starting value (18) (Tab. 1).
RNA processing or RNA-protein binding reactions in vitro often do not proceed to completion. This is potentially true for HiTS-Kin and HiTS-EQ as well. Moreover, it is possible that not all sequence variants react to the same extent. If the final reaction amplitude is considerable (< 80%), the final extent of reacted substrates should be determined in a dedicated sample (17, 18).
If rate constants or affinities for individual substrates vary by several orders of magnitude, depletion or accumulation of certain substrate species will greatly differ in sample points. For example, in a HiTS-Kin experiment at an early timepoint, or at low protein concentration for HiTS-EQ, only preferred substrates react. If the unreacted substrate pool is measured, only few variants are depleted and most other variants remain largely unchanged. For those variants, no instructive data can be obtained from this sample point, other than a limit for rate constant or affinity. This issue can be mitigated by measuring both, unreacted (free) and reacted (bound) RNA. However, low sequence complexity in samples with few sequence variants can cause problems at the sequencing step. For late timepoints, the problem is reversed, and the unreacted RNA pool potentially contains only a small number of slowly reacting variants. Again, collecting reacted sample as well provides a possible solution. A detailed discussion of how the reaction extent at sample collection points affects HiTS-Kin data can be found in a recent publication (18).
RNA sample collection
The physical sample collection step at a time or concentration point should minimize bias for or against certain sequence variants. As is customary for work with RNA, nuclease contamination, buffers with basic pH (> pH 8) and high concentrations of divalent cations (> 5 mM) should be avoided to eliminate RNA degradation, which diminishes the amount of sample and potentially biases the substrate pool. For PAGE elution and ethanol precipitation steps it is important to ensure that the complete RNA sample is collected. Quantitative precipitation and efficiency of other sample handling steps are conveniently monitored by radiolabeling of the substrate pool (10).
In addition to maintaining sample integrity during isolation, it is advisable to maximize the amount of RNA that is collected for each datapoint. As discussed below, too little RNA in a given sample can lead to aberrant PCR amplification during library preparation. Although the experimental design detects aberrantly amplified variants and provides the potential to correct for “PCR artifacts”, we note that very small amounts of RNA can preclude the generation of usable libraries. It might thus be advisable to generate and possibly pool multiple samples for points that contain little RNA, in order to generate sufficient material for each datapoint.
cDNA library preparation and Illumina Sequencing
The RNA sample for a given timepoint is converted into a cDNA library for Next Generation Sequencing (Fig. 4). While HiTS-Kin and HiTS-Eq are compatible with all NGS approaches, we exclusively used the Illumina sequencing platform, which provides the desirable large numbers of short sequencing reads. Ideally, the RNA substrate construct contains the binding sites for the RT primer (first strand synthesis) and PCR primers (Fig. 4). This substrate design avoids nuclease digestion and ligation steps, which potentially biases the substrate pool (19).
Figure 4.
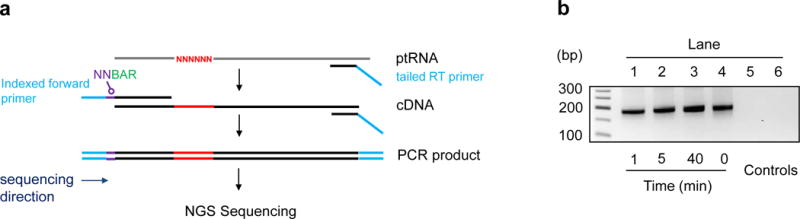
Preparation of cDNA libraries for Illumina sequencing. (a) Experimental scheme for library generation (ptRNA: pre-tRNA; NN: degenerate barcode; BAR: indexing barcode). (b) Representative cDNA libraries for samples at indicated timepoints of the RNase P processing reaction (10). Controls: lane 5 - no RNA, lane 6 - no reverse transcriptase.
Efficient first strand synthesis requires a minimal amount of RNA, although techniques exist that reportedly require only miniscule RNA amounts (20). The efficiency of first strand synthesis is not specifically tested in our protocol and has generally not been problematic, because the amount of RNA in a sample can be readily increased by performing multiple reactions. However, if experimental replicates reveal inconsistencies even with cDNA libraries that pass pre-sequencing quality controls, the fist strand synthesis might be problematic. If necessary, first strand synthesis can be monitored using a radiolabeled RT primer or radiolabeled dNTPs, and subsequent PAGE analysis of the extended products.
Following first strand synthesis, the sample is PCR-amplified (Fig. 4). The forward primer contains, in addition to the substrate binding site, the sequencing adapters, a barcode for multiplexing multiple samples in a single sequencing run, and a segment with two randomized nucleotides (degenerate barcode) (Fig. 4). Use of a degenerate barcode was pioneered by the iCLIP technique to indicate over- or under-amplification of sequence variants during PCR (21). The two randomized nucleotides generate a distribution of 16 different variants over the entire cDNA library. For each sequence variant, this distribution should essentially mirror the overall distribution. In practice, certain variants of the degenerate barcode are over- or underrepresented. Such aberrations indicate “PCR artifacts”. A cutoff is defined below which a variant of the degenerate barcode is considered a PCR artifact. We defined this cutoff by a Chi-squared test, and discarded the entire RNA sequence variant that showed such an artifact, because a relatively small number of substrate variants was affected (10). However, it is possible to correct for over- or under-amplified variants of the degenerate barcode by normalizing the reads with an aberrant level of degenerate barcode to the distribution that is expected from the entire library. Although the degenerate barcode identifies PCR artifacts and allows for their correction, it does not preclude the possibility of grossly aberrant PCR amplification that can render an experiment unusable. In our experience, 10–14 PCR cycles provide robust libraries, when starting with roughly 1 pmol isolated RNA and dilution of the RT reaction by a factor of 100 (18).
Following the PCR amplification, sample quality and concentration of the library is assessed, preferably on a Bioanalyzer, although an agarose gel can also be used. The sample should be homogenous and exactly of the expected size. Errors introduced during the Illumina sequencing runs are generally negligible, given that the number of sequence reads for each variant (> 100) significantly exceeds the small error rate of the Ilumina sequencing procedure (~ 0.25%) (18).
Data proccessing and calculation of rate and equilibrium constants
Illumina sequencing reads are demultiplexed, if applicable. Adaptor sequences are removed, although in many cases this is not strictly necessary. Next, for each sequence variant the distribution of the 16 variations of the degenerate barcode are determined, and compared to the distribution of the barcode variants from all obtained reads. We have used a chi-squared test to compare distributions of the degenerate barcode sequences for each substrate variant (10). A variant outside a predetermined cutoff is either discarded, or corrected for, as outlined above. The number sequencing reads for every sequence variant is then counted for each timepoint for HiTS-Kin experiments, or each protein concentration point for HiTS-EQ experiments.
To calculate binding rate constants from HiTS-Kin data, we employ internal competition kinetics. This approach was developed to evaluate kinetic isotope effects (22). For HiTS-Kin, internal competition kinetics considers the competition of all substrate variants for binding to the protein. The development of mathematical models to analyze reactions with multiple alternative substrates have been thoroughly discussed in previous papers, and the interested reader is referred to these publications (10, 17, 18). A relative rate constant (krel) is calculated that describes the rate constant for each sequence variant, compared to a chosen reference variant, according to Equation 1 (10).
| (1) |
(Ri: ratio between the given substrate variant i and the reference substrate at the reaction time t; Ri,0 : ratio between the given substrate variant i and the reference substrate at the reaction start (time zero). These ratios are calculated from NGS read numbers (10). f: reaction amplitude for the overall reaction (entire substrate pool) at the reaction time t, determined by PAGE; X: mole fraction for the given substrate variant i at the reaction time t. For a detailed derivation of this equation, see Guenther et al. (10))
This equation does not consider different reaction amplitudes for different sequence variants. However, it is possible to include terms that account for potential differences in the final reaction amplitude for different sequence variants (17). If such terms are included, the final reaction amplitude for all sequence variants must be determined (17).
In theory, only a single timepoint is necessary to calculate a krel value for a given sequence variant. In practice, krel values calculated and averaged from multiple timepoints provide more robust results. As noted above, for proteins that show a large range of discrimination between sequence variants, samples taken at early or very late timepoints, when only few variants have reacted or remain, might not provide reliable rate constants, since only a small fraction of all variants is changed between the zero and the sample timepoint. For this reason, it is important to assess the reproducibility of the measurements, as is good practice for all sequencing approaches.
To determine equilibrium binding constants from HiTS-EQ experiments we consider competition of all substrates for the protein. In analogy to the HiTS-Kin approach, we calculate a relative equilibrium association constant (KArel), compared to a chosen reference variant. Use of relative association equilibrium constants ensures that preferred substrates are reflected by higher values of KArel, which allows an intuitive comparison to relative rate constants obtained by the HiTS-Kin experiments. Values for KArel are calculated according to Equation 2 (11).
| (2) |
(P: protein concentration, Si: concentration of substrate variant i at the protein concentration P at equilibrium; Sr: concentration of reference substrate at the protein concentration P at equilibrium; Si,0: concentration of substrate variant i without protein; Sr,0: concentration of reference substrate without protein. these concentrations are calculated from NGS read numbers, normalized by the overall concentration of the RNA used in the reaction. For a detailed derivation of this equation, see Lin et al. (11))
Obtained rate or equilibrium binding constants are plotted as histograms that describe rate constant or affinity distributions (Fig. 5). The width of these distributions indicates to which extent a given protein can discriminate between different sequence variants at the measured kinetic step or at equilibrium (2). Substrate variants at the high affinity or high rate constant side of the distribution represent the preferred substrates (2).
Figure 5.

Distributions of relative affinities (KArel) and relative rate constants (krel). Logarithmic plots convey proportionality to free energy. The star marks fast reacting species or those with high affinity, e.g., preferred substrates. This region of the distribution is often associated with a consensus motif, while other regions of the distribution are not (2). Shown data are for lnkrel of the C5 protein of RNase P (10).
It is important to validate relative rate and equilibrium binding constants for selected sequence variants by independent methods (10, 11, 16). Validation reactions can also provide absolute rate or equilibrium constants, and it is thus possible to convert relative parameters from HiTS-Kin and HiTS-EQ experiments to absolute rate and equilibrium constants.
Binding models
HiTS-Kin and HiTS-EQ experiments provide rate and equilibrium constants for the entire sequence space of a given RBP. This is an excellent basis to develop binding models beyond probability sequence logos of consensus sequences. The simplest binding model is a position weight matrix (PWM), which represents a score (coefficient) for each nucleotide in the binding site (Fig. 6a). The PWM is calculated from all rate or equilibrium binding constants by linear regression (23, 24). PWMs consider each nucleotide in isolation, but frequently fail to explain high or low ranges of affinity or rate constant distributions (2, 10, 24).
Figure 6.

Binding models for RBPs. (a) Position Weight Matrix (PWM) for a RNA binding site with six nucleotides (Positions 1–6). Colored dots in the plot depict (linear) coefficients of a regression analysis of the complete affinity distribution for every base at each position (10). The coefficient for each base corresponds to the contribution of the nucleotide at the given position to the overall binding free energy. Note that coefficients are calculated in relation to a reference sequence. (Shown data: PWM for the C5 protein of RNase P (10)) (b) Binding model considering interactions between two bases. Pairwise Interaction Matrix (PIM, or Dinucleotide Weight Matrix - DWM) for a RNA binding site with six nucleotides. Red lines show the possible pairwise couplings between each two nucleotides. Colored fields in the heatmap indicate the (linear) coefficient for each of the 16 pairwise nucleotide permutations at each two positions. A yellow field indicates that a given nucleotide combination promotes binding, a blue field indicates binding inhibition. (Shown data: PIM for the C5 protein of RNase P (10)).
Better reflections of affinity or rate constant distributions can be accomplished by considering functional coupling between at least two nucleotides in the binding model (dinucleotide weight matrices, DWM; or pairwise interaction matrices, PIM) (Fig. 6b). These models are calculated by assigning a score to each combination of two nucleotides and then fitting affinity or rate constant distributions by linear regression (2, 10, 24). PIMs or DWMs can indicate complex functional coupling between nucleotides in the protein binding site, including basepairs within the binding site and whether basepairing promotes or inhibits protein binding. For example, in our experiments on the C5 protein, a G in position 1 and C in position 2 promotes binding markedly more than A in position 1 and A in position 2 (Fig. 6b).
Functional coupling between more than two nucleotides can be incorporated into binding models if PIM or DWMs fail to adequately explain measured affinity or rate constant distributions. In principle, such higher order coupling can be accounted for as in PIMs or DWMs, but the number of terms in the resulting equations might approach the number of available data points, in which case the model would not be instructive or unique. There are, however, alternative approaches to assess functional coupling between more than two nucleotides, including hidden Markov models, neural network analysis, decision tree guided approaches, and Bayesian networks (25–28).
Linear Free Energy Relationships and Specificity Landscapes
To establish a specificity landscape from rate and equilibrium constant distributions, the two respective distributions must be correlated with each other. Relative rate and equilibrium constants for each substrate variant are plotted versus each other, preferably on a logarithmic scale, because this representation is directly related to free energy changes (11) (Fig. 7). This approach is analogous to linear free energy relationships (LFER) in classical physical chemistry. Of note, a LFER assumes a simple one-step reaction mechanism and a common rate-limiting step for all substrates. The correlation of relative rate and equilibrium constants for a given substrate variant indicates to which extent changes in the ground state, transition state, or in both states contribute to substrate discrimination (Fig. 8). This information constitutes the specificity landscape for a given RBP.
Figure 7.
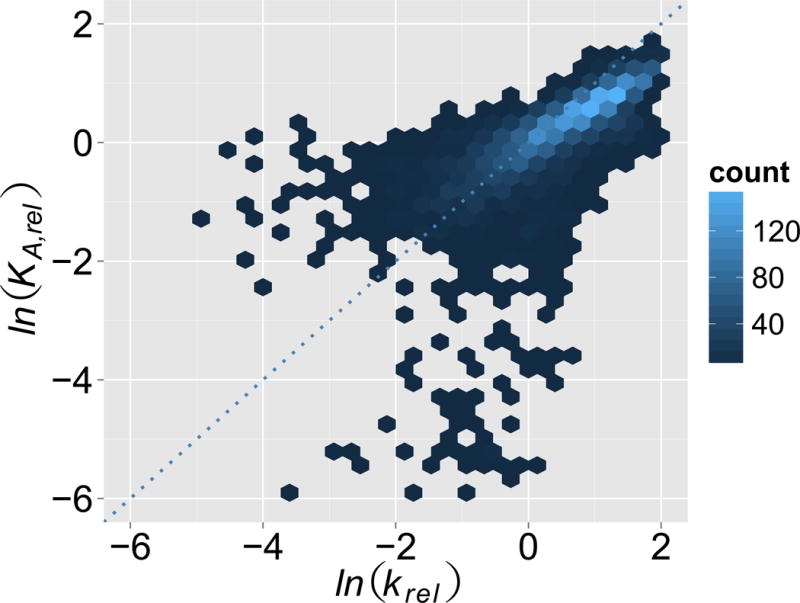
Representative linear free energy relation between HiTS-Kin and HiTS-EQ data. Correlation between relative equilibrium binding constants (KArel) and relative association rate constants (krel) for each of 4,096 substrate variants of the C5 binding site in RNase P (11). Data are shown as density plot, to emphasize clustering of many points in a relatively small region of the plot. The color bar indicates the density of sequence variants in each plot segment.
Figure 8.

Basic guide for the interpretation of linear free energy relations between HiTS-Kin and HiTS-EQ data. Column (a): Numbers mark scenarios for a given substrate variant, compared to the reference substrate (GS: ground state; TS: transition state; upward arrow: substrate variant shows n increased free energy in the ground or transition state, compared to the reference substrate; downward arrow: substrate variant shows decreased free energy in the ground or transition state, compared to the reference substrate; n.c.: no change). Column (b): Free energy plots for the respective scenarios. The reference substrate is black, the substrate variant red. Column (c): Differences in transition state energy (HiTS-Kin), and binding free energy (HiTS-EQ) compared to the reference substrate for each scenario, along with the differences in relative rate and equilibrium association constants. Column (d), left plots: Differences in transition and binding free energy plotted versus each other (black dot: reference substrate, red dot: substrate variant). Right plots: Corresponding differences in logarithmic plots of rate and equilibrium constant (black dot: reference substrate, red dot: substrate variant). This plot is analogous to the plot shown in Fig.7.
The interpretation of the LFER plot is somewhat intricate, since relative rate and equilibrium constants are plotted and because rate constants correlate inversely with free energy changes, while equilibrium association constants directly correlate with free energy changes (Fig. 8). Nevertheless, it can be clearly and quantitatively determined whether discrimination between substrate variants occurs in the ground state (Fig. 8). In some cases it is possible to define whether discrimination occurs in the transition state, or in both, ground and transition state (Fig. 8). It is important to keep in mind that all effects are relative to the reference variant. In principle, it is possible to convert relative rate and equilibrium constants to absolute constants and correlate these.
This empirical LFER analysis allows the classification of substrate variants into several subgroups. For example, groups with higher, or lower ground state energy, relative to the reference substrate can be established, and binding models for these subgroups can be derived, which can reveal whether and how substrate discrimination differs in ground and transition states (2, 11). Ground state impact is often associated with RNA structure, both transient or persistent (2, 11).
Conclusions and Outloook
The HiTS-Kin and HiTS-EQ approaches, the associated LFER analysis and the resulting specificity landscape provide unprecedented insight into the energetic basis of inherent RBP specificity. Specificity landscapes might aid the interpretation of cellular RBP-RNA binding patterns determined by iCLIP. Close correlation of specificity landscapes with cellular RBP binding patterns would suggest that RNA binding of a given RBP in the cell is largely dictated by its inherent specificity. Divergence between cellular binding patterns and inherent RBP specificity would indicate that other cellular factors dictate RBP binding, including RNA structure, other proteins, or a combination thereof. The comprehensive information contained in specificity landscapes might also provide novel insight into the structural basis of RBP specificity. It might be possible to model structural changes for substrate variants in RNA-protein complexes, based on existing structures, and on the wealth of energetic information in the specificity landscape.
Highlights.
The HiTS-Kin approach utilizes next generation sequencing to simultaneously determine rate constants for RNA-binding proteins for thousands of substrate variants.
The HiTS-Eq approach utilizes next generation sequencing to simultaneously determine equilibrium binding constants for RNA-binding proteins for thousands of substrate variants.
A combination of HiTS-Kin and HiTS-Eq data reveal to which extent substrate discrimination of RNA-protein binding reactions occurs in the ground state, in the transition state, or in both.
Practical and conceptual considerations for experimental design and data analysis of the HiTS-Kin and HiTS-Eq techniques are discussed.
Acknowledgments
We thank the members of our groups for helpful discussions. The research was supported by the NIH (GM056740 to M.E.H., GM118011 to E.J.).
Appendix: Experimental protocol for determining the specificity of the C5 protein
The RNA substrates contain the tRNAMet82 body, 8 nucleotides nucleotides of the genomically encoded leader and 21 nucleotides at the 5′ end for the Illumina sequencing (10). RNA substrates were generated by in vitro transcription from DNA generated by PCR amplification of the ptRNAMet82 gene (PMET82) (10). In vitro transcription (400 μL) was performed with 20–15 μg of DNA template, 400 units T7 RNA polymerase (Ambion), 0.01 unit yeast pyrophosphatase, 0.5 mM rNTP, and the reaction buffer supplied by the polymerase manufacturer, supplemented with 2.5 mM MgCl2. Reactions were incubated overnight at 37°C. Full length RNA was purified on 8% denaturing PAGE, as described (29, 30). Recovered ptRNAs were dephosphorylated using calf intestinal phosphatase and 5′ labeled with γ32P-ATP and T4 polynucleotide kinase according to standard methods. For the HiTS-Kin experiments, the RNA was uniformly labeled with γ 32P-GTP in the in vitro transcription (rNTP 100 μM).
Processing reactions were performed in a buffer containing 50 mM Tris-HCl pH 8.0, 100 mM NaCl, 17.5 mM MgCl2, 0.005% Triton x-100, with 1 μM ptRNA and 5 nM E. coli RNAse P holoenzyme. Equal volumes of enzyme and radiolabeled substrate at twice their final concentrations were prepared in reaction buffer and combined to initiate the reaction (40 μL). Aliquots (5 μL) were removed, and reactions were quenched by addition of 5 μL formamide and 100 mM EDTA. ptRNA and reaction products were resolved on 10% denaturing PAGE. The fraction product was determined with a PhosphorImager (GE) and the ImageQuant software. Precursor bands in the gel were located by exposure to X-ray film, bands were excised, eluted as described (29). Eluted RNA was extracted with phenol and chloroform, and recovered by ethanol precipitation.
To generate cDNA libraries, recovered RNA was re-suspended in 25 μL H2O. The RNA concentration was determined with a Beckman UV spectrophotometer. First strand synthesis was performed with 4 pmoles of this RNA in a 20 μL standard reaction mix with 1 μM primer and 0.5 μL Superscript III (Invitrogen) for 10 min at 42°C, 40 min at 50°C and 20 min at 55°C. The reaction was stopped by incubation at 95°C for 5 min. The generated cDNA was diluted (1:300). One μL of this solution was used in PCR reactions with 1.25 U Herculase polymerase (Stratagene), primer (0.5 μM) and indexed forward primer (0.5 μM) for 2 min at 98°C. subsequent PCR cycles were as follows: 15 s at 98°C, 20 s at 59°C, 20 s at 72°C, and incubation for 10 min at 72°C. PCR products were purified with P6 microcentrifuge columns (BIO-RAD) and analyzed by agarose gel electrophoresis. Solutions were pooled in an equimolar fashion and sequenced in a single lane of an Illumina GA2, according to the manufacturer’s protocols.
Primer sequences were as follows:
RT primer: 5′CAAGCAGAAGACGGCATACGATGGTGGCTACGACGGGAT
Indexed forward primers (NN: degenerated barcode; bold letters: index barcode):
5′AATGATACGGCGACCACCGAGATCTACACTCTTTCCCTACACGACGCTCTTCCGATCTNNATCGGGAGACCGGAATTCAGATTG
5′AATGATACGGCGACCACCGAGATCTACACTCTTTCCCTACACGACGCTCTTCCGATCTNNGATGGGAGACCGGAATTCAGATTG
5′AATGATACGGCGACCACCGAGATCTACACTCTTTCCCTACACGACGCTCTTCCGATCTNNCGAGGGAGACCGGAATTCAGATTG
5′AATGATACGGCGACCACCGAGATCTACACTCTTTCCCTACACGACGCTCTTCCGATCTNNTCCGGGAGACCGGAATTCAGATTG
All reads were aligned permitting one mismatch but no gaps, using BLAST. Aligned reads were then sorted according to their Index-tag, and separated into different files.
Footnotes
Publisher's Disclaimer: This is a PDF file of an unedited manuscript that has been accepted for publication. As a service to our customers we are providing this early version of the manuscript. The manuscript will undergo copyediting, typesetting, and review of the resulting proof before it is published in its final citable form. Please note that during the production process errors may be discovered which could affect the content, and all legal disclaimers that apply to the journal pertain.
References
- 1.Gerstberger S, Hafner M, Tuschl T. A census of human RNA-binding proteins. Nature Rev Gen. 2014;15:829–845. doi: 10.1038/nrg3813. [DOI] [PMC free article] [PubMed] [Google Scholar]
- 2.Jankowsky E, Harris ME. Specificity and nonspecificity in RNA-protein interactions. Nat Rev Mol Cell Biol. 2015;16:533–544. doi: 10.1038/nrm4032. [DOI] [PMC free article] [PubMed] [Google Scholar]
- 3.Licatalosi DD, Darnell RB. RNA processing and its regulation: global insights into biological networks. Nature Rev Gen. 2010;11:75–87. doi: 10.1038/nrg2673. [DOI] [PMC free article] [PubMed] [Google Scholar]
- 4.Helder S, Blythe AJ, Bond CS, Mackay JP. Determinants of affinity and specificity in RNA-binding proteins. Curr Opin Struct Biol. 2016;38:83–91. doi: 10.1016/j.sbi.2016.05.005. [DOI] [PubMed] [Google Scholar]
- 5.Buenrostro JD, Araya CL, Chircus LM, Layton CJ, Chang HY, Snyder MP, Greenleaf WJ. Quantitative analysis of RNA-protein interactions on a massively parallel array reveals biophysical and evolutionary landscapes. Nature Biotechnol. 2014;32:562–568. doi: 10.1038/nbt.2880. [DOI] [PMC free article] [PubMed] [Google Scholar]
- 6.Campbell ZT, Bhimsaria D, Valley CT, Rodriguez-Martinez JA, Menichelli E, Williamson JR, Ansari AZ, Wickens M. Cooperativity in RNA-Protein Interactions: Global Analysis of RNA Binding Specificity. Cell Rep. 2012;1:570–581. doi: 10.1016/j.celrep.2012.04.003. [DOI] [PMC free article] [PubMed] [Google Scholar]
- 7.Lambert N, Robertson A, Jangi M, McGeary S, Sharp PA, Burge CB. RNA Bind-n-Seq: quantitative assessment of the sequence and structural binding specificity of RNA binding proteins. Mol Cell. 2014;54:887–900. doi: 10.1016/j.molcel.2014.04.016. [DOI] [PMC free article] [PubMed] [Google Scholar]
- 8.Ray D, Kazan H, Chan ET, Peña-Castillo L, Chaudhry S, Talukder S, Blencowe BJ, Morris Q, Hughes TR. Rapid and systematic analysis of the RNA recognition specificities of RNA-binding proteins. Nat Biotechnol. 2009;27:667–670. doi: 10.1038/nbt.1550. [DOI] [PubMed] [Google Scholar]
- 9.Tome JM, Ozer A, Pagano JM, Gheba D, Schroth GP, Lis JT. Comprehensive analysis of RNA-protein interactions by high-thoughput sequencing-RNA affinity profiling. Nature Methods. 2014;11:683–688. doi: 10.1038/nmeth.2970. [DOI] [PMC free article] [PubMed] [Google Scholar]
- 10.Guenther UP, Yandek LE, Niland CN, Campbell FE, Anderson D, Anderson VE, Harris ME, Jankowsky E. Hidden specificity in an apparently nonspecific RNA-binding protein. Nature. 2013;502:385–388. doi: 10.1038/nature12543. [DOI] [PMC free article] [PubMed] [Google Scholar]
- 11.Lin HC, Zhao J, Niland CN, Tran B, Jankowsky E, Harris ME. Analysis of the RNA Binding Specificity Landscape of C5 Protein Reveals Structure and Sequence Preferences that Direct RNase P Specificity. Cell Chem Biol. 2016;23:1271–1281. doi: 10.1016/j.chembiol.2016.09.002. [DOI] [PMC free article] [PubMed] [Google Scholar]
- 12.Kurz JC, Fierke CA. Ribonuclease P: a ribonucleoprotein enzyme. Curr Opin Chem Biol. 2000;4:553–558. doi: 10.1016/s1367-5931(00)00131-9. [DOI] [PubMed] [Google Scholar]
- 13.Rueda D, Hsieh J, Day-Storms JJ, Fierke CA, Walter NG. The 5′ leader of precursor tRNAAsp bound to the Bacillus subtilis RNase P holoenzyme has an extended conformation. Biochemistry. 2005;44:16130–16139. doi: 10.1021/bi0519093. [DOI] [PubMed] [Google Scholar]
- 14.Zheng S, Robertson TA, Varani G. A knowledge-based potential function predicts the specificity and relative binding energy of RNA-binding proteins. FEBS J. 2007;274:6378–6391. doi: 10.1111/j.1742-4658.2007.06155.x. [DOI] [PubMed] [Google Scholar]
- 15.Liu LA, Bradley P. Atomistic modeling of protein-DNA interaction specificity: progress and applications. Curr Opin Struct Biol. 2012;22:397–405. doi: 10.1016/j.sbi.2012.06.002. [DOI] [PMC free article] [PubMed] [Google Scholar]
- 16.Niland CN, Zhao J, Lin HC, Anderson DR, Jankowsky E, Harris ME. Determination of the Specificity Landscape for Ribonuclease P Processing of Precursor tRNA 5′ Leader Sequences. ACS Chem Biol. 2016;11:2285–2292. doi: 10.1021/acschembio.6b00275. [DOI] [PubMed] [Google Scholar]
- 17.Lin HC, Yandek LE, Gjermeni I, Harris ME. Determination of relative rate constants for in vitro RNA processing reactions by internal competition. Anal Biochem. 2014;467:54–61. doi: 10.1016/j.ab.2014.08.022. [DOI] [PMC free article] [PubMed] [Google Scholar]
- 18.Niland CN, Jankowsky E, Harris ME. Optimization of high-throughput sequencing kinetics for determining enzymatic rate constants of thousands of RNA substrates. Anal Biochem. 2016;510:1–10. doi: 10.1016/j.ab.2016.06.004. [DOI] [PMC free article] [PubMed] [Google Scholar]
- 19.Zhuang F, Fuchs RT, Sun Z, Zheng Y, Robb GB. Structural bias in T4 RNA ligase-mediated 3′-adapter ligation. Nucleic Acids Res. 2012;40:e54. doi: 10.1093/nar/gkr1263. [DOI] [PMC free article] [PubMed] [Google Scholar]
- 20.Faridani OR, Abdullayev I, Hagemann-Jensen M, Schell JP, Lanner F, Sandberg R. Single-cell sequencing of the small-RNA transcriptome. Nat Biotechnol. 2016 doi: 10.1038/nbt.3701. [DOI] [PubMed] [Google Scholar]
- 21.König J, Zarnack K, Rot G, Curk T, Kayikci M, Zupan B, Turner DJ, Luscombe NM, Ule J. iCLIP reveals the function of hnRNP particles in splicing at individual nucleotide resolution. Nat Struct Mol Biol. 2010;17:909–915. doi: 10.1038/nsmb.1838. [DOI] [PMC free article] [PubMed] [Google Scholar]
- 22.Schellenberger V, Siegel RA, Rutter WJ. Analysis of enzyme specificity by multiple substrate kinetics. Biochemistry. 1993;32:4344–4348. doi: 10.1021/bi00067a025. [DOI] [PubMed] [Google Scholar]
- 23.Stormo G, Zhao Y. Determining the specificity of protein - DNA interactions. Nat Rev Genetics. 2010;11:751–760. doi: 10.1038/nrg2845. [DOI] [PubMed] [Google Scholar]
- 24.Stormo GD. Modeling the specificity of protein-DNA interactions. Quant Biol. 2013;1:115–130. doi: 10.1007/s40484-013-0012-4. [DOI] [PMC free article] [PubMed] [Google Scholar]
- 25.Ben-Gal I, Shani A, Gohr A, Grau J, Arviv S, Shmilovici A, Posch S, Grosse I. Identification of transcription factor binding sites with variable-order Bayesian networks. Bioinformatics. 2005;21:2657–2666. doi: 10.1093/bioinformatics/bti410. [DOI] [PubMed] [Google Scholar]
- 26.Grau J, Posch S, Grosse I, Keilwagen J. A general approach for discriminative de novo motif discovery from high-throughput data. Nucleic Acids Res. 2013;41:e197. doi: 10.1093/nar/gkt831. [DOI] [PMC free article] [PubMed] [Google Scholar]
- 27.Hooghe B, Broos S, van Roy F, De Bleser P. A flexible integrative approach based on random forest improves prediction of transcription factor binding sites. Nucleic Acids Res. 2012;40:e106. doi: 10.1093/nar/gks283. [DOI] [PMC free article] [PubMed] [Google Scholar]
- 28.Zhou Q, Liu JS. Extracting sequence features to predict protein-DNA interactions: a comparative study. Nucleic Acids Res. 2008;36:4137–4148. doi: 10.1093/nar/gkn361. [DOI] [PMC free article] [PubMed] [Google Scholar]
- 29.Christian EL, McPheeters DS, Harris ME. Identification of individual nucleotides in the bacterial ribonuclease P ribozyme adjacent to the pre-tRNA cleavage site by short-range photo-cross-linking. Biochemistry. 1998;37:17618–17628. doi: 10.1021/bi982050a. [DOI] [PubMed] [Google Scholar]
- 30.Guo X, Campbell FE, Sun L, Christian EL, Anderson VE, Harris ME. RNA-dependent folding and stabilization of C5 protein during assembly of the E. coli RNase P holoenzyme. J Mol Biol. 2006;360:190–203. doi: 10.1016/j.jmb.2006.05.001. [DOI] [PubMed] [Google Scholar]
- 31.Reiter NJ, Osterman A, Torres-Larios A, Swinger KK, Pan T, Mondragon A. Structure of a bacterial ribonuclease P holoenzyme in complex with tRNA. Nature. 2010;468:784–789. doi: 10.1038/nature09516. [DOI] [PMC free article] [PubMed] [Google Scholar]