Abstract
Purpose
The aim of this study was to determine whether gadoxetate-enhanced magnetic resonance imaging (MRI) improves lesion characterization in patients at risk for hepatocellular carcinoma compared with computed tomography (CT).
Materials and Methods
Forty-nine patients with indeterminate lesions found at contrast-enhanced CT were prospectively enrolled and imaged using gadoxetate-enhanced hepatobiliary phase (HBP) MRI within 30 days of their initial CT. Three readers graded each lesion at CT and MRI using the Liver Imaging Reporting and Data System (LI-RADS) v2014 major criteria and HBP characterization as an ancillary feature. Patients were followed for an average of 1.8 years to document growth or stability of each lesion.
Results
The Liver Imaging Reporting and Data System categorization changed for 71% (52/73) of lesions based on HBP MRI compared with CT, with 30% (22/73) of lesions upgraded and 41% (30/73) of lesions downgraded. There was almost perfect agreement between readers for arterial phase hyperintensity and HBP hypointensity, with lower interreader agreement for washout and capsule appearance. On the basis of composite clinical follow-up, lesions that were subsequently classified as hepatocellular carcinoma were assigned a higher LI-RADS category on HBP MRI when compared with CT.
Conclusions
For patients with indeterminate lesions seen on contrast-enhanced CT, HBPMRI using gadoxetate improves lesion characterization when using LI-RADS v2014 criteria.
Keywords: hepatocellular carcinoma, MRI, hepatobiliary phase
Hepatobiliary agents (HBAs) are gadolinium-based magnetic resonance (MR) contrast agents that are partially taken up by hepatocytes and then excreted through the biliary system and allow for hepatobiliary phase (HBP) imaging, during which time hepatic parenchyma enhances relative to other tissues including the blood vessels. During the HBP, lesions that do not demonstrate normal hepatocyte function are hypointense relative to normal background liver parenchyma. This property increases the detection of certain focal liver lesions such as metastatic disease.1,2 In the last few years, numerous publications on hepatocellular carcinoma (HCC) showed that HBAs, most commonly gadoxetate disodium (Eovist, Bayer Healthcare), have an increased sensitivity for the detection of HCC compared with MR examinations performed with extracellular contrast agents.3–7
The Liver Imaging Reporting and Data System (LI-RADS) was developed to standardize the reporting of HCC to reduce intraobserver variability and interpretation errors.8 The initial version of LI-RADS did not incorporate HBAs into the diagnostic algorithm, and in 2014, HBAs were included in the LI-RADS algorithm with 2 minor criteria suggesting HCC: HBP hypointensity and the HBP hypointense rim.9 There has been no validation of the new LI-RADS HBA criteria for the detection of HCC, and these criteria were based on expert consensus opinion.
Therefore, the purpose of this study is to evaluate the LI-RADS v2014 criteria for the characterization of liver lesions. We used a prospective design where patients with indeterminate lesions seen on contrast-enhanced computed tomography (CT), which served as the extracellular control, subsequently underwent a gadoxetate-enhanced MR imaging (MRI) with HBP imaging.
MATERIALS AND METHODS
This project was approved by the local institution review board, and all patients provided informed consent. Forty-nine patients at risk for HCC were prospectively enrolled (all men; mean age, 60.0 years; SD, 7.3 years). The most common reason for liver disease was hepatitis C virus in 38 patients, followed by alcoholic liver disease in 10 patients. Of the total 49 patients, 39 had imaging evidence of cirrhosis. Inclusion criteria were patients who underwent liver protocol CT at risk for HCC and were found with indeterminate lesions as determined by the attending radiologist at the time of the CT scan interpretation. After the CT was completed, patients were enrolled, and MR imaging was performed within 30 days of completion of the CT.
Contrast-Enhanced CT
All patients underwent a 3-phase liver protocol CT of the abdomen, which included noncontrast, arterial, and portal venous phase acquisitions performed on a 64-slice CT scanner (Lightspeed VCT; GE Healthcare, Waukesha, Wis). A 30-mL timing bolus was used to determine the optimal timing for the arterial and portal venous phases. Then, 120 mL of iohexol 350 mgI/mL (Omnipaque 350; GE Healthcare, Princeton, NJ) was administered intravenously at 4 mL/s. The noncontrast acquisition was performed with a slice thickness of 5 mm and a pitch of 1.375:1. Arterial and portal venous phase acquisitions were performed with 2.5-mm slices.
Gadoxetate-Enhanced MRI
Liver MRI was performed using 10 mL of gadoxetate disodium (Eovist; Bayer Healthcare, Wayne, NJ) on a 1.5-T scanner (Magnetom Avanto; Siemens Healthcare, Erlangen, Germany). Before the administration of contrast, the following sequences were obtained: dual-echo gradient echo, coronal T2 single-shot turbo spin echo without fat saturation, axial respiratory-gated turbo spin echo with fat saturation, and precontrast T1-weighted 3-dimensional spoiled gradient echo with fat saturation. Arterial phase timing was performed using Care Bolus, and arterial and portal venous phase and delayed images at 5, 10, and 20 minutes were acquired using identical scan parameters: slice thickness, 3 mm; bandwidth, 488; matrix size, 256/166; flip angle, 12°; echo time/repetition time, 1.65/3.81. Between the 10- and 20-minute delay, axial diffusion weighted imaging was acquired using b = 50 and 800.
Lesion Analysis
Lesions were marked and numbered for review before grading. Subsequently, 3 experienced readers (T.A.H., R.A. and S.W. with 3, 12 and 7 years of experience in reading abdominal MRIs) graded all focal lesions on both CT and MRI using LI-RADS v2014 major criteria (arterial phase enhancement, washout appearance, and capsule appearance). Readers characterized lesions on the HBP as being hyperintense, hypointense, or isointense relative to the surrounding liver parenchyma; in addition, the presence of an HBP hypointense capsule was noted if present. Lesions were also measured in greatest dimension by all 3 readers. Finally, a consensus read was performed to determine the final LI-RADS score for each lesion at CT and MRI. Hepatobiliary phase features were used as ancillary features and increased or decreased LI-RADS categorization, although they could not be used to increase LI-RADS categorization to LI-RADS 5 as described in LI-RASD v2014.
Follow-up
At the completion of the study, each patient was evaluated by consensus to determine the final diagnosis of each lesion characterized by MRI and CT. All lesions were followed up for a minimum of 6 months. Lesions that were stable or resolved at the follow-up imaging were considered benign along with lesions demonstrating typical benign characteristics such as vascular shunts, hemangiomas, focal nodular hyperplasia, and fibrosis. Lesions that increased in size at follow-up (based on LI-RADS threshold growth criteria), demonstrated hypervascularity at transarterial chemoembolization, or revealed HCC at biopsy or partial hepatectomy were considered malignant. On the basis of follow-up, lesions were classified as malignant or benign.
Statistical Analysis
Interreader variability was performed using the Cohen κ. A Fisher exact test was used to compare the incidence of arterial phase hypointensity, washout appearance, capsule appearance, and HBP hypointensity. A Fisher exact test was also used to determine whether there was a statistical difference between LI-RADS categorizations using MRI and CT. A P value less than 0.05 was considered significant. All analyses were performed using R.
RESULTS
Seventy-three lesions were visualized, with a mean size of 1.6 ± 1.0 cm; 16 lesions measured less than 1.0 cm, 27 lesions measured between 1 and 2 cm, and 13 lesions measured greater than 2.0 cm. The mean length of follow-up between the MRI and the last imaging study or pathology was 1.8 ± 1.2 years (range, 0.5–4.4 years), with a minimum follow-up of 6 months.
LI-RADS Categorization
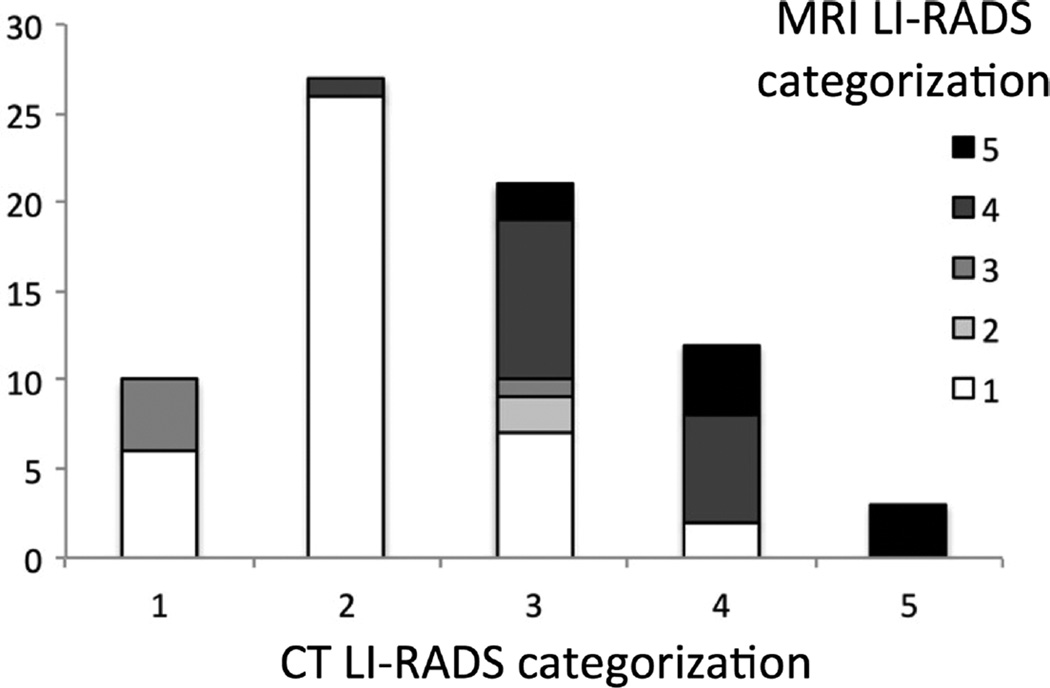
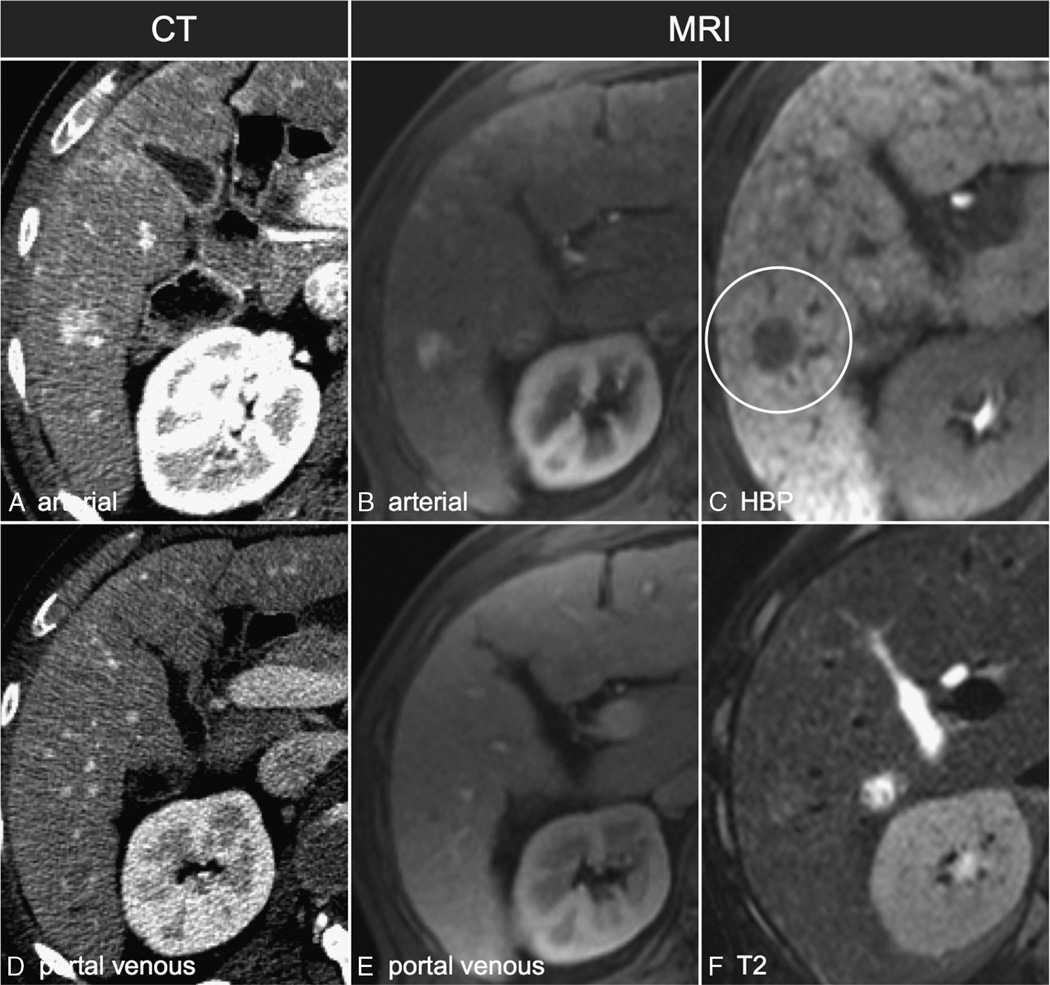
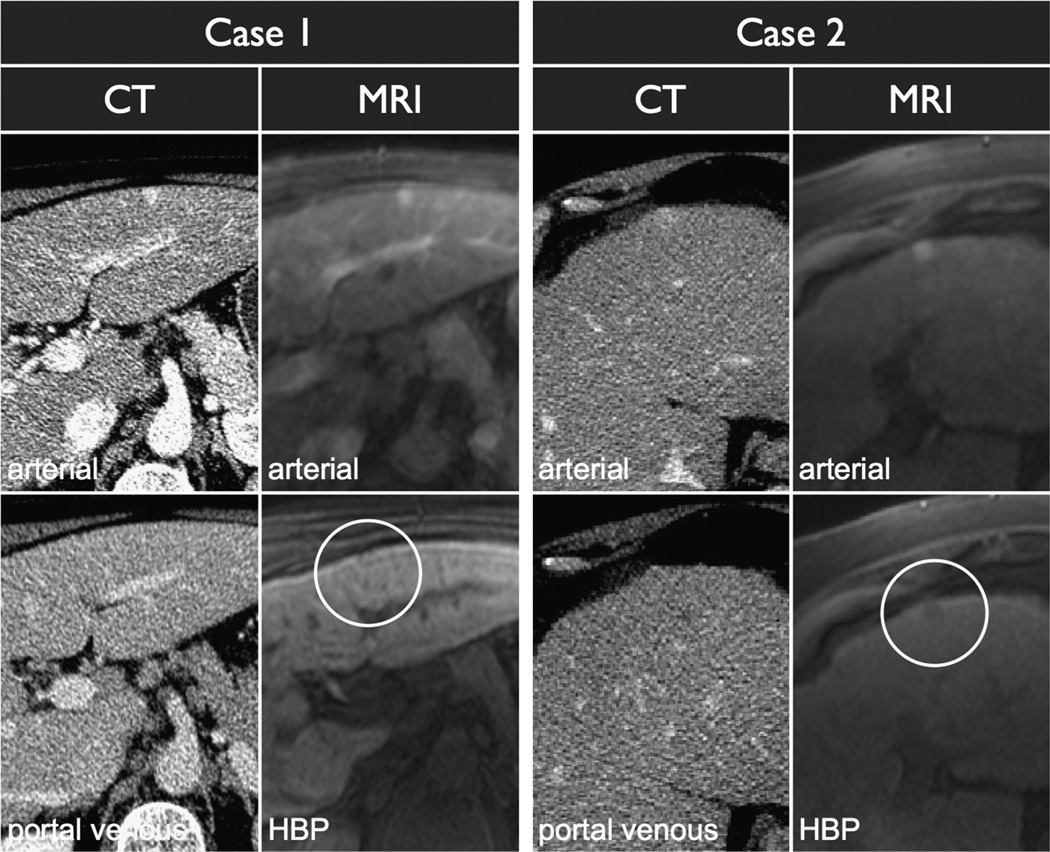
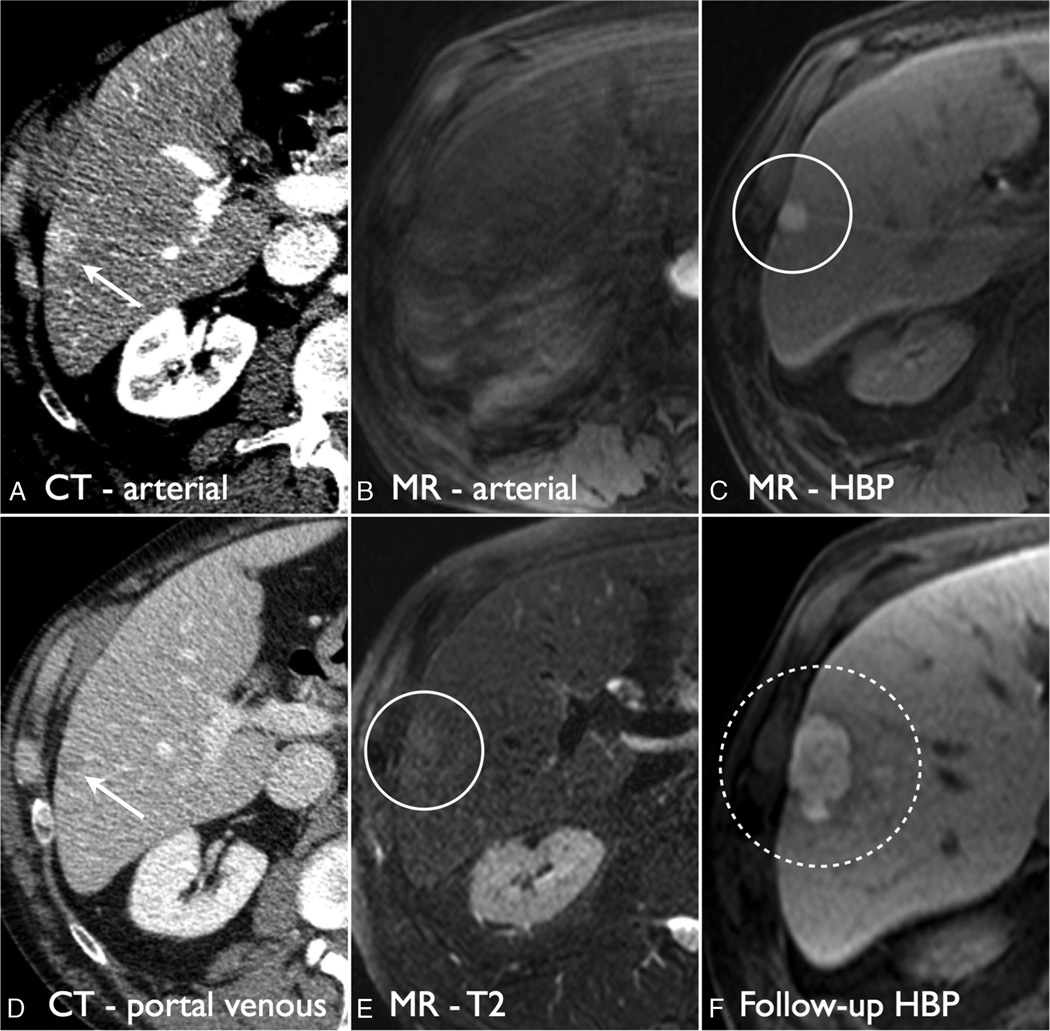
Seventy-one percent (52/73) of the lesions changed LI-RADS categorization on MRI compared with CT, with 30% (22/73) of lesions being upgraded to a higher LI-RADS categorization and 41% (30/73) of lesions being downgraded to a lower LI-RADS categorization (Fig. 1). The most common change in categorization was from LI-RADS 2 on CT to LI-RADS 1 on MRI, encompassing 22 lesions in total. Seven lesions were upgraded from LI-RADS 1 or 2 on CT to LI-RADS 3 and 4 on HBPMRI, whereas 10 lesions were upgraded from LI-RADS 3 to LI-RADS 4 or 5 (Figs. 2, 3). Of note, there were 2 HBP hyperintense lesions that were characterized as LI-RADS 4 because of the presence of a hypointense capsule on the HBP (Fig. 4).
FIGURE 1.
Liver Imaging Reporting and Data System categorization based on CT and MRI characteristics. The most common change in categorization was from LI-RADS 2 on CT to LI-RADS 1 on MRI. Five lesions were originally classified as definitely benign (LR-1) or probably benign (LR-2) and were reclassified as intermediate (LR-3) or likely malignant (LR-4).
FIGURE 2.
A 1.6-cm arterially enhancing lesion that does not demonstrate washout appearance on CT and was characterized as LI-RADS 3 (A and D). On MRI (B, C, E, and F), the lesion did not demonstrate washout on the portal venous phase (E) but did demonstrate HBP hypointensity (C) and was characterized as LI-RADS 4.
FIGURE 3.
Two peripheral arterially enhancing lesions, one that demonstrates HBP hypointensity and one that does not. Case 1 demonstrated stability on follow-up imaging consistent with a vascular shunt. Case 2 was treated with transarterial chemoembolization and recurred after therapy consistent with HCC.
FIGURE 4.
Hyperintense HCC on HBP. On CT, the lesion was seen as a 1.7-cm arterial phase hyperintense lesion with washout appearance and characterized as LI-RADS 4 (A and D, white arrows). On HBP MRI, the arterial phase was corrupted by motion (B), but the lesion demonstrated T2 hyperintensity (E, white circle) and was HBP hyperintense with a hypointense capsule (C, white circle). The lesion was characterized as LI-RADS 4. On follow-up imaging, the lesion grew consistent with HCC (F).
Imaging Features and Interreader Variability
Arterial phase hyperintensity was seen more frequently on CT compared with MRI (90% vs 63%, P < 0.001). There was no significant difference in the presence of capsule or washout appearance between CT and MRI (washout, 16% vs 22%, P = 0.53; capsule, 3% vs 12%, P = 0.056). In terms of interreader variability, arterial phase hyperintensity and HBP hypointensity both demonstrated almost perfect agreement, whereas washout and capsule appearances demonstrated moderate agreement (Table 1).
TABLE 1.
Relative Rates of LI-RADS Major Criteria and HBP Hypointensity in the Lesions on CT and MRI
| CT | MRI | |||
|---|---|---|---|---|
| % | κ | % | κ | |
| Arterial phase enhancement | 90* | 0.64 | 63* | 0.86 |
| Reader 1 | 85 | 61 | ||
| Reader 2 | 90 | 61 | ||
| Reader 3 | 86 | 60 | ||
| Washout appearance | 16 | 0.39 | 22 | 0.54 |
| Reader 1 | 18 | 22 | ||
| Reader 2 | 23 | 23 | ||
| Reader 3 | 14 | 19 | ||
| Capsule appearance | 3 | −0.02 | 12 | 0.58 |
| Reader 1 | 5 | 12 | ||
| Reader 2 | 1 | 14 | ||
| Reader 3 | 0 | 11 | ||
| HBP hypointensity | 44 | 0.83 | ||
| Reader 1 | 44 | |||
| Reader 2 | 47 | |||
| Reader 3 | 42 | |||
Interreader variabilities are reported as a Cohen κ between the 3 readers. Arterial phase hyperintensity was demonstrated on CT more frequently than on MRI.
P < 0.001
Follow-up
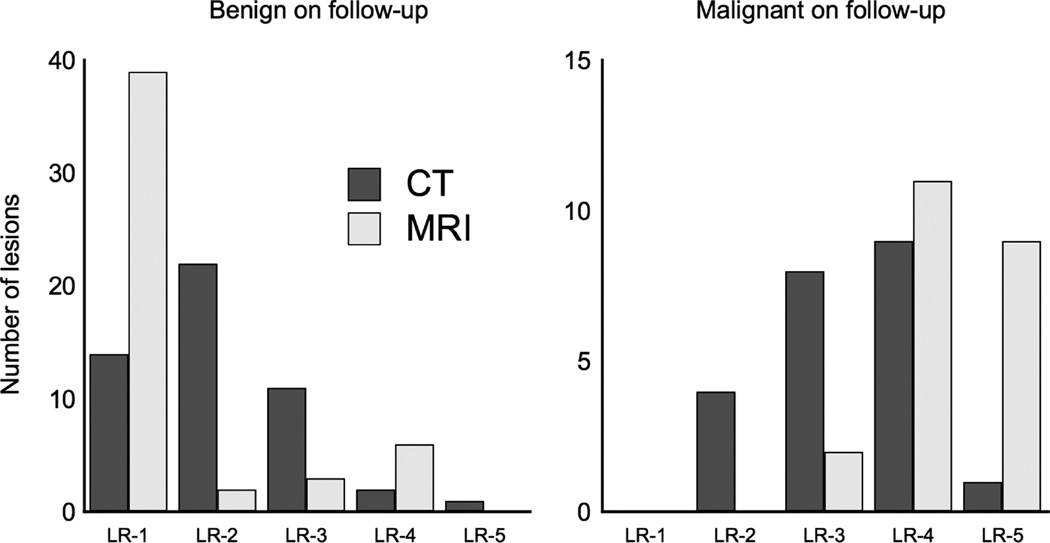
The most common final diagnosis was vascular shunt (33 lesions), followed by HCC (22 lesions), hemangioma (8 lesions), and other benign lesions including focal fat and focal nodular hyperplasia (9 lesions). Of the lesions determined to be HCC on follow-up, 15 of the 22 lesions were upgraded, whereas 7 remained unchanged (Fig. 5). Of the lesions determined to be benign on follow-up, 30 lesions were downgraded, whereas 14 remained unchanged, and 7 lesions were upgraded. Magnetic resonance imaging demonstrated a significantly lower LI-RADS categorization compared with CT for lesions found to be benign on follow-up (P = 0.002) and a significantly higher LI-RADS categorization for lesions found to be HCC (P < 0.001).
FIGURE 5.
Distribution of the change in LI-RADS categorization of lesions broken down by characterization on follow-up. Magnetic resonance imaging demonstrates more lesions as being LI-RADS 1 on follow-up that subsequently were benign (left chart), whereas MRI also had more LI-RADS 5 lesions that were shown to be HCC on follow-up (right chart).
DISCUSSION
We found that, for indeterminate lesions seen on CT, immediate work-up with HBP MRI helps to further characterize these observations and results in LI-RADS categorization that is more accurate compared with those derived from contrast-enhanced CT alone.
Part of the reason for this increase in accuracy is due to differences in modality that are not related to HBP imaging. Recent comparisons between CT and extracellular MRI have demonstrated similar improvements in accuracy due to ancillary features such as marked T2 hyperintensity, marked T2 hypointensity, and intralesional fat.10 Nonetheless, certain HBP features provided unique information, such as HBP hypointensity, which resulted in an increase in LI-RADS 1 lesions in our cohort. The increase in proportion of LI-RADS 5 lesions in the HBP MRI cohort was due to an increase in the incidence of washout and capsule appearances and not related to HBP features, which has also been reported with extracellular agents.11
Of note, there was a significant decrease in the number of visualized lesions that were arterial phase hyperintense using gadoxetate disodium. This is likely due to 2 issues. First is the presence of transient dyspnea, which can limit arterial phase image quality.12–14 The second is poor bolus timing due to both the lack of a timing bolus and the smaller bolus size. Since the initiation of this trial, multiple novel approaches have been proposed to improve arterial phase capture and minimize motion artifacts from transient dyspnea.15,16
In addition, since the initiation of this trial, HBP MRI technique has changed; most importantly, the flip angle used for acquisition is suggested to be higher than that used in our study. At 1.5 T, the recommended flip angle is now 25° rather than the 12° used in this study.17 The lower flip angle used in this study may have resulted in the lower detection of HBP hypointense lesions. Another improvement has been the introduction of navigated high-resolution HBP imaging that can additionally improve lesion detection.18
There are other limitations of our study. First is the absence of pathologic correlation for the imaged lesions. At our institution, percutaneous biopsy is rarely performed to diagnose focal hepatic lesions, and therefore, pathology correlation is not possible for all lesions. Second, we did not perform delayed phase CT in patients during the time span of this study. Delayed phase CT between 3 and 5 minutes has demonstrated increased sensitivity for washout appearance compared with the portal venous phase and would have allowed for better characterization of hemangiomas.19–21 Third, we did not compare extracellular MRI with HBA MRI. Because MRI has shown a higher sensitivity for the detection of HCC, it is likely that extracellular contrast may have outperformed CT because of the available of T2-weighted imaging for imaging hemangiomas and dual-echo gradient echo for the detection of lesional fat.7
In conclusion, we have demonstrated that, in patients with indeterminate lesions seen on contrast-enhanced CT, HBP MRI using gadoxetate improves lesion characterization when using LI-RADS criteria.
Acknowledgments
Supported in part by a grant from Bayer Healthcare. BMY, CUC and AM are members of the UCSF Liver Center, supported by P30 DK026743.
Footnotes
The authors declare no conflict of interest.
REFERENCES
- 1.Jeong HT, Kim MJ, Park MS, et al. Detection of liver metastases using gadoxetic-enhanced dynamic and 10- and 20-minute delayed phase MR imaging. J Magn Reson Imaging. 2012;35:635–643. doi: 10.1002/jmri.22880. [DOI] [PubMed] [Google Scholar]
- 2.Seo HJ, Kim MJ, Lee JD, et al. Gadoxetate disodium-enhanced magnetic resonance imaging versus contrast-enhanced 18 F-fluorodeoxyglucose positron emission tomography/computed tomography for the detection of colorectal liver metastases. Invest Radiol. 2011;46:548–555. doi: 10.1097/RLI.0b013e31821a2163. [DOI] [PubMed] [Google Scholar]
- 3.Nakamura Y, Tashiro H, Nambu J, et al. Detectability of hepatocellular carcinoma by gadoxetate disodium-enhanced hepatic MRI: tumor-by-tumor analysis in explant livers. J Magn Reson Imaging. 2012;37:684–691. doi: 10.1002/jmri.23855. [DOI] [PubMed] [Google Scholar]
- 4.Park MJ, Kim YK, Lee MW, et al. Small hepatocellular carcinomas: improved sensitivity by combining gadoxetic acid-enhanced and diffusion-weighted MR imaging patterns. Radiology. 2012;264:761–770. doi: 10.1148/radiol.12112517. [DOI] [PubMed] [Google Scholar]
- 5.Kim Y, Kim C, Han Y, et al. Detection of small hepatocellular carcinoma: intraindividual comparison of gadoxetic acid-enhanced MRI at 3.0 and 1.5 T. Invest Radiol. 2011;46:383–389. doi: 10.1097/RLI.0b013e318217b8fb. [DOI] [PubMed] [Google Scholar]
- 6.Tsurusaki M, Sofue K, Isoda H, et al. Comparison of gadoxetic acid-enhanced magnetic resonance imaging and contrast-enhanced computed tomography with histopathological examinations for the identification of hepatocellular carcinoma: a multicenter phase III study. J Gastroenterol. 2016;51:71–79. doi: 10.1007/s00535-015-1097-5. [DOI] [PubMed] [Google Scholar]
- 7.Chou R, Cuevas C, Fu R, et al. Imaging techniques for the diagnosis of hepatocellular carcinoma: a systematic review and meta-analysis. Ann Intern Med. 2015;162:697–711. doi: 10.7326/M14-2509. [DOI] [PubMed] [Google Scholar]
- 8.American College of Radiology. Liver Imaging Reporting and Data System (LI-RADS) [Internet] 2014 Available at: http://www.acr.org/Quality-Safety/Resources/LIRADS. [Google Scholar]
- 9.Hope TA, Fowler KJ, Sirlin CB, et al. Hepatobiliary agents and their role in LI-RADS. Abdom Imaging. 2015;40:613–625. doi: 10.1007/s00261-014-0227-5. [DOI] [PubMed] [Google Scholar]
- 10.Corwin MT, Fananapazir G, Jin M, et al. Differences in liver imaging and reporting data system categorization between MRI and CT. AJR Am J Roentgenol. 2016;206:307–312. doi: 10.2214/AJR.15.14788. [DOI] [PubMed] [Google Scholar]
- 11.Ehman EC, Behr SC, Umetsu SE, et al. Rate of observation and inter-observer agreement for LI-RADS major features at CT and MRI in 184 pathology proven hepatocellular carcinomas. Abdom Radiol (NY) 2016;41:963–969. doi: 10.1007/s00261-015-0623-5. [DOI] [PMC free article] [PubMed] [Google Scholar]
- 12.Davenport MS, Viglianti BL, Al-Hawary MM, et al. Comparison of acute transient dyspnea after intravenous administration of gadoxetate disodium and gadobenate dimeglumine: effect on arterial phase image quality. Radiology. 2013;266:452–461. doi: 10.1148/radiol.12120826. [DOI] [PubMed] [Google Scholar]
- 13.Davenport MS, Caoili EM, Kaza RK, et al. Matched within-patient cohort study of transient arterial phase respiratory motion-related artifact in MR imaging of the liver: gadoxetate disodium versus gadobenate dimeglumine. Radiology. 2014;272:123–131. doi: 10.1148/radiol.14132269. [DOI] [PubMed] [Google Scholar]
- 14.Bashir MR, Castelli P, Davenport MS, et al. Respiratory motion artifact affecting hepatic arterial phase MR imaging with gadoxetate disodium is more common in patients with a prior episode of arterial phase motion associated with gadoxetate disodium. Radiology. 2015;274:141–148. doi: 10.1148/radiol.14140386. [DOI] [PubMed] [Google Scholar]
- 15.Hope TA, Saranathan M, Petkovska I, et al. Improvement of gadoxetate arterial phase capture with a high spatio-temporal resolution multiphase three-dimensional SPGR-Dixon sequence. J Magn Reson Imaging. 2013;38:938–945. doi: 10.1002/jmri.24048. [DOI] [PubMed] [Google Scholar]
- 16.Pietryga JA, Burke LM, Marin D, et al. Respiratory motion artifact affecting hepatic arterial phase imaging with gadoxetate disodium: examination recovery with a multiple arterial phase acquisition. Radiology. 2014;271:426–434. doi: 10.1148/radiol.13131988. [DOI] [PubMed] [Google Scholar]
- 17.Kim S, Mussi TC, Lee LJ, et al. Effect of flip angle for optimization of image quality of gadoxetate disodium-enhanced biliary imaging at 1.5 T. Am J Roentgenol. 2013;200:90–96. doi: 10.2214/ajr.12.8722. [DOI] [PubMed] [Google Scholar]
- 18.Nagle SK, Busse RF, Brau AC, et al. High resolution navigated three-dimensional T1-weighted hepatobiliary MRI using gadoxetic acid optimized for 1.5 Tesla. J Magn Reson Imaging. 2012;36:890–899. doi: 10.1002/jmri.23713. [DOI] [PMC free article] [PubMed] [Google Scholar]
- 19.Iannaccone R, Laghi A, Catalano C, et al. Hepatocellular carcinoma: role of unenhanced and delayed phase multi–detector row helical CT in patients with cirrhosis. Radiology. 2005;234:460–467. doi: 10.1148/radiol.2342031202. [DOI] [PubMed] [Google Scholar]
- 20.Monzawa S, Ichikawa T, Nakajima H, et al. Dynamic CT for detecting small hepatocellular carcinoma: usefulness of delayed phase imaging. AJR Am J Roentgenol. 2007;188:147–153. doi: 10.2214/AJR.05.0512. [DOI] [PubMed] [Google Scholar]
- 21.Liu YI, Kamaya A, Jeffrey RB, et al. Multidetector computed tomography triphasic evaluation of the liver before transplantation: importance of equilibrium phase washout and morphology for characterizing hypervascular lesions. J Comput Assist Tomogr. 2012;36:213–219. doi: 10.1097/RCT.0b013e318247c8f0. [DOI] [PubMed] [Google Scholar]


