

Here, Neves et al. present data demonstrating that H2A.Z is required for efficient pre-mRNA splicing and indicate a role for H2A.Z in coordinating the kinetics of transcription elongation and splicing.
Keywords: H2A.Z, HTZ1, RNA processing, Swr1, budding yeast, chromatin, pre-mRNA splicing
Abstract
In eukaryotes, a dynamic ribonucleic protein machine known as the spliceosome catalyzes the removal of introns from premessenger RNA (pre-mRNA). Recent studies show the processes of RNA synthesis and RNA processing to be spatio–temporally coordinated, indicating that RNA splicing takes place in the context of chromatin. H2A.Z is a highly conserved histone variant of the canonical histone H2A. In Saccharomyces cerevisiae, H2A.Z is deposited into chromatin by the SWR-C complex, is found near the 5′ ends of protein-coding genes, and has been implicated in transcription regulation. Here we show that splicing of intron-containing genes in cells lacking H2A.Z is impaired, particularly under suboptimal splicing conditions. Cells lacking H2A.Z are especially dependent on a functional U2 snRNP (small nuclear RNA [snRNA] plus associated proteins), as H2A.Z shows extensive genetic interactions with U2 snRNP-associated proteins, and RNA sequencing (RNA-seq) reveals that introns with nonconsensus branch points are particularly sensitive to H2A.Z loss. Consistently, H2A.Z promotes efficient spliceosomal rearrangements involving the U2 snRNP, as H2A.Z loss results in persistent U2 snRNP association and decreased recruitment of downstream snRNPs to nascent RNA. H2A.Z impairs transcription elongation, suggesting that spliceosome rearrangements are tied to H2A.Z's role in elongation. Depletion of disassembly factor Prp43 suppresses H2A.Z-mediated splice defects, indicating that, in the absence of H2A.Z, stalled spliceosomes are disassembled, and unspliced RNAs are released. Together, these data demonstrate that H2A.Z is required for efficient pre-mRNA splicing and indicate a role for H2A.Z in coordinating the kinetics of transcription elongation and splicing.
Eukaryotic genes are comprised of coding sequences (exons) interrupted by intervening sequences (introns). Introns are removed from the newly synthesized RNA by a large macromolecular machine known as the spliceosome. The spliceosome is a dynamic ribonucleoprotein complex made up of five highly structured small nuclear RNAs (snRNAs) and over a hundred associated proteins and catalyzes intron removal through a series of precisely coordinated rearrangements of its five snRNPs (snRNA plus associated proteins).
While RNA synthesis and RNA splicing have been traditionally analyzed as biochemically distinct reactions, many studies have demonstrated that these processes are spatially and temporally coordinated. There is ample evidence to show that the spliceosome recognizes splice sites within nascent premessenger RNA (pre-mRNA) while the RNA polymerase II (RNAPII) is actively transcribing the DNA template (Beyer and Osheim 1988, 1991; Bauren and Wieslander 1994; Bauren et al. 1996; Huang and Spector 1996; Maniatis and Reed 2002). Chromatin immunoprecipitation (ChIP) studies (in yeast and metazoans) show that spliceosome components are recruited to specific sequence signals (splice sites) in the pre-mRNA while still associated with the transcription complex (Kotovic et al. 2003; Gornemann et al. 2005; Lacadie and Rosbash 2005; Listerman et al. 2006). Recently, it has been shown that not only spliceosome recruitment but also catalysis and completion of splicing occur while the nascent RNA is associated with actively transcribing polymerase (Oesterreich et al. 2016). Support for temporal coordination of these two processes also comes from evidence showing that changes in transcription elongation rate can alter splicing efficiency and splice site selection (de la Mata et al. 2003; Howe et al. 2003; Fong et al. 2014; Oesterreich et al. 2016).
Due to the proximity of the splicing complex to the DNA synthesis machinery, splicing takes place within the context of not only transcription but also chromatin, the array of nucleosomes made up of DNA wrapped around eight histone proteins. Nucleosomes are well positioned within genes and have been found to occupy exons more frequently than introns (Schwartz et al. 2009; Amit et al. 2012), suggesting that nucleosomes help demarcate exons at the DNA level. Perturbations to chromatin organization have been linked to widespread changes in splicing, and post-translational modifications of individual histone proteins can influence splicing (for review, see Naftelberg et al. 2015). Particularly in budding yeast, monoubiquitylation of histone H2B and methylation of H3K36 by Set2 each promotes efficient splicing and is required for efficient cotranscriptional recruitment of splicing factors to the nascent mRNA (Moehle et al. 2012; Sorenson et al. 2016). Additionally, we showed that acetylation of H3 by Gcn5 is important for spliceosome assembly and downstream rearrangements (Gunderson and Johnson 2009; Gunderson et al. 2011).
In addition to the core histone proteins H2A, H2B, H3, and H4, a number of variant histones, such as H2A.Z, H3.3, and macroH2A, have also been characterized. A recent study identified a chromatin reader, BS69, that preferentially recognizes trimethylation of the histone variant H3.3 on Lys36 and physically interacts with the U5 snRNP (Guo et al. 2014), forming a physical link between the chromatin and the spliceosome, suggesting that both histones and histone variants may influence splicing. H2A.Z, encoded by HTZ1 in Saccharomyces cerevisiae, is the only histone variant found across all eukaryotes. While H2A.Z and H2A share ∼60% sequence similarity, H2A.Z is almost 90% conserved across species from yeast to humans (for review, see Zlatanova and Thakar 2008), suggesting that the variant carries out an important and conserved function in the cell, distinct from H2A. Unlike the four canonical histones, which are incorporated into chromatin at the time of DNA replication, H2A.Z can be inserted throughout the cell cycle (for review, see Zlatanova and Thakar 2008). The SWR-C remodeling complex catalyzes the displacement of the H2A/H2B dimer in the chromatin in exchange for an H2A.Z/H2B dimer. SWR-C recognizes the nucleosome-free region (NFR) surrounding the transcription start site (TSS) of genes and deposits H2A.Z in nucleosomes flanking the NFR (Ranjan et al. 2013). H2A.Z is well positioned in the chromatin as, although it is found in only 5% of nucleosomes, it is present in ∼65% of all S. cerevisiae genes, typically at the +1 and −1 nucleosomes around the TSS (Guillemette et al. 2005; Raisner et al. 2005).
H2A.Z has been shown to play an important role in the regulation of transcription initiation and gene expression (Subramanian et al. 2015). In yeast, H2A.Z interacts genetically with a number of transcription factors (TFs) (Wan et al. 2009), and, in mammals, H2A.Z is necessary for recruitment of pioneer TFs (Li et al. 2012). In vitro experiments demonstrate that H2A.Z is less stably associated with DNA and therefore is more susceptible to release from the chromatin (Zhang et al. 2005). As the +1 nucleosome poses a transcriptional barrier to RNAPII, H2A.Z may promote transcription initiation by decreasing the nucleosome barrier and promoting RNAPII progression (Zhang et al. 2005; Weber et al. 2014). Studies in yeast also indicate a role in the regulation of transcription elongation, as H2A.Z genetically interacts with elongation factors Spt5 and Dst1 (Malagon et al. 2004; Santisteban et al. 2011). Moreover, H2A.Z has been found to promote transcription elongation in both yeast and mammalian cells (Santisteban et al. 2011; Rudnizky et al. 2016).
Based on the connections between transcription and pre-mRNA splicing as well as H2A.Z's role in transcriptional regulation, we performed genetic analysis of interactions between HTZ1 and genes encoding nonessential splicing factors and showed that when any major component of the spliceosome, particularly the U2 snRNP, is compromised, the cell becomes dependent on the presence of H2A.Z. Furthermore, H2A.Z is required for efficient splicing of a subset of intron-containing genes (ICGs). This pool of genes is enriched in introns containing a branch point (BP) sequence that deviates from the highly conserved consensus sequence. Interestingly, although H2A.Z is found primarily in close proximity to the TSS, we observed H2A.Z enrichment near the BP of many ICGs. When H2A.Z is deleted, proper spliceosome rearrangements are compromised, and this is coincident with altered RNA polymerase elongation that occurs in the absence of H2A.Z. Depletion of the spliceosome disassembly factor Prp43 in cells lacking H2A.Z enhances splicing of introns, particularly of introns with nonconsensus BP sequences. These results reveal an important role for the highly conserved H2A.Z histone variant in coordinating elongation with spliceosome assembly.
Results
Cells with mutant spliceosomes are dependent on H2A.Z
In order to characterize interactions between H2A.Z and genes encoding factors involved in splicing, a targeted genetic screen was performed to identify interactions between htz1Δ and null alleles of nonessential splicing factors. Deletion of the genes encoding the U2 snRNP factors Msl1, Lea1, or Snu17 combined with deletion of HTZ1 confers synthetic lethality (Fig. 1A). Msl1 and Lea1 are yeast homologs of the human proteins U2A′/B′′ and bind a conserved stem–loop in the U2 snRNA (Tang et al. 1996). Snu17, which has been shown to associate with the U2 snRNP, is required for the release of the U1 snRNP after the addition of the U4/U6.U5 tri-snRNP and progression through the first catalytic step of splicing (Gottschalk et al. 2001). Snu17 is also a component of the retention and splicing (RES) complex, which is important for nuclear retention of unspliced pre-mRNA. This indicates that cells lacking H2A.Z are dependent on intact U2 snRNP.
Figure 1.
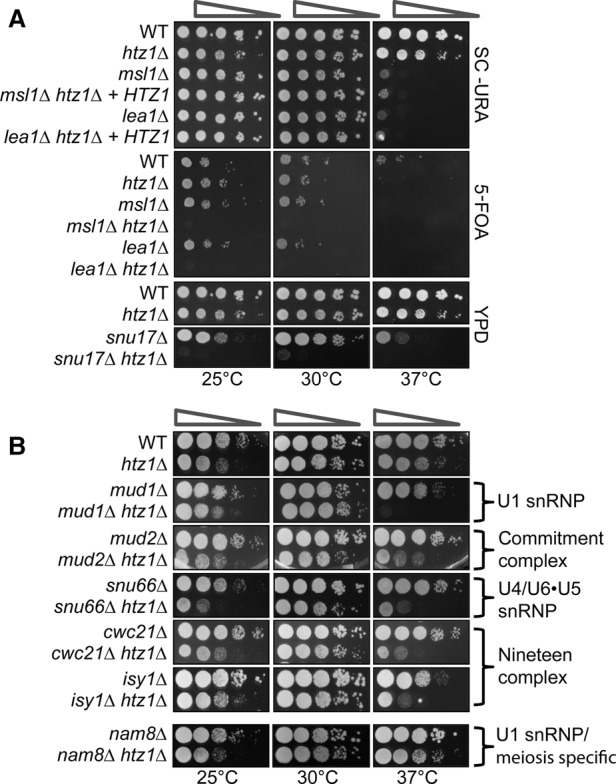
The histone variant H2A.Z is necessary for an optimal splicing environment. (A) Serial dilution assay of U2 snRNP double mutants msl1Δ htz1Δ, lea1Δ htz1Δ, and snu17Δ htz1Δ. For the msl1Δ and lea1Δ growth assay, cells were transformed with empty pRS316 URA plasmid (wild type [WT], htz1Δ, msl1Δ, and lea1Δ) or pRS316 containing HTZ1 (msl1Δ htz1Δ and lea1Δ htz1Δ). Cells were grown at 30°C in SC−URA selective liquid medium until the desired OD600 was obtained. Cells were spotted as a 10-fold dilution onto SC−URA plates or 5-FOA plates to select for loss of the plasmid. Plates were incubated for 2 d for SC−URA plates or 4 d for 5-FOA plates at 25°C, 30°C, or 37°C. For snu17Δ, cells were grown at 30°C in YPD liquid medium until the desired OD600 was obtained. Cells were spotted as a 10-fold dilution onto YPD plates and incubated for 2 d at 25°C, 30°C, or 37°C. (B) Serial dilution assay of double mutants, mud1Δ htz1Δ, mud2Δ htz1Δ, snu17Δ htz1Δ, snu66Δ htz1Δ, cwc21Δ htz1Δ, isy1Δ htz1Δ, and nam8Δ htz1Δ. Cells were grown at 30°C in YPD liquid medium until the desired OD600 was obtained. Cells were spotted as a 10-fold dilution onto YPD plates and incubated for 2 d at 25°C, 30°C, or 37°C.
Splicing is a highly dynamic process with thermal-sensitive RNA–RNA and RNA–protein interactions. We suspected that if H2A.Z affects splicing factor recruitment and/or rearrangements of the spliceosome, then perturbations in temperature could reveal additional genetic interactions between HTZ1 and genes encoding splicing factors. To identify these interactions, we repeated our targeted genetic screen under growth temperatures that are suboptimal (37°C and 25°C). This analysis revealed genetic interactions between HTZ1 and genes encoding components of every major spliceosomal complex (Fig. 1B). Slow growth phenotypes in many of the double mutants are exacerbated at higher temperatures, indicating that H2A.Z may be important for stabilizing spliceosomal complexes and/or rearrangements, especially in destabilizing conditions such as thermal stress. A notable exception is Nam8, a U1-associated factor that is particularly important for meiosis-specific splicing (Fig. 1B, bottom; Spingola and Ares 2000). Together, these genetic interactions indicate that a mutant spliceosome—and especially a compromised U2 snRNP—is particularly sensitive to the absence of H2A.Z in the chromatin.
H2A.Z is required for optimal splicing of a subset of ICGs
In order to determine whether deletion of H2A.Z affects splicing, we used RNA sequencing (RNA-seq) to analyze the effect of HTZ1 deletion genome-wide. We compared the splicing efficiency of ICGs in wild-type and htz1Δ cells (Fig. 2A, left). Ribosomal protein genes (RPGs), which account for roughly one-third of all ICGs, show little to no change in splicing efficiency upon deletion of H2A.Z (Fig. 2A). However, H2A.Z is required for optimal splicing of a subset of ICGs with distinct properties. Notably, among non-RPGs, introns with nonconsensus BP sequences have a significantly stronger splicing defect than those with consensus BP sequences (P = 0.018) (Fig. 2A, right). In yeast, the highly conserved canonical BP sequence is UACUAAC, while the sequences most affected by HTZ1 deletion contain the sequences that differ at the +1 position of the BP sequence: GACUAAC (5), AACUAAC (5), and CACUAAC (4). Neither nonconsensus 5′ splice site (5′SS) nor 3′ splice site (3′SS) sequences show this significantly enhanced dependence on H2A.Z for optimal splicing compared with non-RPG introns with consensus splice sites (Supplemental Fig. S1A, left), reinforcing the connection between H2A.Z and the U2 snRNP, which directly base-pairs with the BP sequence.
Figure 2.
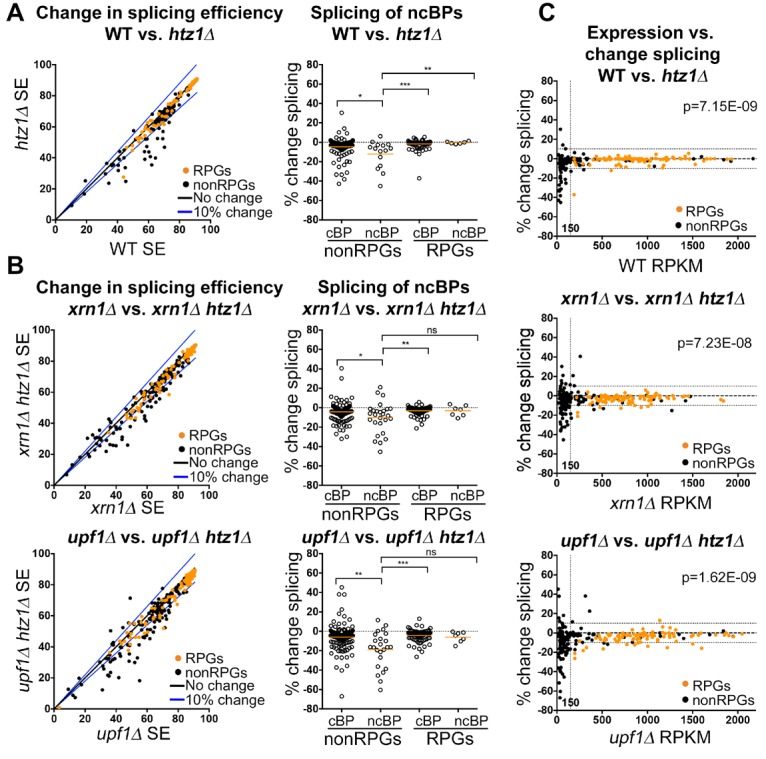
H2A.Z is required for optimal splicing of a subset of ICGs. (A, left) Distribution in splicing efficiencies of all ICGs upon deletion of HTZ1, represented as an X–Y plot. RPGs are denoted in orange. (Right) Distribution of changes in splicing in groups of ICGs characterized by RPGs or non-RPGs and consensus or nonconsensus BPs. (B, left) Distribution in splicing efficiencies of all ICGs upon deletion of HTZ1 in either xrn1Δ (top) or upf1Δ (bottom) cells, represented as an X–Y plot. RPGs are denoted in orange. (Right) Distribution of changes in splicing in groups of ICGs characterized by RPGs or non-RPGs and consensus or nonconsensus BPs. P-values were determined by Mann-Whitney. (C) Distribution of changes in splicing efficiency upon deletion of HTZ1 compared with reads per kilobase per million mapped reads (RPKM) in wild-type (top), xrn1Δ (middle), and upf1Δ (bottom) cells. The vertical dotted line represents RPKM of 150. The horizontal lines represent 10% change in splicing efficiency. Genes with an RPKM ≤150 are enriched in genes with ≥10% splicing defect (χ2 test; P-values are indicated). (cBP) Consensus BP; (ncBP) nonconsensus BP; (ns) not significant; (*) P-value < 0.05; (**) P-value < 0.01; (***) P-value < 0.001.
We and others have shown previously that defects in splicing are often masked by the rapid turnover of misspliced and unspliced transcripts (Hossain et al. 2011; Kawashima et al. 2014). To determine whether rapid turnover of misspliced transcripts masks splicing defects that occur in htz1Δ cells, we performed RNA-seq analysis in cells lacking HTZ1 in combination with deletion of genes encoding cytoplasmic degradation pathway proteins Xrn1 or Upf1. Xrn1 is a 3′–5′ exonuclease (Larimer and Stevens 1990), and Upf1 is an ATP-dependent RNA helicase involved in nonsense-mediated decay (Ono et al. 2005). Genome-wide profiles of splicing efficiency in htz1Δ cells in the degradation mutant background are similar to the wild-type background profile (Fig. 2A,B, left). However, the subset of genes whose splicing is most strongly affected by deletion of HTZ1 is larger, and splicing defects are often stronger in the degradation mutant backgrounds than the wild-type background, likely because unspliced transcripts are stabilized in the absence of Xrn1 or Upf1 (Fig. 2B). In both the xrn1Δ and upf1Δ mutant backgrounds, a significant majority of RPGs exhibits a <5% change in splicing when HTZ1 is deleted (P = 0.023 and P = 0.032, respectively). Similar to the wild-type background, the subset of genes whose splicing is most strongly affected in htz1Δ is characterized by non-RPGs with nonconsensus BP sequences (Fig. 2B, right; Supplemental Fig. S1A).
RNA-seq analysis revealed 91 ICGs with a splice defect (≥10%) upon deletion of HTZ1 in at least one background (wild type, xrn1Δ, or upf1Δ) (Supplemental Fig. S1B). This pool of genes is enriched in introns containing nonconsensus BPs (24 of 91 introns; P = 0.003). Of these 91 genes, 23 genes showed decreased splicing in both degradation mutant backgrounds, and 52 genes showed decreased splicing in only the xrn1Δ or upf1Δ background. It is clear that these degradation pathways can overlap, but there may be additional signals that help determine which pathway is used to remove specific unspliced transcripts.
H2A.Z is deposited in the chromatin in place of the canonical histone H2A. Swr1, a Swi2/Snf2-related ATPase, catalyzes this exchange (Krogan et al. 2003; Kobor et al. 2004; Mizuguchi et al. 2004). Similarly to HTZ1, SWR1 interacts with genes encoding early splicing factors (Supplemental Fig. S2A). Loss of Swr1 leads to a global decrease in H2A.Z occupancy and loss of H2A.Z enrichment at promoters (Mizuguchi et al. 2004; Zhang et al. 2005; Sadeghi et al. 2011). We therefore asked whether Swr1 has effects on splicing similar to those of H2A.Z. To address this question, splicing efficiency of ICGs was analyzed in swr1Δ, swr1Δ xrn1Δ, and swr1Δ upf1Δ background cells (Supplemental Fig. S2B). Similar to H2A.Z, Swr1 appears to be important for optimal splicing of a subset of genes. Additionally, there is considerable overlap between the splicing efficiency in swr1Δ and htz1Δ cells (Supplemental Fig. S2C). While a number of genes display better splicing in swr1Δ cells as compared with htz1Δ cells, these affected genes are, for the most part, the same genes affected by H2A.Z loss (Supplemental Fig. S2D). While loss of Swr1 leads to decreased H2A.Z occupancy at promoters, it does not completely eliminate the H2A.Z in the chromatin, as Swr1-independent H2A.Z incorporation has been observed (Sadeghi et al. 2011). Residual H2A.Z in the chromatin likely accounts for the moderated splice defect in swr1Δ as compared with htz1Δ cells. Together, these results suggest that the effect of Swr1 on splicing is likely due to its role in H2A.Z exchange.
H2A.Z occupancy is reported to be negatively correlated to transcription and has been implicated in regulating gene expression (Santisteban et al. 2000; Zhang et al. 2005). We therefore asked whether defects in splicing correlate with gene expression. ICGs with strong splicing defects also have relatively low expression (reads per kilobase per million mapped reads [RPKM] <150) in the wild-type or degradation mutant background (Fig. 2C). We considered the possibility that this correlation was due to a bias in our sequencing results or filtering process. To ensure that the results are not due to an artifact of the sequencing data, we analyzed genes that did not pass the minimum-read filter threshold (Supplemental Fig. S3A). We found that changes in splicing of these genes are evenly distributed between increased and decreased splicing efficiency, demonstrating that our filters effectively removed noise and that there was no significant selection bias (Supplemental Fig. S3B). If splicing defects observed in ICGs with low expression are due to stochastic variation, we would expect the distribution of genes with increased or decreased splicing efficiency to be the same in our filtered data and in the noise. However, we found that lowly expressed ICGs are significantly enriched in genes that have ≥10% decrease in splicing upon loss of H2A.Z as compared with the noise (P << 0.01 in all backgrounds) (Fig. 2C).
RT–PCR analysis confirms that genes with nonconsensus splice sites are particularly sensitive to loss of H2A.Z
In order to verify the RNA-seq results, RT–PCR was used to assess the splicing of a pool of candidate genes. Since unspliced pre-mRNA is targeted by both Xrn1 and Upf1 in ways that mask H2A.Z's effect on splicing, we decided to focus on two groups of genes: (1) genes that show intron accumulation in the wild-type, xrn1Δ, and upf1Δ backgrounds (eight genes) (Supplemental Fig. S1B) and (2) genes that show intron accumulation in both the xrn1Δ and upf1Δ cell backgrounds (15 genes) (Supplemental Fig. S1B). Of these 23 genes, nine contain introns with at least one nonconsensus splice site (Fig. 3A, in orange).
Figure 3.

RT–PCR analysis confirms that genes with nonconsensus splice sites are particularly sensitive to loss of H2A.Z. (A) Group 1 consists of ICGs whose splicing decreases by ≥10% in the wild-type, xrn1Δ, and upf1Δ backgrounds. Group 2 consists of ICGs whose splicing decreases by ≥10% in the xrn1Δ and upf1Δ backgrounds. Genes that did not pass the minimum-read filter in the wild-type background are denoted in blue. Nonconsensus splice sites are denoted in orange. (RPS22B) 5′ untranslated region (UTR) intron; (RPS22B_2) coding region intron. (B) Analysis of group 1 genes by RT–PCR in wild-type, xrn1Δ, and upf1Δ cells ±HTZ1. Products were analyzed on 6% PAGE gels (8% for SUS1). Pre-mRNA size is indicated by genomic DNA size. (C) Quantification of group 1 RT–PCR unspliced (pre-mRNA) products. (Bottom right) Quantification of SUS1 pre-mRNA and splicing intermediate containing only the second SUS1 intron. (D) Analysis of group 2 genes by RT–PCR in wild-type, xrn1Δ, and upf1Δ cells ±HTZ1. Products were analyzed on 6% PAGE gels. Pre-mRNA size is indicated by genomic DNA size. (E) Quantification of group 2 RT–PCR unspliced products. (F) Quantification of group 1 and group 2 RT–PCR unspliced products in rrp6Δ cells ±HTZ1. Quantification graphs represent the average of two independent experiments, and error bars represent the standard deviation (SD). (gDNA) Genomic DNA.
RT–PCR confirmed the decreased splicing of all eight genes in group 1 in the presence and absence of H2A.Z in wild-type, xrn1Δ, and upf1Δ cells (Fig. 3B,C). We examined the splicing intermediates of the two-intron gene SUS1, whose splicing has been well characterized (Hossain et al. 2009, 2011). SUS1 is unique not only because it is one of the 10 yeast genes that contain multiple introns but also because its first intron contains both a nonconsensus 5′SS and BP sequence (Fig. 3A). Upon deletion of HTZ1, there is modest accumulation of SUS1 pre-mRNA and strong accumulation of partially spliced (first intron retained) mRNA (Fig. 3C, bottom right). Due to its weak splice sites, the first intron of SUS1 is more susceptible to H2A.Z loss.
Of the 15 genes in group 2, seven genes did not pass our minimum-read filter in the wild-type cells and were not included in the RNA-seq analysis (Fig. 3A, in blue). It is possible that deletion of HTZ1 causes decreased splicing of these introns in the wild-type background as well. We therefore used RT–PCR to confirm htz1Δ-related splicing defects in group 2 genes in wild-type, xrn1Δ, and upf1Δ cells (Fig. 3D,E). As expected, upon HTZ1 deletion, these genes have decreased splicing in not only the degradation mutant background but also the wild-type background.
In a recent report, H2A.Z has been shown to act coordinately with the nuclear exosome, particularly the Rrp6 subunit, to control RNA expression and turnover (Rege et al. 2015). Rrp6 is a 3′–5′ exonuclease that has been implicated in the turnover of unspliced transcripts (Bousquet-Antonelli et al. 2000; Sayani and Chanfreau 2012). To determine whether the nuclear exosome is important for clearing the cell of unspliced transcripts that arise in htz1Δ cells, we used RT–PCR to analyze the splicing of our candidate genes in the presence and absence of H2A.Z in rrp6Δ cells (Fig. 3F). Deletion of RRP6 alone results in increased pre-mRNA and, similar to XRN1 and UPF1 deletion, stabilizes many unspliced transcripts in htz1Δ cells, indicating that the nuclear exosome is important for clearing erroneous unspliced transcripts that arise in htz1Δ cells.
Because we found interactions between H2A.Z and components of every major spliceosome complex (Fig. 1A,B), we also examined splicing of our candidate genes in viable double mutants lacking H2A.Z and U1 snRNP factor Mud1 or nineteen complex (NTC) factor Isy1. Consistent with our genetic analyses, deletion of HTZ1 enhances splicing defects of mud1Δ and isy1Δ cells (Supplemental Fig. S4A). Intriguingly, while splicing of most intron-containing RPGs is unaffected by HTZ1 deletion alone, when H2A.Z loss is combined with deletion of splicing factor components, RPG splicing is defective (Supplemental Fig. S4B,C). Most intron-containing RPGs have consensus BP sequences (93%) and are efficiently spliced (Fig. 2A). Thus, it appears that, in general, H2A.Z deletion negatively affects splicing, but this effect is less obvious when splicing is robust. Moreover, these data indicate that H2A.Z generally affects the process of splicing, but BP recognition is particularly susceptible to changes in the splicing environment such that splicing of introns containing nonconsensus BP sequences is inefficient in htz1Δ cells even under otherwise optimal conditions.
H2A.Z-mediated splicing defects are not due to changes in spliceosome availability
H2A.Z is reported to be involved in transcriptional regulation and gene expression (Santisteban et al. 2000; Zhang et al. 2005). We therefore considered the possibility that the splicing effect of HTZ1 deletion was due to altered transcription of a gene involved in splicing. However, RNA-seq analysis shows no significant change in the expression of genes encoding general splicing factors (Chen and Cheng 2012) or spliceosomal snRNAs (Supplemental Table S1; Supplemental Fig. S5A).
It also has been shown that competition between RNAs for spliceosome components alters splicing efficiency. Specifically in S. cerevisiae, due to the large number of intron-containing RPGs, perturbations to RPG expression alter the availability of the spliceosome to non-RPG pre-mRNAs (Munding et al. 2013). Therefore, up-regulation of RPG expression could lead to a decrease in splicing of non-RPGs. However, this is not the case, as the RNA-seq results show no significant change in expression of RPGs (Supplemental Fig. S5B).
H2A.Z is enriched around splice sites
H2A.Z is enriched around the TSS of the majority of yeast genes, typically in the +1 and −1 nucleosome flanking the NFR (Ranjan et al. 2013; Gu et al. 2015). However, recent reports indicate that, in Drosophila, H2A.Z also demarcates exon boundaries (Weber et al. 2010), while, in humans, a histone variant highly related to H2A.Z is enriched near BPs of introns (Tolstorukov et al. 2012). This suggested to us that H2A.Z's effects on splicing may be a direct result of H2A.Z's positioning relative to splicing-specific gene features in yeast. Using previously published ChIP-seq (ChIP combined with high-throughput sequencing) data (Gu et al. 2015), we confirmed that H2A.Z occupies the nucleosomes flanking the TSS of most ICGs (Fig. 4A,B, left). Additionally, H2A.Z is well positioned over, or just upstream of, the BP sequence and the 3′SS of many ICGs (Fig. 4B). At this point, it is unclear what the mechanism of this increased occupancy of H2A.Z is at particular intron sequences, but it follows a trend similar to other histone enrichment patterns within introns (for review, see Brown et al. 2012; Saldi et al. 2016). In parallel studies in Schizosaccharomyces pombe, this pattern of H2A.Z enrichment around splicing signals is also observed (Nissen et al. 2017).
Figure 4.
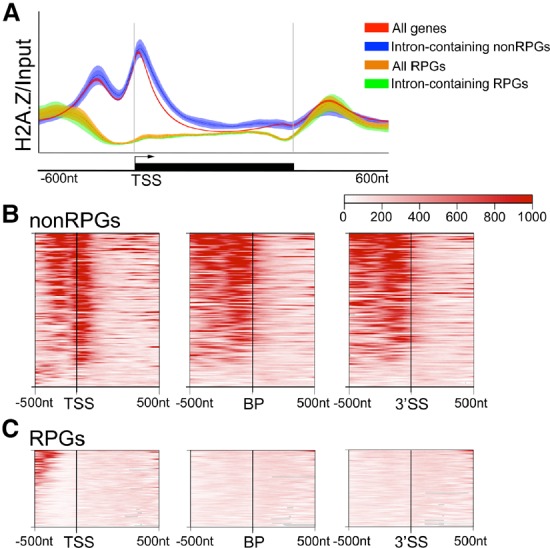
H2A.Z is well positioned near splice sites in non-RPGs. (A) H2A.Z ChIP-seq occupancy over input across the transcribed region and 600 nucleotides (nt) upstream of and downstream from the TSS and transcription stop site of all genes, all ICGs, all RPGs, intron-containing RPGs, and intron-containing non-RPGs. Lines represent the average fold enrichment of two biological replicates and 95% CI. The Y-axis represents 0–1000 mapped ChIP reads normalized to input. Analysis of data from Gu et al. (2015). (B) Hierarchical clustering of H2A.Z-binding profiles of intron-containing non-RPGs around TSSs or splice sites, oriented gene-directionality. (Left) Five-hundred nucleotides upstream of and 1000 nt downstream from the TSS. The vertical line indicates the TSS. Five-hundred nucleotides upstream of and 500 nt downstream from the BP sequence (middle) or 3′SS (right). n = 147. Introns found in the 5′ UTR were excluded. (C) Hierarchical clustering of H2A.Z-binding profiles of intron-containing RPGs around TSSs or splice sites, oriented gene-directionality. (Left) Five-hundred nucleotides upstream of and 1000 nt downstream from the TSS. The vertical line indicates the TSS. Five-hundred nucleotides upstream of and 500 nt downstream from the BP sequence (middle) or 3′SS (right). n = 88. Introns found in the 5′ UTR were excluded. Analysis of data by Gu et al. (2015), including an average of two biological replicates.
A number of studies found that RPGs are deplete of H2A.Z-containing nucleosomes (Raisner et al. 2005; Zhang et al. 2005; Ranjan et al. 2013; Gu et al. 2015). Consistent with these studies, we observed low H2A.Z occupancy at the TSS, BP sequence, and 3′SS of intron-containing RPGs (Fig. 4A,C). Recently, it has been shown that the preinitiation complex is required for H2A.Z eviction from the chromatin during active transcription (Tramantano et al. 2016). Because RPGs are highly transcribed genes, it is possible that ChIP-seq experiments cannot capture H2A.Z occupancy in these genes due to rapid nucleosome turnover. In fact, depletion of components of the transcription machinery leads to H2A.Z accumulation in RPGs (Tramantano et al. 2016), demonstrating that, although steady-state levels are low, H2A.Z is present in RPGs and could contribute to their efficient splicing (Supplemental Fig. S4).
Cotranscriptional U2 snRNP rearrangement and downstream recruitment profiles are defective in the absence of H2A.Z
Cotranscriptional recruitment of the spliceosome to the nascent pre-mRNA has been shown to occur in a predictable and stepwise fashion (Kotovic et al. 2003; Gornemann et al. 2005; Lacadie and Rosbash 2005; Tardiff and Rosbash 2006). When spliceosomal rearrangements are perturbed, a lag in snRNP disengagement can be observed (Gornemann et al. 2005; Lacadie and Rosbash 2005; Tardiff and Rosbash 2006). Our previous studies demonstrated that histone acetylation patterns affect the recruitment of the U2 snRNP and alter spliceosomal rearrangements (Gunderson and Johnson 2009; Gunderson et al. 2011). Because ICGs containing nonconsensus BPs were enriched in our RNA-seq analysis and because we observed genetic interactions between HTZ1 and several components of the U2 snRNP, we first analyzed U2 snRNP recruitment to nascent mRNA. We specifically examined the recruitment of Msl1, the U2B homolog, to two genes with H2A.Z occupancy upstream of the ORF (ECM33 and YCL002C) and one gene deplete of H2A.Z occupancy (RPL13A) (Fig. 5A; Gu et al. 2015). The pattern of splicing factor recruitment to ECM33 has been reported previously (Gornemann et al. 2005; Gunderson and Johnson 2009; Gunderson et al. 2011). YCL002C has a nonconsensus 5′SS and BP, and deletion of HTZ1 leads to a splicing defect in this gene (Figs. 3B, 5B). While deletion of HTZ1 results in no significant change in the recruitment of Msl1 to the selected genes, there is increased Msl1 enrichment at primer set 4 of ECM33 and primer set 5 of YCL002C (Fig. 5D). This persistent U2 snRNP association suggests decreased U2 snRNP dissociation, and similar occupancy profiles have been interpreted as a defect in spliceosomal rearrangements (Gunderson et al. 2011). Surprisingly, RPL13A shows no significant increase in Msl1 in the gene body (Fig. 5D, right). Total protein levels of Msl1 or its interaction partner, Lea1, are unaffected by deletion of HTZ1 (Supplemental Fig. S6A). This result indicates that H2A.Z's presence in the chromatin is important for the spliceosomal rearrangements that involve the U2 snRNP.
Figure 5.
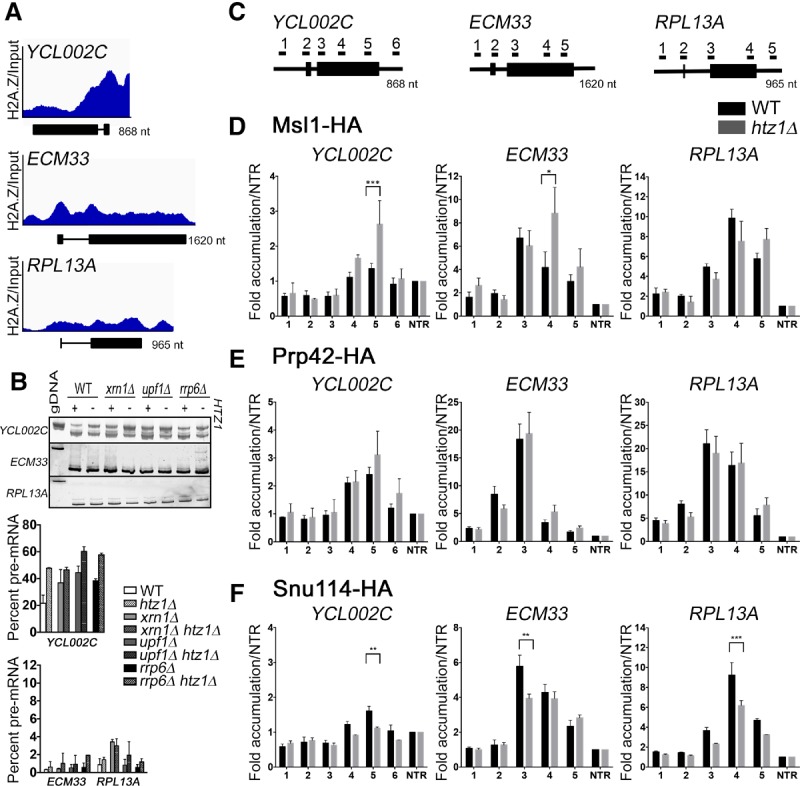
Cotranscriptional U2 snRNP recruitment is defective in the absence of H2A.Z. (A) Integrative Genome Viewer track view of H2A.Z occupancy over input by ChIP-seq across the ORF of YCL002C (top), ECM33 (middle), and RPL13A (bottom). The Y-axis represents 0–1000 mapped ChIP reads normalized to input. A schematic of each gene is included below each occupancy profile. Analysis of data from Gu et al. (2015). (B, top) Analysis of YCL002C, ECM33, and RPL13A genes by RT–PCR in the presence and absence of HTZ1. Products were analyzed on 6% PAGE gels. Pre-mRNA size is indicated by genomic DNA size. (Bottom) Quantification of RT–PCR products. Graphs represent the average of two independent experiments, and error bars represent the SD. (C) Schematic of ICGs YCL002C, ECM33, and RPL13A. Underlined numbers represent amplicons generated by each primer set used in this experiment. (D) Occupancy of Msl1 at each region of YCL002C (left), ECM33 (middle), or RPL13A (right) relative to the nontranscribed region in wild type or htz1Δ. Graphs represent the average of six (wild type) or three (htz1Δ) independent experiments, and error bars represent the standard error of the means (SEM). P-values for each primer set were determined by Student's t-test. Significant values are indicated. (E) Occupancy of Prp42 at each region candidate gene relative to the nontranscribed region in wild type or htz1Δ. Graphs represent the average of four independent experiments, and error bars represent the SEM. P-values for each primer set were determined by Student's t-test. No significant values were found. (F) Occupancy of Snu114 at each region of candidate genes relative to the nontranscribed region in wild type or htz1Δ. Graphs represent the average of three independent experiments, and error bars represent the SEM. P-values for each primer set were determined by Student's t-test. Significant values are indicated. (gDNA) Genomic DNA. (*) P-value < 0.01; (**) P-value < 0.001; (***) P-value < 0.0001.
The observed Msl1 recruitment profiles, along with the results from our targeted genetic screen and RNA-seq analysis, suggest a specific role for H2A.Z in U2 snRNP function and/or rearrangements involving the U2 snRNP. However, it is possible that deletion of HTZ1 acts more generally upon cotranscriptional recruitment or rearrangements of all snRNPs. To determine whether H2A.Z affects events upstream of U2 snRNP recruitment, we examined the recruitment of the U1 snRNP component Prp42 to ECM33, YCL002C, and RPL13A. Deletion of HTZ1 does not affect Prp42 recruitment profiles to any of our candidate genes (Fig. 5E), suggesting that H2A.Z likely affects spliceosomal rearrangements that occur after U1 snRNP release. Total protein levels of Prp42 are unchanged by loss of H2A.Z (Supplemental Fig. S6B).
We predicted that, because of the stepwise cotranscriptional recruitment of splicing factors, association of splicing factors recruited to the nascent mRNA after U2 snRNP would be negatively impacted by loss of H2A.Z. In fact, there is decreased association of the U5 snRNP representative protein Snu114 with all candidate genes in the absence of HTZ1 (Fig. 5F). While we observed no change in U2 snRNP occupancy at RPL13A, U5 snRNP occupancy is markedly decreased (Fig. 5F). This is consistent with our RT–PCR results in which H2A.Z loss exacerbates RPG splicing defects when the spliceosome is compromised (Supplemental Fig. S4C). H2A.Z likely affects spliceosome dynamics at all ICGs, but, because splicing of RPGs is particularly robust, spliceosome rearrangements do not rely as heavily on H2A.Z's presence in healthy cells. Decreased Snu114 occupancy cannot be attributed to changes in protein expression (Supplemental Fig. S6C). These results suggest that loss of H2A.Z increases the association of the U2 snRNP and reduces the association of downstream splicing factors. These results are consistent with a role for H2A.Z in efficient spliceosomal rearrangements.
RNAPII kinetics are altered upon loss of H2A.Z
Because we found that H2A.Z is enriched around splice sites of many ICGs, it is possible that H2A.Z promotes splicing through physical interactions with the spliceosome, perhaps through a chromatin-associated adaptor protein. Indeed, such physical interactions between splicing factors and histones have been reported (Sims et al. 2007; Luco et al. 2010), and, in humans, it has been reported that H2A.Z weakly binds the SF3B complex (Tolstorukov et al. 2012). However, we found no direct interactions between H2A.Z and tested splicing factors (Prp43, Snu66, Prp4, Lea1, Msl1, Snu114, and Cus1) (data not shown).
Cotranscriptional splicing is spatially and temporally linked to transcription, and therefore changes in RNAPII elongation rates and pausing can perturb the precisely timed rearrangements of the spliceosome and alter splicing outcomes (de la Mata et al. 2003; Howe et al. 2003; Carrillo Oesterreich et al. 2010). As H2A.Z has roles in the regulation of both transcription initiation and elongation, we considered the possibility that H2A.Z helps coordinate the processes of transcription and splicing (Santisteban et al. 2000, 2011; Zhang et al. 2005; Wan et al. 2009; Li et al. 2012; Weber et al. 2014; Subramanian et al. 2015; Rudnizky et al. 2016).
In order to determine whether loss of H2A.Z affects RNAPII kinetics in such a way that it could alter spliceosome rearrangements, we first examined the recruitment of Rpb3, the large subunit of RNAPII, to YCL002C, ECM33, and RPL13A. While Rpb3 recruitment to the promoter is unchanged in htz1Δ cells, Rpb3 occupancy through the gene body of ECM33 and RPL13A is decreased in htz1Δ cells compared with wild-type cells (25%–31% decrease for locations 2–5) (Fig. 6B). We observed a small but consistent decrease of Rpb3 occupancy in YCL002C (11%–16% decrease for all locations) (Fig. 6B, left). YCL002C is a lowly expressed gene with generally low Rpb3 occupancy, and we believe that this makes it difficult to resolve the differences in polymerase enrichment. In order to determine whether changes in RNAPII occupancy are specific to ICGs or are a general outcome of HTZ1 deletion, we examined Rpb3 recruitment to an intronless gene, PMA1. We found that, similar to the candidate ICGs, Rpb3 occupancy is reduced in PMA1 upon HTZ1 deletion (17%–36% decrease for all locations) (Fig. 6B, right). Unlike ECM33 and RPL13A, Rpb3 occupancy is decreased at primer set 1 of PMA1. This could be due to primer set 1 amplifying a region just downstream from the TSS. However, this may also indicate decreased Rpb3 recruitment to the promoter of PMA1 in htz1Δ cells. Total protein levels of Rpb3 are unchanged by loss of H2A.Z (Supplemental Fig. S6D). These results indicate that loss of H2A.Z reduces RNAPII occupancy and influences transcription elongation. While additional changes such as polymerase pausing or processivity cannot be ruled out, decreased RNAPII occupancy in htz1Δ cells likely reflects slowed transcription elongation. Not only does slow elongation correlate with decreased RNAPII occupancy (Mason and Struhl 2005; Garcia et al. 2010, 2012; Malik et al. 2017), but H2A.Z deletion has been shown previously to lead to a decreased rate of elongation in both yeast and mammalian cells (Santisteban et al. 2011; Rudnizky et al. 2016). Therefore, our results are consistent with past findings that H2A.Z promotes efficient transcription elongation and that H2A.Z deletion leads to changes likely including, but not limited to, slow elongation rate.
Figure 6.
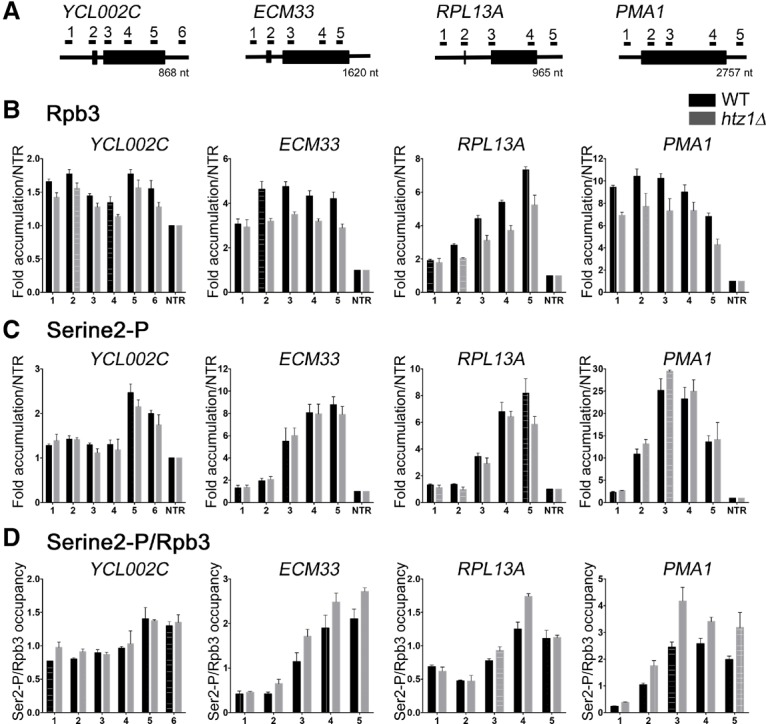
RNAPII elongation kinetics are altered in the absence of H2A.Z. (A) Schematic of ICGs YCL002C, ECM33, and RPL13A and intronless gene PMA1. (B) Occupancy of Rpb3 at each region of YCL002C (left), ECM33 (middle left), RPL13A (middle right), or PMA1 (right) relative to the nontranscribed region in wild type or htz1Δ. Graphs represent the average of three independent experiments, and error bars represent the SEM. (C) Ser2 phosphorylation state of the RNAPII C-terminal domain at each region of candidate genes relative to the nontranscribed region in wild type or htz1Δ. Graphs represent the average of three independent experiments, and error bars represent the SEM. (D) Ser2 phosphorylation state (from C) normalized to Rpb3 (from B) occupancy at each region of candidate genes.
RNAPII contains a unique C-terminal domain (CTD) consisting of sequence repeats that are phosphorylated in a predictable manner during transcription elongation. Typically, the polymerase is hypophosphorylated at the promoter and, upon initiation, becomes phosphorylated at Ser5. Ser5 phosphorylation (Ser5-P) declines near the 3′ end of the transcript in favor of Ser2-P (Komarnitsky et al. 2000; Alexander et al. 2010). This dynamic phosphorylation has been implicated in regulating transcription elongation kinetics, and Ser2-P in particular is a hallmark of the elongating polymerase (for review, see Hsin and Manley 2012). Because perturbations to CTD phosphorylation reflect changes in active elongation (Garcia et al. 2010; Allepuz-Fuster et al. 2014; Davidson et al. 2014), we analyzed Ser2-P states on our candidate genes. Although HTZ1 deletion results in decreased RNAPII occupancy across candidate genes, there is increased Ser2-P on polymerases bound to the 3′ ends of ECM33, RPL13A, and PMA1 in htz1Δ cells (Fig. 6C,D). Because polymerase occupancy of YCL002C is low compared with other candidate genes, we were not able to observe small changes in Ser2-P on this gene (Fig. 6C,D, left). We found that Ser2-P begins to accumulate earlier toward the 5′ end in the gene bodies of YCL002C, ECM33, and PMA1 in htz1Δ cells as compared with wild-type cells (Supplemental Fig. S7B). These findings are similar to past studies that have shown that transcription elongation defects correlate with increased Ser2-P (Garcia et al. 2010, 2012), Hence, it appears that increased pausing or slower elongation in cells lacking H2A.Z may allow Ser2-P accumulation earlier in transcription.
Deletion of a general elongation factor exacerbates H2A.Z-mediated splice defects and affects U2 snRNP recruitment profiles
We suspected that if H2A.Z affects splicing via its role in transcription elongation, we might be able to observe functional interactions between H2A.Z and elongation factors. Consistent with this, we observed slow growth in cells lacking both H2A.Z and the general elongation factor Dst1 (TFIIS) (Supplemental Fig. S8A). Dst1 promotes elongation and prevents backtracking of stalled polymerase elongation complexes (for review, see Freedman et al. 2013). In the absence of Dst1, RNAPII elongation is compromised, and polymerase pause sites are altered, particularly under transcriptional stress (Mason and Struhl 2005; Churchman and Weissman 2011). Intriguingly, deletion of Dst1 can also negatively affect splicing and lead to aberrant intron retention (Lacadie et al. 2006; Carey 2015). While loss of Dst1 alone does not decrease splicing of our candidate genes, deletion of DST1 in htz1Δ cells exacerbates H2A.Z-mediated splice defects, and we observed increased pre-mRNA levels in double mutants (Supplemental Fig. S8B). The SUS1 splicing intermediate that retains the nonconsensus first intron, but not the unspliced pre-mRNA, accumulates in dst1Δ htz1Δ cells, suggesting that, similar to htz1Δ, splicing of introns with nonconsensus BP sequences is particularly affected in the double mutant (Supplemental Fig. S8B, right).
Deletion of Dst1 not only decreases polymerase processivity (Mason and Struhl 2005) but was also found, in a genome-wide study, to decrease RNAPII occupancy by 1.6-fold, on average, compared with wild-type cells (Ghavi-Helm et al. 2008). Because Dst1 loss exacerbates splicing defects in htz1Δ cells and generally decreases RNAPII occupancy, we asked whether Dst1 could affect spliceosome rearrangements similar to H2A.Z. Consistent with our observations in htz1Δ cells, enrichment of the U2 snRNP factor Msl1 is increased at YCL002C in dst1Δ cells (Supplemental Fig. S8D, left). While Dst1 and H2A.Z likely affect transcription elongation in different ways, this supports a model in which elongation defects can lead to changes in U2 snRNP occupancy patterns.
Depletion of disassembly factor Prp43 can suppress H2A.Z-mediated splice defects
Our findings that H2A.Z affects spliceosome rearrangements and transcription elongation suggest that the kinetics of transcription and splicing are well coordinated. We suspect that, in the absence of H2A.Z, spliceosome kinetics are disrupted by changes in transcription elongation, and stalled spliceosomes are disassembled while pre-mRNA is released. Prp43 is a DEAH-box helicase that has functions in ribosome biogenesis as well as spliceosome disassembly (Arenas and Abelson 1997; Leeds et al. 2006). Prp43 not only catalyzes disassembly upon completion of splicing (Arenas and Abelson 1997) but can also disassemble spliceosomes when splicing is slowed (Koodathingal et al. 2010; Koodathingal and Staley 2013). Intriguingly, deletion of HTZ1 suppresses the growth defect of prp43DAmP cells (Fig. 7A). In this strain, the 3′ untranslated region (UTR) of PRP43 is disrupted with an antibiotic resistance cassette, which leads to decreased RNA expression (Supplemental Fig. S9A). Surprisingly, despite the severe growth defect, we did not observe a significant splicing defect for our candidate genes when Prp43 expression was decreased (Fig. 7B). This suggests that the Prp43 functions outside of splicing are significant contributors to the growth defect of prp43DAmP cells. Interestingly, decreased Prp43 partially suppresses the splicing defect observed in htz1Δ cells, indicating that spliceosome disassembly is at least partially responsible for pre-mRNA accumulation in cells lacking H2A.Z (Fig. 7B; Supplemental Fig. S9B). We next analyzed splicing genome-wide to determine to what extent Prp43 depletion suppresses H2A.Z-mediated splice defects. Splicing is largely unaffected by Prp43 depletion alone; however, there are subsets of ICGs whose splicing efficiency increases or decreases in prp43DAmP cells, suggesting gene-specific sensitivity to Prp43 depletion (Supplemental Fig. S9C). Consistent with the results shown in Figure 7B, we found that Prp43 depletion in htz1Δ cells improves splicing in a subset of ICGs (Fig. 7C left). The pool of genes in which splicing is most improved by Prp43 depletion (≥10%) is significantly enriched with introns containing a nonconsensus BP (P = 0.005). Additionally, among non-RPGs, splicing of introns containing a nonconsensus BP sequence is significantly more improved by Prp43 depletion than splicing of those with consensus BP sequences (P = 0.01) (Fig. 7C right). Consistent with our observations in htz1Δ cells, introns with nonconsensus BPs are more sensitive to Prp43 depletion than those with nonconsensus 5′SSs or 3′SSs (Supplemental Fig. S9D). Together, these data suggest that when rearrangements involving the U2 snRNP are defective or slowed in htz1Δ cells, decreased disassembly may allow more time for spliceosome rearrangements to occur.
Figure 7.
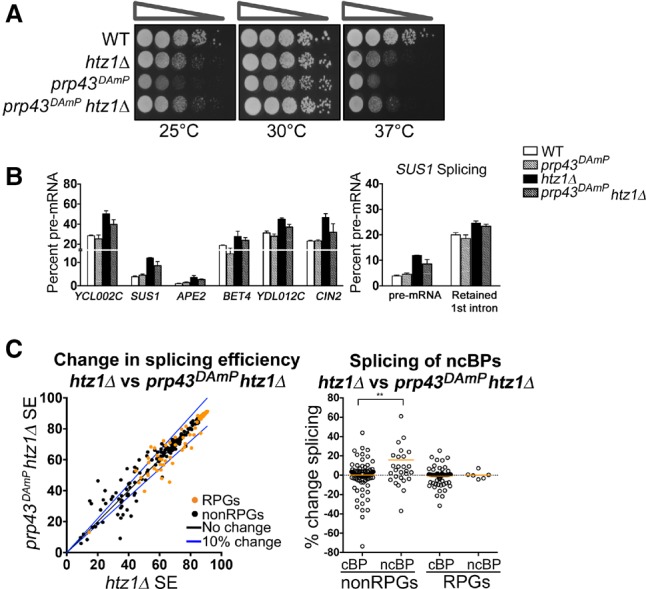
Decreased spliceosome disassembly can suppress H2A.Z-mediated splice defects. (A) Serial dilution assay of double mutant prp43DAmP htz1Δ. Cells were grown at 30°C in YPD + G418 liquid medium until the desired OD600 was obtained. Cells were spotted as a 10-fold dilution onto YPD + G418 plates and incubated for 2 d at 25°C, 30°C, or 37°C. (B, left) Quantification of pre-mRNA of candidate genes by RT–PCR in wild-type and prp43DAmP cells ±HTZ1. (Right) Quantification of SUS1 RT–PCR pre-mRNA and splicing intermediate containing only the second SUS1 intron. Quantification graphs represent the average of two to three independent experiments, and error bars represent the SD. (C, left) Distribution in splicing efficiencies of all ICGs upon deletion of HTZ1 in prp43DAmP cells, represented as an X–Y plot. RPGs are denoted in orange. (Right) Distribution of changes in splicing in groups of ICGs characterized by RPGs or non-RPGs and consensus or nonconsensus BPs. (cBP) Consensus BP; (ncBP) nonconsensus BP. (**) P-value < 0.01.
Overall, these results are consistent with a model in which compromised elongation leads to a splicing defect. In the case of htz1Δ, this defect contributes to defects in U2 snRNP rearrangements and downstream snRNP recruitment. Prp43 is able to recognize and disassemble spliceosomes with defective rearrangement, leading to the release of unspliced pre-mRNA in htz1Δ cells. While genes with robust splicing are refractory to these changes in the kinetics of spliceosome rearrangements, those with weak splice sites are unable to splice efficiently. These results highlight an important, albeit underappreciated, feature of cotranscriptional splicing: Compromised transcription elongation does not necessarily provide a “window of opportunity” to resolve splicing defects, but rather, kinetics of transcription elongation and splicing are optimally coordinated to promote splicing. Specific factors such as H2A.Z appear to ensure the appropriate tuning of this coordination to promote splicing for subsets of introns.
Discussion
An ever-growing body of work has established that transcription and RNA processing are spatially and temporally coordinated. Because the spliceosome acts upon nascent mRNA while the transcript is associated with the elongating polymerase, the process of splicing takes place in the context of the transcription machinery and the chromatin it engages. Here we demonstrate that the histone variant H2A.Z plays a novel role in the process of cotranscriptional splicing. Consistent with published studies from the Pleiss and Stevens laboratories (Albulescu et al. 2012; Sorenson and Stevens 2014), we found many genetic interactions between HTZ1 and genes encoding splicing factors. In particular, mutations to U2 snRNP components render cells reliant on H2A.Z for viability. Additionally, H2A.Z is necessary for optimal splicing of many endogenous ICGs, particularly when introns contain weak splice sites. Furthermore H2A.Z facilitates polymerase elongation and ensures appropriate cotranscriptional spliceosome rearrangements. Finally, decreased expression of an elongation factor or a spliceosome disassembly factor modulates the cells sensitivity to the presence of H2A.Z. Our studies support a role for H2A.Z in coordinating the processes of transcription and splicing: H2A.Z regulates transcription elongation, thereby affecting downstream spliceosome dynamics on ICGs.
H2A.Z affects kinetics of polymerase elongation
Our experiments reveal that loss of H2A.Z results in decreased polymerase occupancy across our candidate genes, suggesting that H2A.Z normally promotes RNAPII elongation (Fig. 6; Supplemental Figs. S7, S8). Although our experiments do not directly measure elongation rate, there are several lines of evidence to support a role for H2A.Z in facilitating efficient elongation. The presence of nucleosomes provides a substantial barrier to transcribing polymerase complexes, and RNAPII must overcome this barrier to access the DNA and efficiently transcribe mRNA (for review, see Petesch and Lis 2012). Because H2A.Z is less stably associated with DNA, exchange of canonical histone H2A with variant H2A.Z facilitates nucleosome eviction and helps lower this transcriptional barrier (Zhang et al. 2005; Weber et al. 2014). In fact, using an in vivo run-off assay, Santisteban et al. (2011) show that H2A.Z loss decreases the rate of elongation across the ORF of a representative gene. Similar decreases in elongation rate have been observed in mammalian systems (Rudnizky et al. 2016). Additionally, we found that CTD Ser2-P accumulates closer to the TSS and remains high throughout the body of candidate genes in htz1Δ cells (Fig. 6D; Supplemental Fig. S7B). These findings are similar to past studies that have shown transcription elongation defects correlate with increased Ser2-P. In yeast, deletion of transcription coactivator Sub1 decreases elongation rate and increases total Ser2-P (Garcia et al. 2010, 2012), while, in human cells, increased polymerase pausing leads to Ser2-P accumulation (Davidson et al. 2014), suggesting that Ser2-P levels correlate with the time RNAPII is engaged with the DNA. Therefore, increased and premature Ser2-P in htz1Δ cells may reflect polymerase elongation defects. While our results are consistent with past findings that H2A.Z loss results in slowed elongation, we cannot rule out the possibility that H2A.Z influences polymerase kinetics in additional ways, such as altered pausing, backtracking, and/or processivity. Although we did not observe physical interactions, we also cannot rule out that contact between H2A.Z and components of the splicing machinery may contribute to H2A.Z's effects on splicing. In any case, the evidence described here and elsewhere that deletion of H2A.Z negatively impacts elongation and that further compromising elongation (as in dst1Δ htz1Δ cells) further impairs splicing suggests that the kinetics of transcription and splicing are intimately coordinated and that H2A.Z is important for this coordination.
How do changes in polymerase elongation affect spliceosome dynamics?
Growing evidence supports a model in which splicing is kinetically coupled to transcription (Merkhofer et al. 2014). Several studies in yeast suggest that the polymerase pausing can be a “checkpoint” for spliceosome assembly, and splicing catalysis coincides with polymerase elongation (Alexander et al. 2010; Carrillo Oesterreich et al. 2011; Chathoth et al. 2014; Oesterreich et al. 2016). It has also been proposed that changes in polymerase elongation affect the “window of opportunity” available for nascent transcripts to be spliced, and slower elongation increases this available window (Braberg et al. 2013; Dujardin et al. 2014; Oesterreich et al. 2016). Nonetheless, the rates of spliceosome rearrangements are also finely tuned, and slow rearrangements provide the opportunity for spliceosome disassembly and release of unspliced RNAs (Koodathingal et al. 2010; Koodathingal and Staley 2013). Recent mammalian studies demonstrate that an optimal elongation rate is required for proper pre-mRNA splicing. Both increased and decreased elongation rates can alter alternative splicing and intron retention, indicating that transcription and splicing are coupled in a “Goldilocks-like phenomenon” (Fong et al. 2014). In yeast, results from splicing analyses in polymerase trigger-loop mutants show that, while splicing of some genes benefit from slowed elongation, numerous genes are more poorly spliced when the polymerase is slow (Braberg et al. 2013). Intriguingly, the combination of “slow polymerase” RNAPII mutations with deletion of H2A.Z or Swr1 renders cells very sick (Braberg et al. 2013). Additionally, we found that deletion of the general elongation factor Dst1, which can negatively impact splicing outcomes (Lacadie et al. 2006; Carey 2015), results in increased U2 association with nascent pre-mRNA, indicating that elongation defects may lead to aberrant spliceosomal rearrangements (Supplemental Fig. S8D). These observations suggest that the timing of polymerase elongation and pausing can have important implications for the fate of the RNA. H2A.Z-mediated splice defects do not entirely mimic those observed in slow polymerase mutants, suggesting that H2A.Z likely influences transcription elongation in more nuanced ways than altering rate alone. Our data suggest a model in which deletion of H2A.Z alters elongation such that the combined effects of poor splice site recognition and RNAPII elongation defects have a deleterious impact on splicing. As a result, spliceosomes are disassembled, leading to release of unspliced products and, ultimately, RNA degradation by nuclear and cytoplasmic machineries. H2A.Z helps coordinate the kinetics of transcription and splicing to ensure proper splicing outcomes.
A subset of DEAD-box and DEAH-box helicases hydrolyzes ATP to drive spliceosomal rearrangements and disassembly and has been proposed to act as “molecular clocks” (Koodathingal and Staley 2013). In particular, DEAH-box helicases Prp16, a factor that ensures splicing fidelity, and Prp43, a disassembly factor, help determine the fate of weak intron substrates when splicing is stalled. Prp16 can recognize and reversibly reject suboptimal slowly spliced substrates to either facilitate proofreading of splice sites or trigger spliceosome disassembly and subsequent degradation of unspliced transcripts (Koodathingal et al. 2010; Koodathingal and Staley 2013). Interestingly, the presence of Prp16 prevents binding of the NTR complex (Chen et al. 2013), which recruits the disassembly factor Prp43 to help mediate spliceosome disassembly. The balance of Prp16 and Prp43 therefore helps determine the fate of the nascent mRNA. Unexpectedly, despite the strong growth defect, splicing of the majority of ICGs in cells containing a hypomorphic Prp43 allele is unaffected, suggesting that decreased Prp43 expression disproportionately affects nonspliceosomal functions of Prp43 (Fig. 7B; Supplemental Fig. S9C). Indeed, Prp43 largely localizes to the nucleolus, where it has functions in ribosome biogenesis (Combs et al. 2006). However, decreased Prp43 expression partially suppresses splicing defects and preferentially improves splicing of introns containing nonconsensus BP sequences in htz1Δ cells, suggesting that decreased spliceosome disassembly allows more time for spliceosome rearrangements to occur before RNA is released (Fig. 7B,C). Consistent with these results, the Guthrie laboratory (Nissen et al. 2017) recently found that Prp43 overexpression in htz1Δ cells leads to a synthetic growth defect in S. pombe. Additionally, they show that Prp16 overexpression suppresses defective splicing caused by H2A.Z deletion (Nissen et al. 2017). It has been shown that Prp16 enables alternative branch site selection; thus, although Prp16 normally antagonizes stalled spliceosomes, excess Prp16 may protect the nascent mRNA by outcompeting disassembly factors and promoting resampling of weak splice sites (Chen et al. 2013; Semlow et al. 2016). Therefore, Prp16 overexpression is expected to have an outcome similar to that of decreased Prp43 expression, favoring splice site resampling over the discard pathway.
We propose that H2A.Z functions to coordinate the kinetics of transcription elongation and spliceosome rearrangements to promote efficient splicing. In the absence of H2A.Z, polymerase elongation is defective and therefore alters the availability of the nascent mRNA to the spliceosome, ultimately altering splicing kinetics. Prp16 and Prp43 may act as intrinsic timing mechanisms that recognize slowed or stalled spliceosomes and target them for splice site resampling or disassembly and the subsequent release of unspliced pre-mRNA. Decreased Prp43 or increased Prp16 allows for decreased reliance on H2A.Z to provide precise coordination of splicing with transcription elongation.
Materials and methods
Yeast strains, media, and DNA constructs
All S. cerevisiae strains used in this study are listed in Supplemental Table S2. Strains described in Supplemental Table S2 are in the BY4743 strain background with the exception of the Lea1-HA, Msl1-HA, and Snu114-HA strains used for ChIP, which were provided by Karla Neugebauer. All strains were propagated according to standard procedures in either YPD (1% yeast extract, 2% peptone, 2% dextrose) or the appropriate selective medium.
For deletion of HTZ1 in rrp6Δ and LG1 strains, deletion of genes at their endogenous loci was performed using standard PCR-based homologous recombination while preserving the endogenous promoters (Longtine et al. 1998; Goldstein and McCusker 1999). Deletions were confirmed by whole-cell extract and immunoblot with anti-HTZ1 (Abcam, ab4626).
For all other strains, standard methods for mating, sporulation, transformations, and tetrad analysis were used as described in Amberg et al. (2005). The genotype of each viable spore was confirmed via PCR. Plasmids used in this study are listed in Supplemental Table S3.
Generation of HTZ1 backup plasmid
The HTZ1 gene along with 450 base pairs upstream of and downstream from HTZ1 was PCR-amplified from S. cerevisiae genomics using the primers Htz1InFusion-F and Htz1InFusion-R (Supplemental Table S2). Restriction enzyme cleavage sites for HinDIII were introduced into both primers. PCR products were digested with HinDIII and cloned into pRS316 (URA3) using the InFusion Cloning HD Plus system (Clontech). Selected clones were verified by sequencing. Plasmids were transformed into htz1Δ cells, and expression of Htz1 was verified by whole-cell extract and immunoblot with anti-HTZ1 (Abcam, ab4626).
Viability assay/dilution series
For growth analysis of msl1Δ and lea1Δ strains containing a centromeric pRS316 (URA3) plasmid, strains were grown overnight in SC−URA liquid medium at 30°C. Cells were diluted to an OD600 of 0.1 in 5 mL of SC−URA medium and incubated at 30°C until all strains reached early log phase. A 10-fold serial dilution of each strain was spotted onto SC−URA plates or 5-FOA plates to select for plasmid loss and incubated at 25°C, 30°C, or 37°C. The SC−URA plates were incubated for 2 d. The 5-FOA plates were incubated for 4 d.
For growth analysis of viable double mutants, strains were grown overnight in YPD liquid medium at 30°C. Cells were diluted to an OD600 of 0.1 in 5 mL of YPD and incubated at 30°C until all strains reached early log phase. A 10-fold serial dilution of each strain was spotted onto YPD plates and incubated for 2 d at 25°C, 30°C, or 37°C. For prp43DAmP strains, cells were grown in liquid YPD + G418 and plated on YPD + G418 for growth.
RNA-seq library preparation and alignment
RNA-seq libraries were prepared using an Illumina Truseq V3 kit and ribosomal RNA depletion. Sequence reads were aligned to SacCer3 and spliced transcripts from the Ares Lab Yeast Intron Database version 3 (Grate and Ares 2002) in a single step using STAR (Dobin et al. 2013). Only the highest-scoring alignments for each read were kept, allowing for a single tie at most. Gene Expression Omnibus accession numbers are as follows: GSE97416 and GSE94404:GSM2474880 (for wild-type replicate #2).
RNA-seq RPKM and splicing efficiency calculation
RPKMs were computed for each gene by dividing the total number of reads that aligned entirely within the gene's exon boundaries by the gene's total exon length in kilobase pairs per million mapped reads. Reads within ICGs were categorized as exonic, spliced, or unspliced. Exonic reads were those that mapped entirely within a single exon, as defined by the Ares Lab Yeast Intron Database. Spliced reads were those that aligned with a gap that corresponded to an annotated intron, and unspliced reads mapped partially within an exon and partially within an intron with no gap. Spliced and unspliced read counts were normalized by dividing each count value by the number of unique alignment positions that were able to contribute to the total. For spliced reads, this normalization value was the length of the read minus 1 for every intron. For unspliced read counts, this was the length of the intron plus the read length minus 1. Splicing efficiency for each intron was calculated as normalized spliced counts divided by the sum of the normalized spliced and normalized unspliced counts.
RT–PCR analysis and quantification
Cells were grown in YPD medium to an OD600 between 0.4 and 0.7. For prp43DAmP strains, cells were grown in YPD + G418. Total RNA was isolated from 10 mL of cells using a hot phenol extraction method and dissolved in 100 µL of diethylpyrocarbonate (DEPC)-treated water. Ten micrograms to 20 µg of RNA was DNase-treated (Roche), and treated RNA concentration was measured by spectrophotometer. Two micrograms to 4 µg of RNA was used to make cDNA using the Maxima first strand cDNA synthesis kit (Fermentas). cDNA was diluted 1:20 and used for PCR. To detect splicing isoforms, primers flanking the intronic sequences were used for 27-cycle PCR using 1 µL of diluted cDNA. PCR products were diluted 1:5 and run on a 6% TBE polyacrylamide gel. SUS1 products were run on an 8% TBE polyacrylamide gel. Gels were stained with SYBR Green (Sigma), and images were captured using Image Lab (Bio-Rad). Bands were quantified as percent total of band intensity using Image Lab software.
ChIP-seq analysis
ChIP-seq reads were obtained from Gu et al. (2015) and converted to FastQ format using the NCBI Sequence Read Archive (SRA) toolkit. Contaminating adapter sequences were trimmed, and Bowtie2 was used to align the FastQ reads of two replicates to sacCer3 with only one reported alignment (-k 1). Genomic track files from immunoprecipitation and input alignments were created using SAMTools, BEDTools, and the University of California at Santa Cruz bedgraphToBigWig utility. After the input and immunoprecipitation pileup tracks were normalized for differential read count, a ratio track was created by dividing the normalized immunoprecipitation track by the normalized input track.
Metagenes and heat maps were plotted using the R package seqPlots (http://github.com/przemol/seqplots). For metagenes, transcripts were scaled to 1000 nucleotides (nt) between the TSS and transcription termination site (TTS). For metagenes across ORFs, transcripts were scaled to 1000 nt between the TSS and TTS. Metagenes were also plotted for 600 nt upstream of the TSS as well as 600 nt downstream from the TTS and scaled 1:1. Heat maps were plotted of fixed distances upstream of and downstream from TSS, BP, and 3′SS sequences, separately for intron-containing RPGs and non-RPGs.
ChIP and quantitative PCR
Cells were grown in YPD to an OD600 between 0.5 and 0.7 and then cross-linked for 15 min at room temperature with formaldehyde to a final concentration of 1%. Cross-linking was quenched for 5 min at room temperature with glycine to a final concentration of 125 mM. Cells were disrupted with 0.5-mm glass beads for 40 min at 4°C. To shear chromatin for Msl1 samples, lysates were sonicated for a total of 3 min and 20 sec at 15% intensity (10 sec on and 15 sec off on ice). For all other samples, lysates were sonicated for a total of 2 min and 30 sec. After sonication, lysates were cleared by centrifugation. For Msl1, Prp42, and Snu114, samples were then used for immunoprecipitation with anti-HA Y11 (Santa Cruz Biotechnology). For Rpb3 and Ser2 samples, samples were used for immunoprecipitation with anti-Rpb3 (BioLegend) and anti-phospho-S2 (Abcam), respectively. After immunoprecipitation, samples were washed and incubated overnight at 65°C to reverse cross-linking.
All samples were incubated with Proteinase K (Sigma) and RNase A (Ambion) followed by purification using a PCR product purification kit (Qiagen).
DNA samples were then analyzed by real-time PCR. Input DNA was diluted 1:10, and 1 µL of this was used in a 20-µL (for Msl1 and Prp42) or 10-µL (for Snu114, Ser-2, and Rpb3) reaction volume. For ChIP DNA, samples were diluted 1:2, and 1 µL of this was used in a 20- or 10-µL reaction volume. Reactions consisted of 1× Perfecta SYBR Green master mix (Quanta Biosciences) and 0.5 µL of primers. Real-time PCR was performed using a CFX96 touch system (Bio-Rad). All samples were run in technical duplicate for each independent experiment.
For quantification, standard curves were generated for each primer set, and DNA concentration for each input and ChIP sample was calculated. ChIP values were divided by the input, and these values were divided by the nontranscribed control and expressed as fold accumulation over the nontranscribed control. Reported values are averages of three or more independent experiments, and error bars represent the standard error of the mean.
Supplementary Material
Acknowledgments
This work was supported by grants to T.L.J. from the National Institute of General Medical Sciences (GM-085474 and U01 HG007912), and grants to T.L.K. from the Research Corporation for the Advancement of Science (Cottrell College Science award no. 20186) and the National Institutes of Health (R15GM122026). This work was also supported by the Cellular and Molecular Biology Training Program Ruth L. Kirschstein National Research Service Award (GM007185) (awarded to L.T.N.) and the Whitcome Predoctoral Fellowship in Molecular Biology (awarded to L.T.N. and S.V.). We also acknowledge support from a Quantitative and Computational Biosciences (QCB) Collaboratory Post-doctoral Fellowship (awarded to R.S.) and the OCB Collaborator community, directed by Matteo Pellegrini. We acknowledge Dr. Alexander Hoffmann for providing mentorship to R.S.
Footnotes
Supplemental material is available for this article.
Article is online at http://www.genesdev.org/cgi/doi/10.1101/gad.295188.116.
References
- Albulescu LO, Sabet N, Gudipati M, Stepankiw N, Bergman ZJ, Huffaker TC, Pleiss JA. 2012. A quantitative, high-throughput reverse genetic screen reveals novel connections between Pre-mRNA splicing and 5′ and 3′ end transcript determinants. PLoS Genet 8: e1002530. [DOI] [PMC free article] [PubMed] [Google Scholar]
- Alexander RD, Innocente SA, Barrass JD, Beggs JD. 2010. Splicing-dependent RNA polymerase pausing in yeast. Mol Cell 40: 582–593. [DOI] [PMC free article] [PubMed] [Google Scholar]
- Allepuz-Fuster P, Martinez-Fernandez V, Garrido-Godino AI, Alonso-Aguado S, Hanes SD, Navarro F, Calvo O. 2014. Rpb4/7 facilitates RNA polymerase II CTD dephosphorylation. Nucleic Acids Res 42: 13674–13688. [DOI] [PMC free article] [PubMed] [Google Scholar]
- Amberg DC, Burke D, Strathern J. 2005. Methods in yeast genetics: a Cold Spring Harbor Laboratory course manual. Cold Spring Harbor Laboratory Press, Cold Spring Harbor, NY. [Google Scholar]
- Amit M, Donyo M, Hollander D, Goren A, Kim E, Gelfman S, Lev-Maor G, Burstein D, Schwartz S, Postolsky B, et al. 2012. Differential GC content between exons and introns establishes distinct strategies of splice-site recognition. Cell Rep 1: 543–556. [DOI] [PubMed] [Google Scholar]
- Arenas JE, Abelson JN. 1997. Prp43: an RNA helicase-like factor involved in spliceosome disassembly. Proc Natl Acad Sci 94: 11798–11802. [DOI] [PMC free article] [PubMed] [Google Scholar]
- Bauren G, Wieslander L. 1994. Splicing of Balbiani ring 1 gene pre-mRNA occurs simultaneously with transcription. Cell 76: 183–192. [DOI] [PubMed] [Google Scholar]
- Bauren G, Jiang WQ, Bernholm K, Gu F, Wieslander L. 1996. Demonstration of a dynamic, transcription-dependent organization of pre-mRNA splicing factors in polytene nuclei. J Cell Biol 133: 929–941. [DOI] [PMC free article] [PubMed] [Google Scholar]
- Beyer AL, Osheim YN. 1988. Splice site selection, rate of splicing, and alternative splicing on nascent transcripts. Genes Dev 2: 754–765. [DOI] [PubMed] [Google Scholar]
- Beyer AL, Osheim YN. 1991. Visualization of RNA transcription and processing. Semin Cell Biol 2: 131–140. [PubMed] [Google Scholar]
- Bousquet-Antonelli C, Presutti C, Tollervey D. 2000. Identification of a regulated pathway for nuclear pre-mRNA turnover. Cell 102: 765–775. [DOI] [PubMed] [Google Scholar]
- Braberg H, Jin H, Moehle EA, Chan YA, Wang S, Shales M, Benschop JJ, Morris JH, Qiu C, Hu F, et al. 2013. From structure to systems: high-resolution, quantitative genetic analysis of RNA polymerase II. Cell 154: 775–788. [DOI] [PMC free article] [PubMed] [Google Scholar]
- Brown SJ, Stoilov P, Xing Y. 2012. Chromatin and epigenetic regulation of pre-mRNA processing. Hum Mol Genet 21: R90–R96. [DOI] [PMC free article] [PubMed] [Google Scholar]
- Carey LB. 2015. RNA polymerase errors cause splicing defects and can be regulated by differential expression of RNA polymerase subunits. Elife 4: e09945. [DOI] [PMC free article] [PubMed] [Google Scholar]
- Carrillo Oesterreich F, Preibisch S, Neugebauer KM. 2010. Global analysis of nascent RNA reveals transcriptional pausing in terminal exons. Mol Cell 40: 571–581. [DOI] [PubMed] [Google Scholar]
- Carrillo Oesterreich F, Bieberstein N, Neugebauer KM. 2011. Pause locally, splice globally. Trends Cell Biol 21: 328–335. [DOI] [PubMed] [Google Scholar]
- Chathoth KT, Barrass JD, Webb S, Beggs JD. 2014. A splicing-dependent transcriptional checkpoint associated with prespliceosome formation. Mol Cell 53: 779–790. [DOI] [PMC free article] [PubMed] [Google Scholar]
- Chen HC, Cheng SC. 2012. Functional roles of protein splicing factors. Biosci Rep 32: 345–359. [DOI] [PMC free article] [PubMed] [Google Scholar]
- Chen HC, Tseng CK, Tsai RT, Chung CS, Cheng SC. 2013. Link of NTR-mediated spliceosome disassembly with DEAH-box ATPases Prp2, Prp16, and Prp22. Mol Cell Biol 33: 514–525. [DOI] [PMC free article] [PubMed] [Google Scholar]
- Churchman LS, Weissman JS. 2011. Nascent transcript sequencing visualizes transcription at nucleotide resolution. Nature 469: 368–373. [DOI] [PMC free article] [PubMed] [Google Scholar]
- Combs DJ, Nagel RJ, Ares M Jr, Stevens SW. 2006. Prp43p is a DEAH-box spliceosome disassembly factor essential for ribosome biogenesis. Mol Cell Biol 26: 523–534. [DOI] [PMC free article] [PubMed] [Google Scholar]
- Davidson L, Muniz L, West S. 2014. 3′ end formation of pre-mRNA and phosphorylation of Ser2 on the RNA polymerase II CTD are reciprocally coupled in human cells. Genes Dev 28: 342–356. [DOI] [PMC free article] [PubMed] [Google Scholar]
- de la Mata M, Alonso CR, Kadener S, Fededa JP, Blaustein M, Pelisch F, Cramer P, Bentley D, Kornblihtt AR. 2003. A slow RNA polymerase II affects alternative splicing in vivo. Mol Cell 12: 525–532. [DOI] [PubMed] [Google Scholar]
- Dobin A, Davis CA, Schlesinger F, Drenkow J, Zaleski C, Jha S, Batut P, Chaisson M, Gingeras TR. 2013. STAR: ultrafast universal RNA-seq aligner. Bioinformatics 29: 15–21. [DOI] [PMC free article] [PubMed] [Google Scholar]
- Dujardin G, Kornblihtt AR, Corcos L. 2014. [Kinetic regulation of pre-messenger RNA alternative splicing]. Med Sci (Paris) 30: 940–943. [DOI] [PubMed] [Google Scholar]
- Fong N, Kim H, Zhou Y, Ji X, Qiu J, Saldi T, Diener K, Jones K, Fu XD, Bentley DL. 2014. Pre-mRNA splicing is facilitated by an optimal RNA polymerase II elongation rate. Genes Dev 28: 2663–2676. [DOI] [PMC free article] [PubMed] [Google Scholar]
- Freedman MS, Kaplan JM, Markovic-Plese S. 2013. Insights into the mechanisms of the therapeutic efficacy of alemtuzumab in multiple sclerosis. J Clin Cell Immunol 4: 1000152. [PMC free article] [PubMed] [Google Scholar]
- Garcia A, Rosonina E, Manley JL, Calvo O. 2010. Sub1 globally regulates RNA polymerase II C-terminal domain phosphorylation. Mol Cell Biol 30: 5180–5193. [DOI] [PMC free article] [PubMed] [Google Scholar]
- Garcia A, Collin A, Calvo O. 2012. Sub1 associates with Spt5 and influences RNA polymerase II transcription elongation rate. Mol Biol Cell 23: 4297–4312. [DOI] [PMC free article] [PubMed] [Google Scholar]
- Ghavi-Helm Y, Michaut M, Acker J, Aude JC, Thuriaux P, Werner M, Soutourina J. 2008. Genome-wide location analysis reveals a role of TFIIS in RNA polymerase III transcription. Genes Dev 22: 1934–1947. [DOI] [PMC free article] [PubMed] [Google Scholar]
- Goldstein AL, McCusker JH. 1999. Three new dominant drug resistance cassettes for gene disruption in Saccharomyces cerevisiae. Yeast (Chichester, England) 15: 1541–1553. [DOI] [PubMed] [Google Scholar]
- Gornemann J, Kotovic KM, Hujer K, Neugebauer KM. 2005. Cotranscriptional spliceosome assembly occurs in a stepwise fashion and requires the cap binding complex. Mol Cell 19: 53–63. [DOI] [PubMed] [Google Scholar]
- Gottschalk A, Bartels C, Neubauer G, Luhrmann R, Fabrizio P. 2001. A novel yeast U2 snRNP protein, Snu17p, is required for the first catalytic step of splicing and for progression of spliceosome assembly. Mol Cell Biol 21: 3037–3046. [DOI] [PMC free article] [PubMed] [Google Scholar]
- Grate L, Ares M Jr. 2002. Searching yeast intron data at Ares lab Web site. Methods Enzymol 350: 380–392. [DOI] [PubMed] [Google Scholar]
- Gu M, Naiyachit Y, Wood TJ, Millar CB. 2015. H2A.Z marks antisense promoters and has positive effects on antisense transcript levels in budding yeast. BMC Genomics 16: 99. [DOI] [PMC free article] [PubMed] [Google Scholar]
- Guillemette B, Bataille AR, Gevry N, Adam M, Blanchette M, Robert F, Gaudreau L. 2005. Variant histone H2A.Z is globally localized to the promoters of inactive yeast genes and regulates nucleosome positioning. PLoS Biol 3: e384. [DOI] [PMC free article] [PubMed] [Google Scholar]
- Gunderson FQ, Johnson TL. 2009. Acetylation by the transcriptional coactivator Gcn5 plays a novel role in co-transcriptional spliceosome assembly. PLoS Genet 5: e1000682. [DOI] [PMC free article] [PubMed] [Google Scholar]
- Gunderson FQ, Merkhofer EC, Johnson TL. 2011. Dynamic histone acetylation is critical for cotranscriptional spliceosome assembly and spliceosomal rearrangements. Proc Natl Acad Sci 108: 2004–2009. [DOI] [PMC free article] [PubMed] [Google Scholar]
- Guo R, Zheng L, Park JW, Lv R, Chen H, Jiao F, Xu W, Mu S, Wen H, Qiu J, et al. 2014. BS69/ZMYND11 reads and connects histone H3.3 lysine 36 trimethylation-decorated chromatin to regulated pre-mRNA processing. Mol Cell 56: 298–310. [DOI] [PMC free article] [PubMed] [Google Scholar]
- Hossain MA, Claggett JM, Nguyen T, Johnson TL. 2009. The cap binding complex influences H2B ubiquitination by facilitating splicing of the SUS1 pre-mRNA. RNA 15: 1515–1527. [DOI] [PMC free article] [PubMed] [Google Scholar]
- Hossain MA, Rodriguez CM, Johnson TL. 2011. Key features of the two-intron Saccharomyces cerevisiae gene SUS1 contribute to its alternative splicing. Nucleic Acids Res 39: 8612–8627. [DOI] [PMC free article] [PubMed] [Google Scholar]
- Howe KJ, Kane CM, Ares M Jr. 2003. Perturbation of transcription elongation influences the fidelity of internal exon inclusion in Saccharomyces cerevisiae. RNA 9: 993–1006. [DOI] [PMC free article] [PubMed] [Google Scholar]
- Hsin JP, Manley JL. 2012. The RNA polymerase II CTD coordinates transcription and RNA processing. Genes Dev 26: 2119–2137. [DOI] [PMC free article] [PubMed] [Google Scholar]
- Huang S, Spector DL. 1996. Intron-dependent recruitment of pre-mRNA splicing factors to sites of transcription. J Cell Biol 133: 719–732. [DOI] [PMC free article] [PubMed] [Google Scholar]
- Kawashima T, Douglass S, Gabunilas J, Pellegrini M, Chanfreau GF. 2014. Widespread use of non-productive alternative splice sites in Saccharomyces cerevisiae. PLoS Genet 10: e1004249. [DOI] [PMC free article] [PubMed] [Google Scholar]
- Kobor MS, Venkatasubrahmanyam S, Meneghini MD, Gin JW, Jennings JL, Link AJ, Madhani HD, Rine J. 2004. A protein complex containing the conserved Swi2/Snf2-related ATPase Swr1p deposits histone variant H2A.Z into euchromatin. PLoS Biol 2: E131. [DOI] [PMC free article] [PubMed] [Google Scholar]
- Komarnitsky P, Cho EJ, Buratowski S. 2000. Different phosphorylated forms of RNA polymerase II and associated mRNA processing factors during transcription. Gene Dev 14: 2452–2460. [DOI] [PMC free article] [PubMed] [Google Scholar]
- Koodathingal P, Staley JP. 2013. Splicing fidelity DEAD/H-box ATPases as molecular clocks. RNA Biol 10: 1073–1079. [DOI] [PMC free article] [PubMed] [Google Scholar]
- Koodathingal P, Novak T, Piccirilli JA, Staley JP. 2010. The DEAH box ATPases Prp16 and Prp43 cooperate to proofread 5′ splice site cleavage during pre-mRNA splicing. Mol Cell 39: 385–395. [DOI] [PMC free article] [PubMed] [Google Scholar]
- Kotovic KM, Lockshon D, Boric L, Neugebauer KM. 2003. Cotranscriptional recruitment of the U1 snRNP to intron-containing genes in yeast. Mol Cell Biol 23: 5768–5779. [DOI] [PMC free article] [PubMed] [Google Scholar]
- Krogan NJ, Keogh MC, Datta N, Sawa C, Ryan OW, Ding H, Haw RA, Pootoolal J, Tong A, Canadien V, et al. 2003. A Snf2 family ATPase complex required for recruitment of the histone H2A variant Htz1. Mol Cell 12: 1565–1576. [DOI] [PubMed] [Google Scholar]
- Lacadie SA, Rosbash M. 2005. Cotranscriptional spliceosome assembly dynamics and the role of U1 snRNA:5′ss base pairing in yeast. Mol Cell 19: 65–75. [DOI] [PubMed] [Google Scholar]
- Lacadie SA, Tardiff DF, Kadener S, Rosbash M. 2006. In vivo commitment to yeast cotranscriptional splicing is sensitive to transcription elongation mutants. Genes Dev 20: 2055–2066. [DOI] [PMC free article] [PubMed] [Google Scholar]
- Larimer FW, Stevens A. 1990. Disruption of the gene XRN1, coding for a 5′ → 3′ exoribonuclease, restricts yeast cell growth. Gene 95: 85–90. [DOI] [PubMed] [Google Scholar]
- Leeds NB, Small EC, Hiley SL, Hughes TR, Staley JP. 2006. The splicing factor Prp43p, a DEAH box ATPase, functions in ribosome biogenesis. Mol Cell Biol 26: 513–522. [DOI] [PMC free article] [PubMed] [Google Scholar]
- Li Z, Gadue P, Chen K, Jiao Y, Tuteja G, Schug J, Li W, Kaestner KH. 2012. Foxa2 and H2A.Z mediate nucleosome depletion during embryonic stem cell differentiation. Cell 151: 1608–1616. [DOI] [PMC free article] [PubMed] [Google Scholar]
- Listerman I, Sapra AK, Neugebauer KM. 2006. Cotranscriptional coupling of splicing factor recruitment and precursor messenger RNA splicing in mammalian cells. Nat Struct Mol Biol 13: 815–822. [DOI] [PubMed] [Google Scholar]
- Longtine MS, McKenzie A III, Demarini DJ, Shah NG, Wach A, Brachat A, Philippsen P, Pringle JR. 1998. Additional modules for versatile and economical PCR-based gene deletion and modification in Saccharomyces cerevisiae. Yeast (Chichester, England) 14: 953–961. [DOI] [PubMed] [Google Scholar]
- Luco RF, Pan Q, Tominaga K, Blencowe BJ, Pereira-Smith OM, Misteli T. 2010. Regulation of alternative splicing by histone modifications. Science 327: 996–1000. [DOI] [PMC free article] [PubMed] [Google Scholar]
- Malagon F, Tong AH, Shafer BK, Strathern JN. 2004. Genetic interactions of DST1 in Saccharomyces cerevisiae suggest a role of TFIIS in the initiation-elongation transition. Genetics 166: 1215–1227. [DOI] [PMC free article] [PubMed] [Google Scholar]
- Malik I, Qiu C, Snavely T, Kaplan CD. 2017. Wide-ranging and unexpected consequences of altered Pol II catalytic activity in vivo. Nucleic Acids Res 10.1093/nar/gkx037. [DOI] [PMC free article] [PubMed] [Google Scholar]
- Maniatis T, Reed R. 2002. An extensive network of coupling among gene expression machines. Nature 416: 499–506. [DOI] [PubMed] [Google Scholar]
- Mason PB, Struhl K. 2005. Distinction and relationship between elongation rate and processivity of RNA polymerase II in vivo. Mol Cell 17: 831–840. [DOI] [PubMed] [Google Scholar]
- Merkhofer EC, Hu P, Johnson TL. 2014. Introduction to cotranscriptional RNA splicing. Methods Mol Biology 1126: 83–96. [DOI] [PMC free article] [PubMed] [Google Scholar]
- Mizuguchi G, Shen X, Landry J, Wu WH, Sen S, Wu C. 2004. ATP-driven exchange of histone H2AZ variant catalyzed by SWR1 chromatin remodeling complex. Science 303: 343–348. [DOI] [PubMed] [Google Scholar]
- Moehle EA, Ryan CJ, Krogan NJ, Kress TL, Guthrie C. 2012. The yeast SR-like protein Npl3 links chromatin modification to mRNA processing. PLoS Genet 8: e1003101. [DOI] [PMC free article] [PubMed] [Google Scholar]
- Munding EM, Shiue L, Katzman S, Donohue JP, Ares M Jr. 2013. Competition between pre-mRNAs for the splicing machinery drives global regulation of splicing. Mol Cell 51: 338–348. [DOI] [PMC free article] [PubMed] [Google Scholar]
- Naftelberg S, Schor IE, Ast G, Kornblihtt AR. 2015. Regulation of alternative splicing through coupling with transcription and chromatin structure. Annu Rev Biochem 84: 165–198. [DOI] [PubMed] [Google Scholar]
- Nissen KE, Homer CM, Ryan CJ, Shales M, Krogan NJ, Patrick KL, Guthrie C. 2017. The histone variant H2A.Z promotes splicing of weak introns. Genes Dev (this issue). 10.1101/gad.295287.116. [DOI] [PMC free article] [PubMed] [Google Scholar]
- Oesterreich FC, Herzel L, Straube K, Hujer K, Howard J, Neugebauer KM. 2016. Splicing of nascent RNA coincides with intron exit from RNA polymerase II. Cell 165: 372–381. [DOI] [PMC free article] [PubMed] [Google Scholar]
- Ono B, Yoshida R, Kamiya K, Sugimoto T. 2005. Suppression of termination mutations caused by defects of the NMD machinery in Saccharomyces cerevisiae. Genes Genet Syst 80: 311–316. [DOI] [PubMed] [Google Scholar]
- Petesch SJ, Lis JT. 2012. Overcoming the nucleosome barrier during transcript elongation. Trends Genet 28: 285–294. [DOI] [PMC free article] [PubMed] [Google Scholar]
- Raisner RM, Hartley PD, Meneghini MD, Bao MZ, Liu CL, Schreiber SL, Rando OJ, Madhani HD. 2005. Histone variant H2A.Z marks the 5′ ends of both active and inactive genes in euchromatin. Cell 123: 233–248. [DOI] [PMC free article] [PubMed] [Google Scholar]
- Ranjan A, Mizuguchi G, FitzGerald PC, Wei D, Wang F, Huang Y, Luk E, Woodcock CL, Wu C. 2013. Nucleosome-free region dominates histone acetylation in targeting SWR1 to promoters for H2A.Z replacement. Cell 154: 1232–1245. [DOI] [PMC free article] [PubMed] [Google Scholar]
- Rege M, Subramanian V, Zhu C, Hsieh TH, Weiner A, Friedman N, Clauder-Munster S, Steinmetz LM, Rando OJ, Boyer LA, et al. 2015. Chromatin dynamics and the RNA exosome function in concert to regulate transcriptional homeostasis. Cell Rep 13: 1610–1622. [DOI] [PMC free article] [PubMed] [Google Scholar]
- Rudnizky S, Bavly A, Malik O, Pnueli L, Melamed P, Kaplan A. 2016. H2A.Z controls the stability and mobility of nucleosomes to regulate expression of the LH genes. Nat Commun 7: 12958. [DOI] [PMC free article] [PubMed] [Google Scholar]
- Sadeghi L, Bonilla C, Stralfors A, Ekwall K, Svensson JP. 2011. Podbat: a novel genomic tool reveals Swr1-independent H2A.Z incorporation at gene coding sequences through epigenetic meta-analysis. PLoS Comput Biol 7: e1002163. [DOI] [PMC free article] [PubMed] [Google Scholar]
- Saldi T, Cortazar MA, Sheridan RM, Bentley DL. 2016. Coupling of RNA Polymerase II Transcription Elongation with Pre-mRNA Splicing. J Mol Biol 428: 2623–2635. [DOI] [PMC free article] [PubMed] [Google Scholar]
- Santisteban MS, Kalashnikova T, Smith MM. 2000. Histone H2A.Z regulates transcription and is partially redundant with nucleosome remodeling complexes. Cell 103: 411–422. [DOI] [PubMed] [Google Scholar]
- Santisteban MS, Hang M, Smith MM. 2011. Histone variant H2A.Z and RNA polymerase II transcription elongation. Mol Cell Biol 31: 1848–1860. [DOI] [PMC free article] [PubMed] [Google Scholar]
- Sayani S, Chanfreau GF. 2012. Sequential RNA degradation pathways provide a fail-safe mechanism to limit the accumulation of unspliced transcripts in Saccharomyces cerevisiae. RNA 18: 1563–1572. [DOI] [PMC free article] [PubMed] [Google Scholar]
- Schwartz S, Meshorer E, Ast G. 2009. Chromatin organization marks exon–intron structure. Nat Struct Mol Biol 16: 990–995. [DOI] [PubMed] [Google Scholar]
- Semlow DR, Blanco MR, Walter NG, Staley JP. 2016. Spliceosomal DEAH-Box ATPases remodel pre-mRNA to activate alternative splice sites. Cell 164: 985–998. [DOI] [PMC free article] [PubMed] [Google Scholar]
- Sims RJ III, Millhouse S, Chen CF, Lewis BA, Erdjument-Bromage H, Tempst P, Manley JL, Reinberg D. 2007. Recognition of trimethylated histone H3 lysine 4 facilitates the recruitment of transcription postinitiation factors and pre-mRNA splicing. Mol Cell 28: 665–676. [DOI] [PMC free article] [PubMed] [Google Scholar]
- Sorenson MR, Stevens SW. 2014. Rapid identification of mRNA processing defects with a novel single-cell yeast reporter. RNA 20: 732–745. [DOI] [PMC free article] [PubMed] [Google Scholar]
- Sorenson MR, Jha DK, Ucles SA, Flood DM, Strahl BD, Stevens SW, Kress TL. 2016. Histone H3K36 methylation regulates pre-mRNA splicing in Saccharomyces cerevisiae. RNA Biol 13: 412–426. [DOI] [PMC free article] [PubMed] [Google Scholar]
- Spingola M, Ares M Jr. 2000. A yeast intronic splicing enhancer and Nam8p are required for Mer1p-activated splicing. Mol Cell 6: 329–338. [DOI] [PubMed] [Google Scholar]
- Subramanian V, Fields PA, Boyer LA. 2015. H2A.Z: a molecular rheostat for transcriptional control. F1000Prime Rep 7: 01. [DOI] [PMC free article] [PubMed] [Google Scholar]
- Tang J, Abovich N, Rosbash M. 1996. Identification and characterization of a yeast gene encoding the U2 small nuclear ribonucleoprotein particle B′′ protein. Mol Cell Biol 16: 2787–2795. [DOI] [PMC free article] [PubMed] [Google Scholar]
- Tardiff DF, Rosbash M. 2006. Arrested yeast splicing complexes indicate stepwise snRNP recruitment during in vivo spliceosome assembly. RNA 12: 968–979. [DOI] [PMC free article] [PubMed] [Google Scholar]
- Tolstorukov MY, Goldman JA, Gilbert C, Ogryzko V, Kingston RE, Park PJ. 2012. Histone variant H2A.Bbd is associated with active transcription and mRNA processing in human cells. Mol Cell 47: 596–607. [DOI] [PMC free article] [PubMed] [Google Scholar]
- Tramantano M, Sun L, Au C, Labuz D, Liu Z, Chou M, Shen C, Luk E. 2016. Constitutive turnover of histone H2A.Z at yeast promoters requires the preinitiation complex. Elife 5: e14243. [DOI] [PMC free article] [PubMed] [Google Scholar]
- Wan Y, Saleem RA, Ratushny AV, Roda O, Smith JJ, Lin CH, Chiang JH, Aitchison JD. 2009. Role of the histone variant H2A.Z/Htz1p in TBP recruitment, chromatin dynamics, and regulated expression of oleate-responsive genes. Mol Cell Biol 29: 2346–2358. [DOI] [PMC free article] [PubMed] [Google Scholar]
- Weber CM, Henikoff JG, Henikoff S. 2010. H2A.Z nucleosomes enriched over active genes are homotypic. Nat Struct Mol Biol 17: 1500–1507. [DOI] [PMC free article] [PubMed] [Google Scholar]
- Weber CM, Ramachandran S, Henikoff S. 2014. Nucleosomes are context-specific, H2A.Z-modulated barriers to RNA polymerase. Mol Cell 53: 819–830. [DOI] [PubMed] [Google Scholar]
- Zhang H, Roberts DN, Cairns BR. 2005. Genome-wide dynamics of Htz1, a histone H2A variant that poises repressed/basal promoters for activation through histone loss. Cell 123: 219–231. [DOI] [PMC free article] [PubMed] [Google Scholar]
- Zlatanova J, Thakar A. 2008. H2A.Z: view from the top. Structure 16: 166–179. [DOI] [PubMed] [Google Scholar]
Associated Data
This section collects any data citations, data availability statements, or supplementary materials included in this article.