

Abstract
Bladder cancer is one of the most prevalent cancers worldwide, and increasing research has focused on new technologies for early detection of bladder cancer. For example, proteomic techniques for biomarker discovery have been implemented for the detection and analysis of protein changes in the tissues, blood, and urine from bladder cancer patients. In this present study, we evaluated the effectiveness of the eight-plex iTRAQ labeling and quantitative proteomic approaches for differentially analyzing proteins found in normal and bladder cancer tissues from individual patients. This study obtained 1627 identified and quantified proteins, and detected significant changes of expression in 35 proteins. In addition, both mass spectrometry and Western Blot results indicated that scaffold attachment factor B (SafB) and GTPase RAN binding protein 1 (RanBP1) were up-regulated in low-grade bladder cancer tissues. Overall, this study suggests that these two proteins are potential candidates as predictive and diagnostic biomarkers and that they may be potentially used as the therapeutic targets for drug discovery.
Keywords: Bladder cancer, eight-plex iTRAQ labeling, scaffold attachment factor B (SafB), RAN binding protein 1 (RanBP1)
Introduction
In the United States, bladder cancer is the fourth most common malignancy among men and the eighth cause of death in males. Unfortunately, there are 73,510 new cases diagnosed each year, and 14,880 deaths per year [1]. In clinical studies, 75% of patients with bladder cancer have the disease confined to the mucosa (pTis, pTa and pT1) of which 20% are muscle infiltrating (pT2-pT4) and 5% are metastatic at the time of diagnosis [2]. Early diagnosis of bladder cancer increases the five-year survival rate to about 88%. New procedures are needed for earlier detection of bladder cancer. At present, cytological analysis and cystoscopy are commonly used detection methods, however they have disadvantages. For example, although cytological analysis is a noninvasive detection method for bladder cancer, it has poor sensitivity and specificity for detecting early low-grade bladder tumors. Cystoscopy is also disadvantageous because of its invasive nature and expense [3-7]. These techniques identified several candidate markers in the urine and/or bladder cancer cells of bladder cancer patients which were used for the initial diagnosis and for monitoring recurrences and treatment responses [3,6,8-14]; however, it is important to note that these markers are not superior to existing detection methods in terms of sensitivity or specificity. Thus, there is a compelling need to find more reliable bladder cancer markers for the diagnosis and monitoring of bladder cancer.
To a certain extent, quantitative proteomics has distinct advantages compare with cytological analysis and cystoscopy studies because the protein is responsible for the ultimate malignant phenotype. Mass spectrometry (MS) based protein expression has been applied to identify new biomarkers for cancers such as prostate, breast and pancreatic cancers. Isobaric tags for relative and absolute quantification (iTRAQ) was developed by Applied Biosystems Incorporation in 2004 [15,16]. With the eight-plex iTRAQ reagents, multiple samples can be quantitatively analyzed simultaneously under the same experimental conditions [17-19]. This unique approach labels samples with eight independent isobaric tags of the same mass that, upon fragmentation in MS/MS, result in eight unique reporter ions (m/z from 113 to 121). Therefore, the same peptides of the proteins from different specimens labeled with these reagents appear as an individual species in a MS scan. However, upon fragmentation of the peptide, each label releases a unique reporter ion that can be measured in a MS/MS scan. The peak area for the reporter ions provides relative quantitation of the peptide contained in the eight different samples. The use of isobaric tags for relative and absolute quantitation (iTRAQ) combined with multidimensional liquid chromatography (LC) and MS analysis is emerging as a powerful method to search for specific cancer biomarkers.
Here, we applied the eight-plex iTRAQ-labeling and nano-LC-MS/MS technologies to discover differentially expressed proteins between bladder cancer and non-tumor (NT) control tissues from the individuals with disease. A total of 1627 proteins were identified and quantified, and there were 35 significantly changed proteins with a p-value <0.05 between bladder cancer and normal tissues. The up-regulated proteins SafB and RanBP1 in bladder cancer tissues were further validated by Western Blot analyses and found to be potential candidates for early detection or for the stage differentiation of bladder cancer.
Materials and methods
Clinical specimens
Tissues from tumors and from adjacent normal regions (controls) were collected from patients diagnosed with bladder cancer at Tongji Hospital, Shanghai, China. The study protocol was approved by the Medical Ethics and Human Clinical Trial Committee of Tongji Hospital. All of the tissue samples were pathologically confirmed as papillary urothelial carcinoma (PUC) according to the WHO/ISUP classification of urothelial carcinomas, 2004. The samples were washed 3 times with ice-cold PBS to remove blood and stored in liquid nitrogen. Table 1 lists the diagnosis, sex, and other clinical sample information for the patient samples.
Table 1.
Clinic parameters of the bladder cancer patients
| No. of patient | Age (year) | Gender | Stage | Tumor sample/iTRAQ reagent | Control sample/iTRAQ reagent |
|---|---|---|---|---|---|
| 110 | 72 | Male | T0M0N0 | T110/iTRAQ-118 | C110/iTRAQ-114 |
| 112 | 60 | Male | T0M0N0 | T112/iTRAQ-119 | C112/iTRAQ-115 |
| 123 | 75 | Male | T0M0N0 | T123/iTRAQ-121 | C123/iTRAQ-116 |
| 101 | 64 | Male | T0M0N0 | T101 (WB) | C101 (WB) |
| 113 | 78 | Male | T0M0N0 | T113 (WB) | C113 (WB) |
Notes: Papillary urothelial carcinoma, low grade. M1, Mt: mixed sample of T110, C110, T112, C112, T123, C123 in equal protein amount.
Sample preparation
Human bladder tissues from donors were lysed as described [20]. Briefly, each tissue was added to SDT-lysis buffer (2% SDS, 0.1 M DTT, 0.1 M Tris-HCl, pH=7.6), at a buffer to tissue ratio of 10:1 (v/w). After homogenization for 3 minutes, the mixture was incubated in boiling water for another 3 minutes. Then, the crude extract was sonicated for 1 minute and centrifuged at 16,000 g for 30 minutes at room temperature. The protein concentration was determined by measuring tryptophan fluorescence as previously described [21]. Briefly, 1 µL of sample or tryptophan standard (100 ng/µL) was added into 3 mL of 8 M urea buffer (8 M urea, 20 mM Tris-HCl, pH=7.6). Fluorescence experiments were carried out by a multi-mode microplate reader (Synergy NEO HTS, Biotek, USA). Fluorescence was excited at 295 nm and measured at 350 nm, and both excitation and emission slits were set at 10 nm.
Protein digestion and peptide labeling with iTRAQ reagents
100 μg of protein per sample was digested by the FASP procedure as described [20]. Briefly, each sample was transferred to a 10 kDa filter (Pall Corporation) and centrifuged at 14,000 g for 40 minutes at room temperature. 200 μL of UA buffer (8 M urea, 0.1 M Tris-HCl, pH=8.5) was added and centrifuged at 14,000 g for 40 minutes. This step was then repeated. Following that, the concentrate was mixed with 100 μL of 50 mM iodacetamide (IAA) in UA buffer and incubated for an additional 40 minutes at room temperature in darkness. After that, IAA was removed by centrifugation at 14,000 g for 40 minutes. The sample was diluted with 200 μL of UA buffer and centrifuged twice. Then, 200 μL of 50 mM triethylammonium bicarbonate (TEAB) was added and centrifuged at 14,000 g for 40 minutes. This step was repeated twice. Finally, 100 μL of 50 mM TEAB and Trypsin (1:50, enzyme to protein) were added and incubated with the mixture at 37°C for 16 h. The tryptic peptide mixtures were collected and dried in a vacuum concentrator for further analysis.
For peptide labeling with iTRAQ reagents, a reference pool was created by combining 100 µg of peptides from each clinical sample. The samples corresponding to each iTRAQ tag are listed in Table 1 and Figure 1. iTRAQ labeling was done following the manufacturer’s instructions (Applied Biosystems). Briefly, 100 µg of each dried peptide sample were reconstituted in 30 μL Dissolution Buffer. Each peptide solution was labeled at room temperature for 2 h with one iTRAQ reagent vial (mass tag 113, 114, 115, 116, 117, 118, 119, 121) that was previously reconstituted with 70 μL of ethanol. After 2 h, 100 μL of Milli-Q water was added to each tube to quench the iTRAQ reaction before being incubated at room temperature for 30 minutes. The contents of all iTRAQ reagent-labeled sample tubes were combined into one tube. This combined sample was then dried down by evaporation in a Speed Vac. 100 µL of water was added to the tube and the sample was dried down completely.
Figure 1.
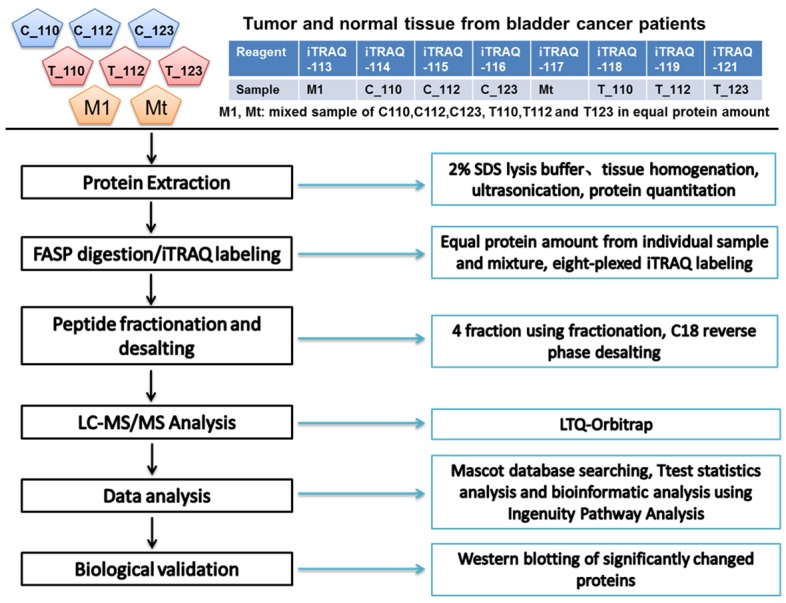
Flow chart of the iTRAQ labeling quantitative proteomic study of low-grade bladder tissue samples.
LC-MS/MS analysis
The reverse-phase high performance liquid chromatography (RP-HPLC) separation was achieved on a Suveyor HPLC system (Thermo Fisher Scientific) equipped with a home-made column (75 μm × 120 mm) at a flow rate of 250 nL/min. The RP-HPLC system was coupled with an LTQ-Orbitrap instrument (Thermo Fisher Scientific) operated in data-dependent mode. The mass spectrometer was set so that each full MS scan was followed by MS/MS for the 10 most intense ions with charges ≥ +2 with the following Dynamic Exclusion™ settings: repeat counts, 1; repeat duration, 120 s; exclusion duration, 120 s. The full mass was scanned in an Orbitrap analyzer with R=30,000 (defined at m/z 400), followed by HCD MS/MS scans with R=7,500. The NCE was set at 35%.
Database searching for iTRAQ-based quantitation
The generated mass spectrometry data were searched using Mascot (ver. 2.1; Matrix Science, London, United Kingdom) against a protein sequence database consisting of: The human International Protein Index protein sequence database (ver 3.68), frequently observed contaminants, and reversed copies of all the sequences. Enzyme specificity was set to trypsin, carbamidomethyl cysteine was set as a fixed modification; whereas, oxidized methionine, N-terminal iTRAQ eight-plex, lysine iTRAQ eight-plex were set as variable modifications. A maximum of two missed cleavages were allowed, and the minimum required peptide length was set to 6 amino acids. The required false positive rate was set to 1% at the peptide level, and the required false discovery rate was set to 1% at the protein level. False positive rates for peptides were calculated by recording the Mascot score and the peptide sequence length-dependent histograms of forward and reverse hits separately, and then, Bayes’ theorem was used to derive the probability of a false identification for a given top scoring peptide. The probability cutoff of 0.05 at the peptide level ensures that the number of falsely identified peptides remains low. Proteins were then sorted by the product of the false positive rates of their corresponding peptides and only peptides with distinct sequences were considered.
Relative quantitation (fold change) was calculated using iTRAQ reporter ion intensities in MS/MS spectra (m/z 113, 114, 115, 116, 117, 118, 119 and 121) from the raw data sets. The reporter ion intensities were extracted using the following criteria: first, the fragment ion tolerance was 20 ppm for the most confident centroid peak. Second, only peptides unique to a given protein were considered for relative quantitation, except those peptides common to other isoforms or proteins of the same family. Third, the mean intensity of the m/z 113 and 117 reporter ions (mixed samples of C110, C112, C123, T110, T112 and T123 in equal protein amount) was used to normalize the intensity of the other reporter ions (m/z 114, 115, 116, 118, 119 and 121) corresponding to the individual clinical samples (C110, C112, C123, T110, T112 and T123), respectively.
Data analysis
The p-value of the protein between normal and cancer tissue samples was calculated using the T-Test, and P<0.05 was set as a criterion for significant change. Subcellular location and molecular function predictions of each identified protein was achieved using Ingenuity Pathways Analysis (IPA, version 8.5, Ingenuity Systems, Redwood City, CA). Also, the function heatmap and protein interaction network were generated by Ingenuity Pathways Analysis software.
Western blot analysis
Total proteins were extracted from tumors and from adjacent normal regions (controls) obtained from patients diagnosed with bladder cancer. A total of 50 μg of proteins were mixed with invitrogen NuPAGE® LDS sample buffer (reducing agent added) and resolved by NuPAGE 4-12% Bis-Tris Gel with MOPS running buffer. Proteins were transferred onto nitrocellulose membrane using the iBlot™ dry blotting system. The membranes were then blocked with 5% non-fat dry milk in PBS and 0.1% Tween-20 for 45 minutes at room temperature, followed by incubation overnight at 4°C with an anti-SafB antibody (dilution: 1/500, Cat.05-588, Millipore), an anti-RanBP1 (dilution: 1/1000, Cell signaling), or anti-GAPDH antibody (dilution: 1/5000, Abcam, loading control). The secondary antibody that was used was IRDye goat anti-mouse/rabbit antibody (dilution 1/10000, LI-COR).
Results
Quantitative analysis of tumor and non-tumor tissue from bladder cancer patients using iTRAQ labeling
The strategy for the analysis of the different samples using the iTRAQ reagents coupled with nano-LC-MS/MS is illustrated in Figure 1. 1,627 unique proteins were quantified from the tumor and non-tumor samples (Supplementary Data). Of these, 35 proteins (2.2% of 1627 proteins) were statistically different between the two subsets (T-Test p value <0.05).
The bioinformatics analysis of the 1627 proteins was performed by the Ingenuity Pathway Analysis. The bioinformatic analysis revealed subcellular locations for 1502 proteins as well as predictive biological processes. Of the 1502 proteins (Figure 2A), 875 proteins (58%) and 284 (19%) were predicted to be localized in the cytoplasm and nucleus respectively, due to their high abundance; 155 (10%) and 137 (9%) proteins were predicted as extracellular and plasma membrane proteins, respectively. This finding indicates that the low abundant secreted extracellular and the plasma membrane proteins can also be detected and quantified in our study. As shown in Figure 2B, the quantitative proteome of 1502 proteins shows no biases against low-abundance regulatory proteins such as the receptor/growth factors (37 identified and quantified which represents 2.5% of our proteome) and the kinase/phosphatase (73 identified which is 5% of the total).
Figure 2.

Subcellular location and function distribution of the quantified proteins between normal and bladder cancer tissues. A: Distribution of Subcellular Location; B: Distribution of Protein Type; C: Heatmap of diseases and biological functions.
The link to disease and the biological function of the significantly changed proteins were also analyzed. As shown in Figure 2C, the proteins involved in tissue development showed decreased expression in tumor tissues; whereas, the proteins involved in cancer, cellular growth, cellular movement, hematological system development, immune cell trafficking, and infectious disease all showed increased expression in tumor tissues. The proteins related to the aggregation of cells, such as CLNS1A, SERPINF1, and COL14A1, showed decreased expression in tumor tissues with a z-score of -0.762 and an overlap p-value of 2.57E-4. These results suggest that the integrity and the normal connective base membrane of the bladder cancer tissue might be disrupted by the abnormal growth of the tumor cells. However, the proteins related to cell proliferation, such as SLC2A1, MKI67, NAP1L1, SBDS, USP9X, and PDXK showed increased expressions in the tumor tissue with a Z-score of 2.767 and an overlap p-value of 4.49E-2. These results suggest that the cells in the tumor tissues have increased proliferation compared to the normal tissues.
Interaction network analysis of the significantly changed proteins
The 1627 quantified proteins (especially the 35 proteins that significantly changed between tumor and non-tumor subsets) were further analyzed using the disease/biological function interaction network in the Ingenuity Pathway Analysis software. The significantly changed proteins were enriched in the network for “Cellular Movement, Cancer, Gastrointestinal Disease” and “Cardiac Necrosis/Cell Death, Cell Death and Survival, Cellular Development” with a score of 20 and 18, respectively. Interestingly, more than half of the proteins in these two networks are present or are connected in both networks, so we merged these two networks into one single network (Figure 3). 32 proteins quantified in our study were present in this network. Among them, 12 proteins were significantly up-regulated in tumor tissues, 9 proteins were significantly down-regulated in tumor tissues, and 11 proteins had no significant change between tumor and non-tumor tissues.
Figure 3.

Protein-protein interaction network of differential expressed protein in bladder cancer tissue.
Western blot analysis
Western blot validation was performed to confirm the quantitative results from mass spectrometry. The scaffold attachment factor B (SafB) is up-regulated in bladder cancer tissues with a tumor/normal ratio of 1.67 and a p-value of 0.04 (Table 2) in the MS analysis. A Western Blot analysis of the SafB protein confirmed that SafB is up-regulated in five individual bladder cancer samples (p-value of 0.015, tumor to non-tumor ratio of 2.09, Figure 4A).
Table 2.
List of significantly changed proteins between normal and bladder cancer tissues (P<0.05)
| IPI Number | Protein Name | Normalized iTRAQ Intensity | p-value | Ratio (T/C) | |||||
|---|---|---|---|---|---|---|---|---|---|
|
| |||||||||
| C_80 | C_101 | C_113 | T_80 | T_101 | T_113 | ||||
| IPI00872991 | ADH1B cDNA FLJ51682, highly similar to Alcohol dehydrogenase 1B | 2.63 | 1.18 | 2.42 | 0.32 | 0.74 | 0.63 | 0.032 | 0.27 |
| IPI00002459 | ANXA6 Uncharacterized protein | 1.48 | 1.48 | 2.34 | 0.42 | 1.09 | 0.59 | 0.038 | 0.40 |
| IPI00012119 | DCN Isoform A of Decorin | 1.03 | 1.94 | 1.84 | 0.49 | 0.91 | 0.57 | 0.041 | 0.41 |
| IPI00176193 | COL14A1 Isoform 1 of Collagen alpha-1 (XIV) chain | 1.24 | 2.12 | 1.71 | 0.43 | 1.13 | 0.68 | 0.045 | 0.44 |
| IPI00026240 | BST1 ADP-ribosyl cyclase 2 | 2.13 | 1.67 | 1.67 | 0.43 | 1.20 | 0.85 | 0.021 | 0.45 |
| IPI00607693 | CES1 liver carboxylesterase 1 isoform c precursor | 1.54 | 0.96 | 1.67 | 0.50 | 0.79 | 0.63 | 0.032 | 0.46 |
| IPI00026314 | GSN Isoform 1 of Gelsolin | 1.18 | 1.37 | 1.77 | 0.79 | 0.98 | 0.89 | 0.039 | 0.62 |
| IPI00329801 | ANXA5 Annexin A5 | 1.31 | 1.49 | 1.50 | 1.07 | 0.93 | 0.98 | 0.004 | 0.70 |
| IPI00032179 | SERPINC1 Antithrombin-III | 1.39 | 1.27 | 1.28 | 0.84 | 1.18 | 0.77 | 0.044 | 0.71 |
| IPI00550991 | SERPINA3 cDNA FLJ35730 fis, clone TESTI2003131, highly similar to ALPHA-1-ANTICHYMOTRYPSIN | 1.41 | 1.39 | 1.16 | 0.98 | 1.11 | 0.86 | 0.034 | 0.74 |
| IPI00219365 | MSN Moesin | 1.67 | 1.44 | 1.32 | 1.09 | 1.06 | 1.19 | 0.030 | 0.75 |
| IPI00967583 | CRMP1 cDNA FLJ16285 fis, clone OCBBF2004038, highly similar to Dihydropyrimidinase-related protein 1 | 1.18 | 1.36 | 1.34 | 0.87 | 1.10 | 1.08 | 0.041 | 0.79 |
| IPI00550069 | RNH1 Ribonuclease inhibitor | 1.25 | 1.14 | 1.30 | 1.03 | 0.97 | 1.07 | 0.021 | 0.83 |
| IPI00006114 | SERPINF1 Pigment epithelium-derived factor | 1.22 | 1.24 | 1.31 | 1.11 | 1.06 | 1.12 | 0.006 | 0.87 |
| IPI00953221 | ESYT2 Isoform 6 of Extended synaptotagmin-2 | 1.14 | 1.03 | 1.22 | 1.28 | 1.30 | 1.41 | 0.044 | 1.18 |
| IPI00021855 | APOC1 Apolipoprotein C-I | 1.18 | 1.32 | 0.96 | 1.38 | 1.55 | 1.54 | 0.046 | 1.29 |
| IPI00024129 | PPIC Peptidyl-prolyl cis-trans isomerase C | 1.02 | 0.91 | 1.17 | 1.61 | 1.35 | 1.30 | 0.035 | 1.37 |
| IPI00296485 | MAP1S Microtubule-associated protein 1S | 0.95 | 1.08 | 1.02 | 1.22 | 1.58 | 1.42 | 0.024 | 1.38 |
| IPI00026271 | RPS14 40S ribosomal protein S14 | 1.15 | 1.07 | 1.05 | 1.46 | 1.36 | 1.84 | 0.039 | 1.42 |
| IPI00394882 | RAB15 Isoform 1 of Ras-related protein Rab-15 | 1.01 | 0.94 | 0.86 | 1.66 | 1.16 | 1.32 | 0.044 | 1.48 |
| IPI00028481 | RAB8A Ras-related protein Rab-8A | 1.01 | 0.94 | 0.86 | 1.66 | 1.16 | 1.32 | 0.044 | 1.48 |
| IPI00148063 | HEBP1 Heme-binding protein 1 | 0.57 | 0.54 | 0.66 | 0.76 | 0.82 | 1.05 | 0.040 | 1.49 |
| IPI00032808 | RAB3D Ras-related protein Rab-3D | 1.01 | 0.97 | 0.74 | 1.52 | 1.19 | 1.46 | 0.022 | 1.53 |
| IPI00926999 | SBDS 10 kDa protein | 0.71 | 0.87 | 0.81 | 1.09 | 1.32 | 1.29 | 0.007 | 1.55 |
| IPI00478565 | PTK7 Isoform 4 of Tyrosine-protein kinase-like 7 | 0.93 | 1.03 | 0.77 | 1.47 | 1.41 | 1.62 | 0.004 | 1.65 |
| IPI00983392 | SAFB scaffold attachment factor B1 isoform 1 | 1.00 | 0.96 | 0.59 | 1.14 | 1.46 | 1.65 | 0.045 | 1.67 |
| IPI00983621 | THY1 18 kDa protein | 1.40 | 1.05 | 0.85 | 2.13 | 1.50 | 2.18 | 0.037 | 1.76 |
| IPI00979926 | CLNS1A PRO1478 | 0.82 | 0.68 | 0.52 | 1.33 | 1.04 | 1.22 | 0.012 | 1.78 |
| IPI00023860 | NAP1L1 Nucleosome assembly protein 1-like 1 | 0.83 | 0.88 | 0.58 | 1.24 | 1.31 | 1.73 | 0.020 | 1.87 |
| IPI00878075 | RANBP1 23 kDa protein | 1.11 | 1.08 | 1.22 | 2.21 | 1.87 | 2.40 | 0.003 | 1.90 |
| IPI00018783 | ITPA Inosine triphosphate pyrophosphatase | 0.93 | 0.66 | 0.90 | 1.49 | 1.21 | 2.09 | 0.049 | 1.93 |
| IPI00013004 | PDXK Isoform 1 of Pyridoxal kinase | 0.85 | 0.66 | 0.52 | 1.96 | 1.10 | 1.44 | 0.037 | 2.22 |
| IPI00004233 | MKI67 Isoform Long of Antigen KI-67 | 1.10 | 0.93 | 0.69 | 2.03 | 2.83 | 1.77 | 0.019 | 2.44 |
| IPI00220194 | SLC2A1 Solute carrier family 2, facilitated glucose transporter member 1 | 0.54 | 0.84 | 0.23 | 3.18 | 1.32 | 2.55 | 0.034 | 4.39 |
| IPI00003964 | USP9X Isoform 2 of Probable ubiquitin carboxyl-terminal hydrolase FAF-X | 0.00 | 0.97 | 0.00 | 1.18 | 1.68 | 1.70 | 0.030 | 4.72 |
Figure 4.
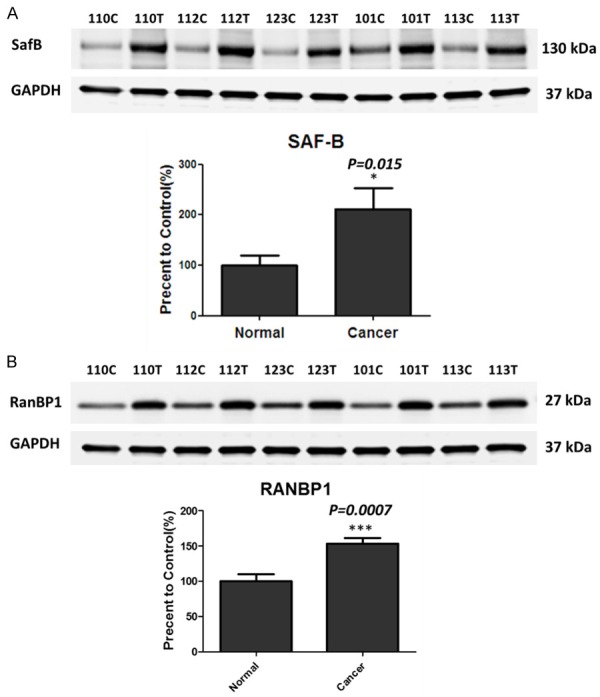
SafB and RanBP1 are up-regulated in the bladder cancer samples. A. Western blot analyses of SafB in the bladder cancer tissues and non-tumor tissues (p-value of 0.015, tumor to non-tumor ratio of 2.09). Total GAPDH levels served as loading controls. B. Western blot analyses of RanBP1 in the bladder cancer tissues and non-tumor tissues (p-value of 0.0007, tumor to non-tumor ratio of 1.53). Total GAPDH levels served as loading controls. *P<0.05; ***P<0.001.
The RAN binding protein 1 (RanBP1) is also up-regulated in bladder cancer tissues with a tumor/normal ratio of 1.90 and a p-value of 0.003 (Table 2). Western Blot analysis of the RanBP1 protein also confirmed that RanBP1 is up-regulated in five individual bladder cancer samples compare to the controls (p-value of 0.0007, tumor to normal ratio of 1.53, Figure 4B).
Discussions
The classification of bladder cancer plays an important role in clinics for determining the appropriate treatment strategies and for predicting the outcomes of the disease. According to distinct clinical characteristics, the WHO grading of bladder cancer has incorporated a range of histologic descriptions such as urothelial papilloma (completely benign lesion), papillary urothelial neoplasm of low malignant potential (PUNLMP), and low-grade and high-grade cancer [6]. The more common techniques for diagnosing bladder cancer are cystoscopy, photodynamic diagnosis/blue-light cystoscopy, narrow-band imaging and urinary markers. However, cytology, the most widely adopted non-invasive urine test, has good specificity and sensitivity for the detection of high-grade tumors, but it has poor sensitivity for low-grade tu-mors [6]. In this study, the tumor and the adjacent normal tissues from three low-grade non-muscle-invasive bladder cancer patients were analyzed using the iTRAQ labeling quantitative proteomic approach. In previous studies, based on urine proteomic analyses, the urine proteins from the bladder cancer patients and the controls were usually pooled to minimize individual variation and to enhance signals [11,22]. In this study, however, the tissue samples were not pooled. Instead, the tissue samples were analyzed individually.
The down-regulated proteins, such as gelsolin, moesin, annexin A5 and A6, are involved in the formation of cytoskeleton, which may be related to the metastasis of bladder cancer cells. Gelsolin was down-regulated in bladder cancer tissues with a p-value of 0.039, and a tumor to control ratio of 0.62. Lei et al. also reported that gelsolin was down-regulated in the urine of bladder cancer patients. They use 2-dimensional electrophoresis technique combined with a matrix-assisted laser desorption ionization time-of-flight mass spectrometer [23]. Gelsolin can mediate the remodeling of the actin cytoskeleton, which leads to high recurrence and mortality rates of bladder cancer by the metastasis of cancer cells [24]. However, the transcription factor activating transcription factor 3 (ATF3) can partially up-regulate gelsolin-mediated actin remodeling, resulting in metastasis suppression in bladder cancer [24].
The two up-regulated proteins, the scaffold attachment factor B (SafB) and the RAN binding protein 1 (RanBP1), were first reported as significantly changed proteins in bladder cancer tissues in this study. Therefore, the function of these two proteins in bladder cancer physiopathology need to be further studied.
SafB was originally identified as a nuclear binding protein that binds specific to matrix attachment regions DNA elements (S/MAR DNA). Recent studies have found that SafB not only is involved as a transcriptional repressor of the small heat shock protein hsp27, but it also acts as a corepressor of estrogen receptor activity in breast cancer [25]. And SafB protein was also reported a key player in tumorigenesis, particularly in breast tumorigenesis [25-28]. The expression of SafB is related to cell growth of tumors and to the survival rate of the patient with breast cancer. For example, overexpression of SafB has been shown to inhibit cell growth; whereas low levels of SafB are associated with poor survival rates for patients with breast tumors [26,27]. In our study, the quantitative result of the small heat shock protein hsp27 was not changed significantly between normal and bladder cancer tissues. This finding indicates that the up-regulation of SafB in bladder cancer tissue may not affect the hsp27 expression. Therefore, the mechanism of SafB up-regulation in low-grade bladder cancer tissue needs to be further studied, and it can pave a way to understand more the bladder cancer tumorigenesis.
The RanBP1 protein, binds RAN and regulates its interaction with effectors by interacts specifically RAN complexed with GTP-charges but not GDP, have been found to be overexpressed in many types of tumors [29]). The GTPase RAN also regulates multiple processes including the mitotic spindle assembly, spindle pole formation, and mitotic microtubule (MT) dynamics. Therefore, RAN activity plays a very important role in the formation of a functional mitotic apparatus [29]. Rensen et al. reported that down-regulation of RanBP1 can increase apoptotic response to taxol in cancer cells [29]. Their further study demonstrated that the serum- and glucocorticoid-regulated kinase (Sgk1) can increase RanBP1 transcript levels and decrease taxol sensitivity in RKO colon carcinoma cells [30]. Our study, however, is the first one to show the evidence of RanBP1 up-regulation steady in clinical bladder cancer tissues. RanBP1 can be selected as a potential biomarker candidate for early bladder cancer diagnosis, and it can be a potential drug target for bladder cancer therapy.
Conclusion
Using eight-plex iTRAQ labeling and nano-LC-MS/MS approaches, 1627 unique proteins were identified and absolutely quantified in human bladder cancer tissues. Among them, 35 proteins were significantly changed between normal and cancer tissues. Our study demonstrates the first application of the eight-plex iTRAQ quantitative proteomic approach for the study of bladder cancer tissues. Both mass spectrometry and Western Blot data demonstrate that SafB and RanBP1 were up-regulated in bladder cancer specimens. Thus both SafB and RanBP1 can be selected as potential biomarkers and/or drug targets for bladder cancer diagnosis and therapy.
Acknowledgements
The work was supported by Shanghai Education Commission Research and Innovation Projects (No. 15ZZ022).
Disclosure of conflict of interest
None.
Supporting Information
References
- 1.Jemal A, Siegel R, Xu J, Ward E. Cancer statistics, 2010. CA Cancer J Clin. 2010;60:277–300. doi: 10.3322/caac.20073. [DOI] [PubMed] [Google Scholar]
- 2.Sexton WJ, Wiegand LR, Correa JJ, Politis C, Dickinson SI, Kang LC. Bladder cancer: a review of non-muscle invasive disease. Cancer Control. 2010;17:256–268. doi: 10.1177/107327481001700406. [DOI] [PubMed] [Google Scholar]
- 3.Celis JE, Gromova I, Moreira JM, Cabezon T, Gromov P. Impact of proteomics on bladder cancer research. Pharmacogenomics. 2004;5:381–394. doi: 10.1517/14622416.5.4.381. [DOI] [PubMed] [Google Scholar]
- 4.Al Hussain TO, Akhtar M. Molecular basis of urinary bladder cancer. Adv Anat Pathol. 2013;20:53–60. doi: 10.1097/PAP.0b013e31827bd0ec. [DOI] [PubMed] [Google Scholar]
- 5.Sansom C. Proteomics may aid bladder cancer diagnosis. Lancet Oncol. 2000;1:5. doi: 10.1016/S1470-2045(00)00042-5. [DOI] [PubMed] [Google Scholar]
- 6.Cheung G, Sahai A, Billia M, Dasgupta P, Khan MS. Recent advances in the diagnosis and treatment of bladder cancer. BMC Med. 2013;11:13. doi: 10.1186/1741-7015-11-13. [DOI] [PMC free article] [PubMed] [Google Scholar]
- 7.Grossman HB, Messing E, Soloway M, Tomera K, Katz G, Berger Y, Shen Y. Detection of bladder cancer using a point-of-care proteomic assay. JAMA. 2005;293:810–816. doi: 10.1001/jama.293.7.810. [DOI] [PubMed] [Google Scholar]
- 8.Latosinska A, Frantzi M, Vlahou A, Mischak H. Clinical applications of capillary electrophoresis coupled to mass spectrometry in biomarker discovery: focus on bladder cancer. Proteomics Clin Appl. 2013;7:779–93. doi: 10.1002/prca.201300038. [DOI] [PubMed] [Google Scholar]
- 9.Sanchez-Carbayo M, Socci ND, Richstone L, Corton M, Behrendt N, Wulkfuhle J, Bochner B, Petricoin E, Cordon-Cardo C. Genomic and proteomic profiles reveal the association of gelsolin to TP53 status and bladder cancer progression. Am J Pathol. 2007;171:1650–1658. doi: 10.2353/ajpath.2007.070338. [DOI] [PMC free article] [PubMed] [Google Scholar]
- 10.Kageyama S, Isono T, Iwaki H, Wakabayashi Y, Okada Y, Kontani K, Yoshimura K, Terai A, Arai Y, Yoshiki T. Identification by proteomic analysis of calreticulin as a marker for bladder cancer and evaluation of the diagnostic accuracy of its detection in urine. Clin Chem. 2004;50:857–866. doi: 10.1373/clinchem.2003.027425. [DOI] [PubMed] [Google Scholar]
- 11.Chen CL, Lin TS, Tsai CH, Wu CC, Chung T, Chien KY, Wu M, Chang YS, Yu JS, Chen YT. Identification of potential bladder cancer markers in urine by abundant-protein depletion coupled with quantitative proteomics. J Proteomics. 2013;85:28–43. doi: 10.1016/j.jprot.2013.04.024. [DOI] [PubMed] [Google Scholar]
- 12.Schiffer E, Vlahou A, Petrolekas A, Stravodimos K, Tauber R, Geschwend JE, Neuhaus J, Stolzenburg JU, Conaway MR, Mischak H, Theodorescu D. Prediction of muscle-invasive bladder cancer using urinary proteomics. Clin Cancer Res. 2009;15:4935–4943. doi: 10.1158/1078-0432.CCR-09-0226. [DOI] [PubMed] [Google Scholar]
- 13.Minami S, Sato Y, Matsumoto T, Kageyama T, Kawashima Y, Yoshio K, Ishii J, Matsumoto K, Nagashio R, Okayasu I. Proteomic study of sera from patients with bladder cancer: usefulness of S100A8 and S100A9 proteins. Cancer Genomics Proteomics. 2010;7:181–189. [PubMed] [Google Scholar]
- 14.Schwamborn K, Krieg RC, Grosse J, Reulen N, Weiskirchen R, Knuechel R, Jakse G, Henkel C. Serum proteomic profiling in patients with bladder cancer. Eur Urol. 2009;56:989–996. doi: 10.1016/j.eururo.2009.02.031. [DOI] [PubMed] [Google Scholar]
- 15.Ross PL, Huang YN, Marchese JN, Williamson B, Parker K, Hattan S, Khainovski N, Pillai S, Dey S, Daniels S, Purkayastha S, Juhasz P, Martin S, Bartlet-Jones M, He F, Jacobson A, Pappin DJ. Multiplexed protein quantitation in Saccharomyces cerevisiae using aminereactive isobaric tagging reagents. Mol Cell Proteomics. 2004;3:1154–1169. doi: 10.1074/mcp.M400129-MCP200. [DOI] [PubMed] [Google Scholar]
- 16.DeSouza L, Diehl G, Rodrigues MJ, Guo J, Romaschin AD, Colgan TJ, Siu KW. Search for cancer markers from endometrial tissues using differentially labeled tags iTRAQ and cICAT with multidimensional liquid chromatography and tandem mass spectrometry. J Proteome Res. 2005;4:377–386. doi: 10.1021/pr049821j. [DOI] [PubMed] [Google Scholar]
- 17.Ow SY, Cardona T, Taton A, Magnuson A, Lindblad P, Stensjo K, Wright PC. Quantitative shotgun proteomics of enriched heterocysts from Nostoc sp. PCC 7120 using 8-plex isobaric peptide tags. J Proteome Res. 2008;7:1615–1628. doi: 10.1021/pr700604v. [DOI] [PubMed] [Google Scholar]
- 18.Glen A, Evans CA, Gan CS, Cross SS, Hamdy FC, Gibbins J, Lippitt J, Eaton CL, Noirel J, Wright PC, Rehman I. Eight-plex iTRAQ analysis of variant metastatic human prostate cancer cells identifies candidate biomarkers of progression: an exploratory study. Prostate. 2010;70:1313–1332. doi: 10.1002/pros.21167. [DOI] [PubMed] [Google Scholar]
- 19.Zhu G, Sun L, Keithley RB, Dovichi NJ. Capillary isoelectric focusing-tandem mass spectrometry and reversed-phase liquid chromatography-tandem mass spectrometry for quantitative proteomic analysis of differentiating PC12 cells by eight-plex isobaric tags for relative and absolute quantification. Anal Chem. 2013;85:7221–7229. doi: 10.1021/ac4009868. [DOI] [PMC free article] [PubMed] [Google Scholar]
- 20.Wisniewski JR, Zougman A, Nagaraj N, Mann M. Universal sample preparation method for proteome analysis. Nat Methods. 2009;6:359–362. doi: 10.1038/nmeth.1322. [DOI] [PubMed] [Google Scholar]
- 21.Nielsen PA, Olsen JV, Podtelejnikov AV, Andersen JR, Mann M, Wisniewski JR. Proteomic mapping of brain plasma membrane proteins. Mol Cell Proteomics. 2005;4:402–408. doi: 10.1074/mcp.T500002-MCP200. [DOI] [PubMed] [Google Scholar]
- 22.Chen YT, Chen CL, Chen HW, Chung T, Wu CC, Chen CD, Hsu CW, Chen MC, Tsui KH, Chang PL, Chang YS, Yu JS. Discovery of novel bladder cancer biomarkers by comparative urine proteomics using iTRAQ technology. J Proteome Res. 2010;9:5803–5815. doi: 10.1021/pr100576x. [DOI] [PubMed] [Google Scholar]
- 23.Lei T, Zhao X, Jin S, Meng Q, Zhou H, Zhang M. Discovery of potential bladder cancer biomarkers by comparative urine proteomics and analysis. Clin Genitourin Cancer. 2013;11:56–62. doi: 10.1016/j.clgc.2012.06.003. [DOI] [PubMed] [Google Scholar]
- 24.Yuan X, Yu L, Li J, Xie G, Rong T, Zhang L, Chen J, Meng Q, Irving AT, Wang D, Williams ED, Liu JP, Sadler AJ, Williams BR, Shen L, Xu D. ATF3 suppresses metastasis of bladder cancer by regulating gelsolin-mediated remodeling of the actin cytoskeleton. Cancer Res. 2013;73:3625–3637. doi: 10.1158/0008-5472.CAN-12-3879. [DOI] [PubMed] [Google Scholar]
- 25.Townson SM, Sullivan T, Zhang Q, Clark GM, Osborne CK, Lee AV, Oesterreich S. HET/SAF-B overexpression causes growth arrest and multinuclearity and is associated with aneuploidy in human breast cancer. Clin Cancer Res. 2000;6:3788–3796. [PubMed] [Google Scholar]
- 26.Hong EA, Gautrey HL, Elliott DJ, Tyson-Capper AJ. SAFB1- and SAFB2-mediated transcriptional repression: relevance to cancer. Biochem Soc Trans. 2012;40:826–830. doi: 10.1042/BST20120030. [DOI] [PubMed] [Google Scholar]
- 27.Hammerich-Hille S, Bardout VJ, Hilsenbeck SG, Osborne CK, Oesterreich S. Low SAFB levels are associated with worse outcome in breast cancer patients. Breast Cancer Res Treat. 2010;121:503–509. doi: 10.1007/s10549-008-0297-6. [DOI] [PubMed] [Google Scholar]
- 28.Garee JP, Oesterreich S. SAFB1’s multiple functions in biological control-lots still to be done! J Cell Biochem. 2010;109:312–319. doi: 10.1002/jcb.22420. [DOI] [PubMed] [Google Scholar]
- 29.Rensen WM, Roscioli E, Tedeschi A, Mangiacasale R, Ciciarello M, Di Gioia SA, Lavia P. RanBP1 downregulation sensitizes cancer cells to taxol in a caspase-3-dependent manner. Oncogene. 2009;28:1748–1758. doi: 10.1038/onc.2009.24. [DOI] [PubMed] [Google Scholar]
- 30.Amato R, Scumaci D, D’Antona L, Iuliano R, Menniti M, Di Sanzo M, Faniello MC, Colao E, Malatesta P, Zingone A, Agosti V, Costanzo FS, Mileo AM, Paggi MG, Lang F, Cuda G, Lavia P, Perrotti N. Sgk1 enhances RANBP1 transcript levels and decreases taxol sensitivity in RKO colon carcinoma cells. Oncogene. 2013;32:4572–4578. doi: 10.1038/onc.2012.470. [DOI] [PubMed] [Google Scholar]
Associated Data
This section collects any data citations, data availability statements, or supplementary materials included in this article.