Abstract
Background:
High plasma concentration of low-density lipoprotein cholesterol (LDL-c) plays a significant role in the incidence of atherosclerosis and coronary heart diseases (CHD).
Materials and Methods:
The purpose of this study was to investigate the mechanism by which citrus flavonoids, naringenin regulate the LDL receptor (LDLr) gene in human liver using the human hepatoma cell line, HepG2 as a model.
Results:
Time-course transient transfection of HepG2 cells with luciferase reporter-gene constructs incorporating the promoters of SREBP-1a,-1c, -2 and LDLr, revealed that in lipoprotein-deficient medium (LPDM), only SREBP-1a promoter activity was increased significantly after 4h exposure to 200μM naringenin respectively. However, after 24h incubation with 200μM naringenin the gene expression activities of all the SREBP-1a, -1c, -2 and LDLr promoter-constructs were increased significantly. The effects of both 200μM naringenin on elevating LDLr mRNA are possibly due to regulation of gene transcription by SREBP-la and SREBP-2. However, the suppression effect of 200μM naringenin on hepatic SREBP-1c mRNA expression is likely associated with the reduction in mRNA expression of both acetyl-CoA carboxylase and fatty acid synthase in human hepatoma HepG2 cells. It was found that, 200μM naringenin was likely to stimulate LDLr gene expression via increase phosphorylation of PI3K and ERK1/2 which enhance the transcription factors SREBP-1a and SREBP-2 mRNA levels and increased their protein maturation in human hepatoma HepG2 cell.
Conclusion:
Diets supplemented with naringenin could effectively reduce mortality and morbidity from coronary heart diseases and as cardio-protective effects in humans.
Keywords: LDL-receptor - Naringenin- HepG2
Introduction
Cardiovascular diseases (CVD) are commonly related to illnesses which involve the heart and blood vessels such as heart attack, stroke, angina pectoris, arteriosclerosis and blood pressure. It is universally agreed that CVD are a public health problem which annually disable or claim the lives of many people. It is now generally accepted that elevated plasma concentration of low-density lipoprotein cholesterol (LDL-c) plays a significant role in promoting the incidence of atherosclerosis and coronary heart diseases (CHD) (Borradaile et al., 2003).
Many clinical studies have been carried out using statins, HMG-CoA reductase inhibitors (Erlund et al., 2001), which are the most effective drug for lowering blood cholesterol concentration. Although statins are potent drugs, they have side effects such as effects on liver enzymes and muscle toxicity which includes myopathy and rhabdomyolysis (Espenshade, 2006). Increasingly, dietary approaches to lowering CHD are more appealing than pharmacological alternatives. Natural hypocholesterolemic substances are an integral part of the human diet because they are ubiquitous in foods of plant origin. NCEP strongly recommended the adoption of healthy life style which includes a healthy diet to achieve a desirable blood lipid profile. However, treatments to lower LDL-c in individuals at high risk of CHD usually involve combinations of healthy diet and drug therapy (Ettinger, 2004). Many epidemiological studies have revealed that a diet rich in fruits and vegetables can protect against the development of cardiovascular diseases. To study the relationship between diet and CHD, the majority of studies have focused on the role of macronutrients (dietary fat, cholesterol, protein, and carbohydrates), fibers, saponins, antioxidants, minerals, vitamins and pectin (Fernandez-Alvareza et al., 2008). However, great interest has been shown in the benefits of wide range non-nutrient dietary components in reducing the risk of CHD. One such group of components in the diet are the flavonoids, which are found in a wide variety of fruits and vegetables, in reducing the risk of heart diseases and stroke (Fleischmann and Iynedjian, 2000).
Naringenin belong to the class of flavonoids called flavanones. Flavanones occur almost exclusively in citrus fruits. Although the highest concentrations are found in the solid tissues, several hundred milligrams per litre are present in the juice. The main flavonoids of grapefruit are 70% naringin (naringenin-7- neohesperoside) and 20% narirutin (naringenin-7-rutinoside). Tomatoes and tomato based products contain low concentrations of naringenin. The skin of fresh tomatoes contains naringenin chalcone which is converted to naringenin during processing to tomato ketchup (Flier and Hollenberg, 1999). Naringenin is found largely as the glycosides naringin and hesperidin which are hydrolyzed to their active forms, Naringenin and Naringenin, by intestinal bacteria (Foretz et al., 1999). Sweet orange juice contains narirutin (30-84 mg/L) and hesperidin (235-407 mg/L), while grapefruit juice contains narirutin (33-161 mg/L) and naringin (113-481 mg/L). In the United States, estimation of the mean daily individual consumption of citrus fruits and juices was 68 g and 59 g of which was consumed as orange and grapefruit juices (Gierens et al., 2000).
SREBPs are members of the basic helix-loop- helix-leucine zipper family of transcription factors that directly activate the transcription of more than 30 genes dedicated to the biosynthesis and uptake of cholesterol, fatty acid, triglycerides and phospholipids, in addition to the NADPH cofactor vital to synthesize these molecules. However, in the liver, they also regulate plasma lipoproteins and the bile micelles synthesis genes (Glass and Witzum, 2001). Several distinct genes of both cholesterol and fatty acid metabolism were directly inactivated by SREBPs in studies performed in cultured cells (Goldstein et al., 1983). In vivo, genes of cholesterol metabolism are activated by SREBP-2, while genes of fatty acid and triglyceride metabolism are activated by SREBP-1c. Although plant flavonoids have many potent biological properties such as anticancer, antiviral, antioxidant and lowering blood cholesterol, the mechanisms of action have not been fully elucidated.
The rational of this project is to investigate the mechanism(s) by which Naringenin may regulate the activity of the LDLr promoter, in human liver using the human hepatoma HepG2 cell line as a model and to investigate whether these compounds act via a SREBP-dependent mechanism or as a result of modulation of other signal transduction pathways.
Materials and Methods
Cell Culture and Transfection
The HepG2 and McARH-7777 cells were maintained in monolayer culture in 75cm2 flasks in 10% GM and incubated at 37°C, 5% CO2 for HepG2 and 10% CO2 for McARH-7777. Fresh GM was added every 2 days and cells were sub-cultured once a week by trypsinisation when the cells were 70-80% confluent. The medium was removed by aspiration and the cells washed with 3 ml 1x EDTA/saline. 1ml 1x trypsin solution was added and the flask incubated at 37°C for 2-3 minutes. 10 ml 10% GM was added and the cells were harvested by centrifugation at 1500rpm for 5 minutes. The cell pellet was re-suspended in fresh GM. Cells were split 1:2 to 1:7 into 75cm2 flasks for growth or in 6 well plates (9.6 cm2/well; IWAKI) for experiments.
HepG2 human hepatoma and McARH-7777 rat hepatocarcinoma cells were obtained from the American Type Culture Collection (ATCC). 10% Growth Medium (GM) 500 ml Dulbecco’s Modified Eagle’s Medium (high Glucose with 4500 mg/L glucose and Sodium bicarbonate. without L-glutamine) (DMEM; Sigma) supplemented with10% (v/v) fetal Bovine serum (FBS; Sigma), antibiotics (Penicillin 100U/ml, 100 μg/ml Streptomycin sulphate) and 2 mM L-Glutamine (Sigma).
Transfection for Dual-Luciferase Assay
Cells were transiently transfected with 1 μg/well human pLDLr Luc+ driving Firefly Luciferase activity using Tfx™ 50 transfection reagents (Promega) according to the manufacturer’s protocol. Co-transfection with a plasmid expressing Renilla luciferase under the control of the cytomegalovirus (CMV) promoter (0.1 μg/ml pRL-CMV) was carried out as a control for transfection efficiency. Salmon sperm (SSDNA) DNA was added to ensure the ratio of DNA/ml relative to the concentration of Tfx-50 transfection reagent was equal in all experimental conditions. Cells were then incubated in the transfection medium for 1h. Two ml warm 10% GM was then added to the cells. Following 24h incubation, medium was removed and cells were washed with 2 ml/well basal DMEM. Cells were exposed to DMSO as a vehicle or citrus flavonoids (Naringenin) in fresh GM or LPDM. After 24h incubation, cells were lysed for Dual- Luciferase Reporter (DLR) and protein assay.
Transformation of Competent Cells
One μg of plasmid DNA was added to 100 μl of ice-thawed competent DH5a (Stratagene) E.coli cells with gentle swirling, and left on ice for 30 minutes. The cells were then heat-shocked at 42°C in water bath without shaking for exactly 90 seconds. The cells were allowed to chill on ice for 2 minutes to allow the cells to take up the DNA. Then, 900 μl 1xLB was added to each aliquot and the cells were incubated at 37°C for 1hr in a rotary shaker to allow expression of the Ampicillin resistance gene. The cells were then centrifuged at 13,000 rpm for 1 minute and re-suspended in 100 μl 1xLB prior to spreading onto agar plate containing Amp/IPTGX-Gal. The inverted plates were incubated overnight at 37°C. For determination of the transformation efficiency of the competent cells, 100μl competent cells were transformed with an uncut plasmid.
Large scale Plasmid DNA purification (Maxi-prep)
The QIAGEN Plasmid Midi/Maxi kit was used to provide preparation of large quantity and high quality plasmid DNA for use in transfection. From a 5 ml overnight culture, 1ml was taken and placed into a glass conical flask containing 200 ml of sterile 1x LB with 1 μl/ml Ampicillin (100 mg/ml stock), and incubated on a rotary platform, 225 rpm at 37°C for 24h. The bacteria were pelleted at 3,600 rpm for 15 minutes at 4°C, and the supernatant was discarded. Then, the pellet’s purification was carried out according to the manufacturer’s instruction. The DNA pellet was re-suspended in 200 μl 1x TE buffer pH 8.0 and stored at -20°C.
Extraction of Human genomic (chromosomal) DNA from Whole Blood
Five ml of blood was collected in a Li/Heparin tube, and 1 ml was transferred to a 1.5 ml microcentrifuge tube and spun for 2 minutes at low speed in a bench top microcentrifuge. The serum was discarded and the cells were re-suspended in 1ml of 1x PBS containing 0.5 % (v/v) Triton X-100 (Fisher Scientific). The mixture was mixed by inverting and spun for 2 minutes at low speed in a bench top microcentrifuge. The supernatant was discarded and 750 μl lysis solution containing 1:40 dilution of proteinase K (15-20 mg/ml) (Roche, Germany) was added to the cells and mixed gently by pipetting up and down. The tube was incubated in water bath at 50°C for 1h with mixing by inversion every 20 minutes. 100 ul 5 M LiCl was added and mixed by inversion. Then, 400 ul phenol:chloroform:isoamyl alcohol (Sigma) (25:24:1) was added and mixed by inversion followed by vigorous mixing for 5 minutes by taping the tube on a shaking platform. After spinning for 5 minutes at 13,000 rpm, the upper aqueous layer was transferred to a fresh tube containing 700 ul isopropanol. Upon mixing thoroughly by inversion, the DNA became visible, and was transferred in minimum of liquid to a fresh tube containing 500 μl 70% (v/v) ethanol. After mixing by inversion and spinning for 5 minutes at 13,000 rpm in a bench top microcentrifuge the supernatant was removed and the pellet was air-dried for 10 minutes. The DNA pellet was re-suspended in 100 μl of 1x TE buffer by vortexing, followed by heating at 65°C for 15 minutes. DNA sample in aliquots was stored at -20°C.
Expression and Purification of Human SREBP-1a and SREBP-1c - 6xHis Tag Fusion Protein
Human pRSET A SREBP-1a (1-460 amino acids) and pRSET A SREBP-1c (1-436 amino acids) -6xHis tag fusion proteins were provided by Dr Scott Cooper, School of Biomedical Sciences, University of Nottingham. The recombinant proteins were used as a positive control for the mature form of SREBP-1a and SREBP-1c.
Expression of Protein Using Isopropyl-β-D-thiogalactopyranoside - Inducible Promoters (IPTG)
10 ml of 1xLB medium containing Ampicillin (final concentration of 100μg/ml) was inoculated with a single bacterial colony from a transformed plate and incubated overnight at 37°C in a rotary shaking incubator (225-250rpm). The overnight culture was added to 250 ml of 1xLB medium containing Ampicillin and incubated at 37°C in a shaking incubator until O.D.600 reached 0.2-0.4. Then, 1 ml of culture was removed as 0 time before adding 2.5ml of 100 mM IPTG. 1 ml fractions were collected during induction period with IPTG at 2h, 4h and overnight. Cells were pelleted in 50 ml tubes at 5000g for 15 minutes at 4°C and stored at -80°C. The collected fractions were run on 10% SDS PAGE. The gel was stained with Coomassie Blue and destained and photographs were taken using GeneSnap software.
Quantification of Total RNA
Purified RNA absorbance at 260nm (A260) and 280nm (A280) were determined using NanoDrop® ND-1000 Spectrophotometer (NanoDrop technologies). The ratio of absorbances was used to assess the purity of RNA. The absorbance of 1 unit at 260 nm corresponds to 44 μg RNA/ml in a neutral pH buffer. Pure RNA has an A260/A280 ratio of 1.9 - 2.1.
Electrophoresis of Glyoxylated RNA
1% (w/v) agarose gel was made up in 1x BPTE buffer. To denature RNA, 2 μg purifiedtotal RNA was mixed with 10μl glyoxal reaction mixture and incubated in Biometra Trio-Thermo block at 55°C for 1h. RNA samples were chilled for 10 minutes in ice water. Then, 2μl RNA loading buffer per sample was added before the samples were centrifuged 5 seconds to collect the liquid at the bottom of the tubes. The RNA samples were separated by gel electrophoresis
Reverse Transcription (RT)
Reverse transcription was used to synthesize complementary DNA (cDNA) from purified total RNA extraction using Moloney Murine Leukaemia Virus Reverse Transcriptase (M-MLV; Invitrogen).
Restriction Digest Procedure
To confirm the success of the ligation (Figure 3), a single -enzyme restriction digest with EcoR Ι and buffer H (Promega) was performed to release the insert from pGEM®- T Easy Vector as described in section 2.7.9 in Materials and Methods. The 20ul of the digest and 5ul SmartLadder molecular weight marker (Eurogentec, Belgium) were loaded on 1% (w/v) agarose gel in 1x TBE buffer The DNA was visualized and photographed under UV light using Genesnap from Genesyn.
Figure 1.
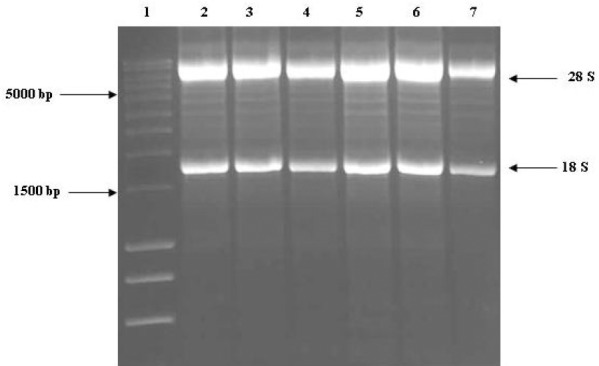
Agarose Gel Electrophoresis of Glyoxylated Total RNA Extracted from Human Hepatoma HepG2 Cells.
Lane 1: SmartLadder marker. Lane 2: LPDM +DMSO (4h). Lane 3: LPDM +200μM Naringenin (4h). Lane 4: LPDM +200μM Naringenin (4h). Lane 5: LPDM +DMSO (8h). Lane 6: LPDM +200μM Naringenin (8h). Lane 7: LPDM +200μM Naringenin (8h). Glyoxylated RNA was run on 1% (w/v) agarose gel. 28S and 18S ribosomal RNA. bands were sharp and discreet and the 28S to 18S ratio was >1.5
Figure 2.
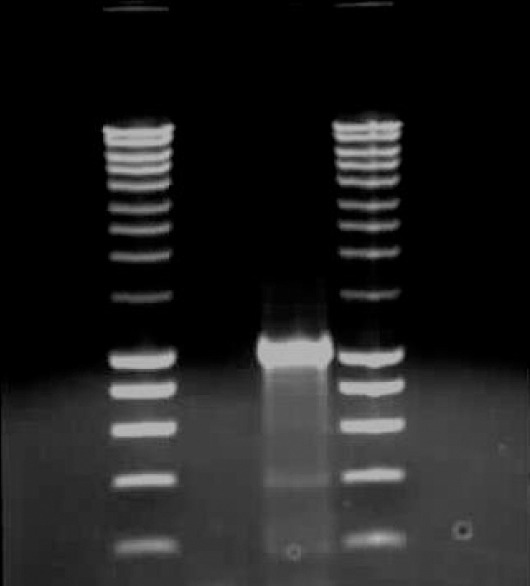
Gel Electrophoresis of PCR Product Lane 1 & 4: 5ul Smart Ladder marker Lane 2: 5ul of PCR negative control reaction containing no DNA template. Lane 3: 5ul PCR product of SREBP1-a promoter.
Figure 3.
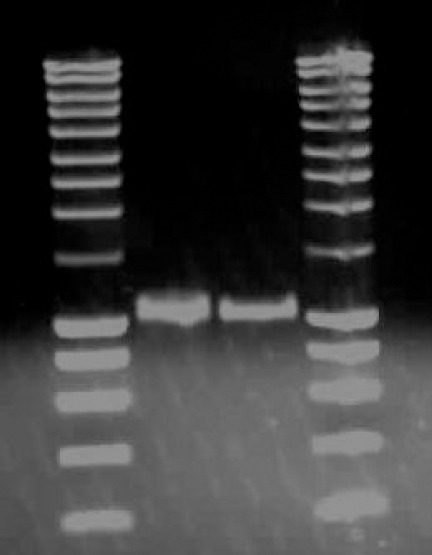
Lane 1 & 4: 5ul SmartLadder marker Lane 2 & 3:5ul of Purified SREBP1-a promoter DNA. PCR product of SREBP1-a promoter was excised from 1% (w/v) agarose gel in 1x TAE buffer and purified using the QIAGEN MinElute Gel Extraction Kit.
Figure 4.
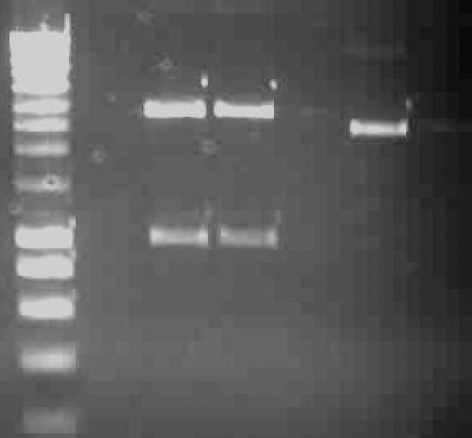
Gel Electrophoresis of pGEM®-T Easy- SREBP1a Promoter Fragment
Following EcoR Ι DigestLane 1 &4: SmartLadder marker. Lane 2 & 3: pGEM®-T Easy Vector and the insert (SREBP1-a promoter). Ethidium bromide stained 1% (w/v) agarose gel showing the plasmid DNA isolatedfrom white colonies on LB Agar/Amp/IPTG/X-Gal plate which was digested with EcoRI restriction enzyme.
Figure 5.
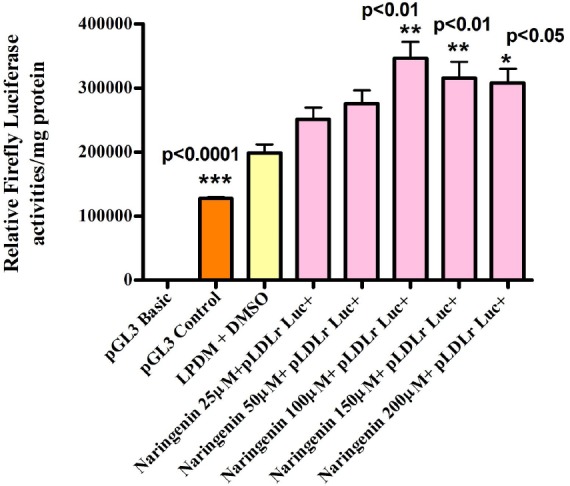
Figure 6.
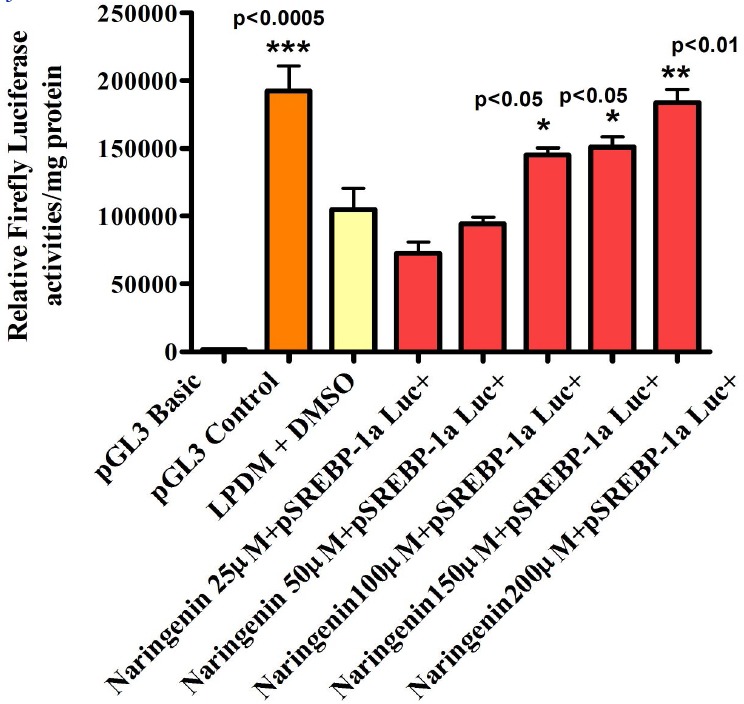
The Effect of Different Naringenin Concentrations in LPDM on the Activity of pSREBP-1a Luc+ in Human Hepatoma HepG2 Cells after 24h.
Figure 7.
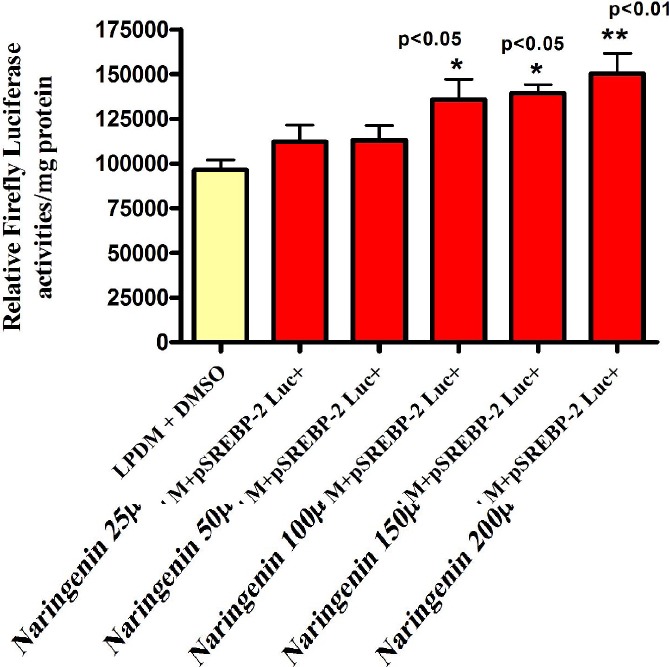
The Effect of Different Naringenin Concentrations in LPDM on the Activity of pSREBP-2 Luc+ in Human Hepatoma HepG2 Cells after 24h.
Statistical Analysis
The computer software program GraphPad Prism (GraphPad 4.01). (SAS Institute Inc., Cary, NC) was used for all data analysis. A one-way analysis of variance (ANOVA) was used to compare the significant differences between the groups. Post hoc Dunnett’s or Bonferroni’s Multiple Comparison. The Statistical significance was accepted if the null hypothesis was rejected with a p<0.05. Results were expressed as the mean ± SEM of separate experiments. All analyses were carried out with 95% confidence intervals.
Results
The SREBP-1a promoter sequence showing the PCR primer binding sites and the transfection factors binding-sites predicted by MatInpector® database (Genomatrix program). Forward primer and reverse primer are highlighted in pink. Restriction enzymes in black underlined. BamH I cut in the middle of the sequence and NcoI at the end in the reverse primer. The transcription start codon A being +1. HepG2 Cells were transfected with 1μg well human pSREBP-1a driving Firefly Luciferase activity using GeneJuice® transfection reagent .5mg/ml LPDM + 2μl/ml DMSO was used as vehicle. Cells were exposed to 25μM, 50μM, 100μM, 150μM and 200μM Naringenin in fresh 5mg/ml LPDM. After 24h incubation, cells were harvested for Luciferase and protein assays. The difference between the groups was evaluated by one-way ANOVA with Dunnett’s Multiple Comparisons Test. HepG2 Cells were transfected with 1 μg/well human pSREBP-2 driving Firefly Luciferase activity using GeneJuice® transfection reagent. 5mg/ml LPDM + 2μl/ml DMSO was used as vehicle. Cells were exposed to 25μM, 50μM, 100μM, 150μM and 200μM Naringenin in fresh 5mg/ml LPDM. After 24h incubation, cells were harvested for Luciferase and protein assays. The difference between the groups was evaluated by one-way ANOVA with Dunnett’s Multiple Comparisons Test.
Discussion
The regulation of hepatic catabolism of LDL-c relies on the activity of the LDL receptor (LDLr) to maintain steady-state plasma concentration of LDL-c in the body (Gong et al., 2006). In the human body, the liver is the most LDL-receptor abundant organ and accounts for 80-90% of the total LDL clearance in plasma (Gorinsteina et al., 2005). The identification of the transcription factors, the sterol regulatory element binding proteins (SREBPs), led to the understanding of cellular cholesterol homeostasis (Goto et al., 1997). In vivo, SREBPs are found to be crucial for the synthesis and clearance of atherogenic lipoproteins and also for the highly activated transcription of several genes including the LDLr (Graham and Russell, 1994). SREBPs are members of the basic helix-loop- helix-leucine zipper (bHLH-Zip) family of transcription factors that directly activate the transcription of more than 30 genes dedicated to the biosynthesis and uptake of cholesterol, fatty acid, triglycerides and phospholipids (Grundy, 1997).
To date, SREBP-1a, SREBP-1c and SREBP-2 are the three major SREBP isoforms to have been identified. They are synthesized in the liver as membrane-bound precursors to the endoplasmic reticulum and nuclear envelope (Chen et al., 2004). Low intracellular cholesterol concentration promotes the two-step proteolytic cleavage process of precursor SREBP-l and SREBP-2. As a result, the transcriptionally active SREBP migrates to the nucleus where it highly activates transcription of several genes involved in cholesterol and fatty acid synthesis (Clarke and Hardie, 1990). LDLr uptake of cholesterol and metabolism increase intracellular cholesterol which inhibits the release of mature SREBP resulting in suppression of LDLr transcription (Connor and Conoor, 1998). Deletion of the acidic NH2-terminal of SREBP which is the transcriptional activation domain prevented the transcriptional activation of the LDLr. High-level expression of LDLr is achieved when SREBP-l and SREBP-2 bind to the sterol response element-1 (SRE-1) sequence and interact with stimulating protein-1 (Sp1) in repeat 3 thereby reducing elevated levels of plasma cholesterol (Corsini et al., 1999).
In vivo studies revealed that SREBP-2 activated genes of cholesterol metabolism, whereas SREBP 1c activated genes of the fatty acid and triglyceride metabolism. However, SREBP-1a seemed to activate both pathways. Consumption of fruits and vegetables can protect against the development of cardiovascular diseases (Croston et al., 1997). Although plant flavonoids may have many biological properties such as anticancer, antiviral, antioxidant and lowering blood cholesterol, the mechanisms of action, in most cases have not been fully elucidated. Naringenin are found largely as the glycosides naringin and hesperidin, in grapefruit and oranges respectively, which are hydrolyzed to their active forms Naringenin by intestinal bacteria (Deon et al., 2005).
As the liver plays a major role in cholesterol and lipid metabolism, human hepatoma HepG2 cells, a human liver-derived cell line was used as a model to investigate the molecular mechanisms by which the citrus flavonoids, Naringenin regulate hepatic activity of genes associated with cholesterol and lipid metabolism.
Our project focuses on LDL cholesterol reduction mainly via LDLr up-regulation. Although the transcriptional regulation of the SREBP-1a, -1c, and -2 promoters were investigated, we mostly concentrated on SREBP-1a regulation because little is known about its regulation (Davis, 1993). It was found that LDLr expression was mainly regulated at the transcriptional level, therefore to investigate the molecular mechanism by which the citrus flavonoids, Naringenin, regulate the LDLr transcription; luciferase-reporter gene assays were performed to compare the transcriptional regulation of the SREBP-1a, -1c, and -2 promoters on the activity of LDLr gene. Human lipoprotein-deficient serum (LPDS) was used to maximize LDLr activity (Davis, 1995).
The preliminary experiments were carried out to examine the LDLr promoter sensitivity to the addition of cholesterol or lipoprotein deficient medium (LPDM). Transient transfection data revealed that LDLr promoter activity was significantly elevated in cells incubated in LPDM as compared to complete growth medium (GM) in HepG2 cells. This was in agreement with several studies which revealed that LDLr transcription activity was activated in the absence of sterols (Day et al., 2000). The effect of Naringenin in LPDM on regulating the activity of LDLr, SREBP-1a, SREBP-1c and SREBP-2 was dose-dependent with notable stimulation at 100μM and 200μM in HepG2 cells after 24h. 200μM concentration of Naringenin appeared to be potent in up-regulating all promoters investigated. As it was confirmed by cell viability assay that 200μM concentration of either flavonoid did not cause any harmful effect in HepG2 cells, we used it in all our experiments.
Time-course transient transfection data indicated that early significant activation of SREBP-1a promoter was observed after 3h incubation with 200μM Naringenin. However, the gene expression activity of all LDLr, SREBP-1a, SREBP-1c and SREBP- 2 were increased significantly after 24h incubation with 200μM Naringenin in Human Hepatoma HepG2 cells. Based on our findings we may suggest that only SREBP-1a and SREBP-2 are involved in the regulation of LDLr expression in HepG2 cells as previously reported by many studies (Dechaud et al., 1999). It would also appear that the SREBP-1c promoter is less likely to be involved in the regulation of LDLr expression in HepG2 cells since in previous studies elsewhere it selectively stimulated fatty acids synthesis and insulin induced glucose metabolism (Debose et al., 1999). The extremely low mean luciferase activity value of SREBP-1c promoter construct compared to other constructs used in the study could be explained by the reduced SREBP-1c mRNA expression and the undetectable band of SREBP-1c protein. These findings determined that both 200Mm Naringenin did not increase SREBP-1c promoter activity in Human Hepatoma HepG2 cells.
Thus, the increased promoter activity of SREBP-1c which was observed in our transfection experiments could be due to a defect in SREBP-1c promoter construct. Our results also indicate that 200μM Naringenin significantly decreased the activity of MTP promoter in Human Hepatoma HepG2 cells. It was reported that the sterol response element (SRE) in LDLr and MTP promoters can serve as an insulin response element which positively regulated the LDLr (Debose et al., 2001), while negatively regulating the MTP gene. This finding may lead us to suggest that 200μM Naringenin exhibit insulin- like effect on activating SREBP-1a and SREBP-2 which negatively regulate the activity of MTP promoter. Our transfection data also indicates that the PI3K inhibitors Wortmannin and LY294002 reduced the stimulated SREBP-1a promoter activity caused by 200μM Naringenin after 4h incubation in human hepatoma HepG2 cells. However, a similar effect was observed on SREBP-1a, SREBP-1c and SREBP-2 promoter activities at 24h in HepG2 cells. In addition, U0126 (MEK 1/2 inhibitor), Staurosporine (broad inhibitor of PKA, PKC and PKG) and KT5823 (PKG inhibitor) significantly altered the Naringenin induced stimulation on the activity of pSREBP-1a promoter in the absence or presence of Naringenin after 4h in HepG2 cells. The investigation of mRNA levels by Quantitative Real-Time (RT)-PCR (Taqman) assay in Human Hepatoma HepG2 cells revealed that 200μM Naringenin in LPDM significantly up-regulated the mRNA levels of both the SREBP- 1a and LDLr mRNA expressions after 4, 8, 12 and 24h, while the expression of SREBP-2 mRNA was significantly increased after 12 and 24h. However, the mRNA level of SREBP-1c was significantly down-regulated after 4, 8, 12 and 24h, while the fatty acid synthase mRNA expression was significantly decreased after 8h 12 and 24h. Both the HMG-CoA reductase and Acetyl-CoA Carboxylase-α mRNA expressions were also significantly decreased after 12 and 24h. Our results suggest that it is likely that the effects of both 200μM Naringenin on elevating LDLr mRNA are due to regulation of gene transcription by SREBP-la and SREBP-2 in HepG2 cells because in the absence of sterols, high-level expression of the LDLr was found to be achieved when SREBP-l and SREBP-2 bind to the SRE-1 sequence and interact with Sp1 in repeat 3.
In this study, it is possible that the suppression effect of Naringenin on hepatic SREBP-1c mRNA expression is associated with the reduction in mRNA expression of both acetyl-CoA carboxylase and fatty acid synthase since most of the literatures are in favour of this correlation as indicated previously. Furthermore, 200μM Naringenin in LPDM had no effect on SREBP-1a precursor form. However, they both caused a significant increase in the amount of SREBP-1a mature form which could be a result of phosphorylation by PI3K and ERK1/2. Thus, the effects of Naringenin upon the expression of the LDLr gene are likely to occur via increased expression at the mRNA level and increased maturation at the protein level, of the SREBP1a and SREBP-2 transcription factors.
References
- 1.Borradaile N. M, de Dreu L. E, Huff M. W. Inhibition of Net HepG2 Cell Apolipoprotein B Secretion by the Citrus Flavonoid Naringenin Involves Activation of Phosphatidylinositol 3- Kinase Independent of Insulin Receptor Substrate-1 Phosphorylation. Diabetes. 2003;52:2554–2561. doi: 10.2337/diabetes.52.10.2554. [DOI] [PubMed] [Google Scholar]
- 2.Chen G, Liang G, Ou J, Goldstein J. L, Brown M. S. Central role for liver X receptor in insulin-mediated activation of Srebp-1c transcription and stimulation of fatty acid synthesis in liver. Proceedings of the National Academy of Sciences. 2004;101:11245–11250. doi: 10.1073/pnas.0404297101. [DOI] [PMC free article] [PubMed] [Google Scholar]
- 3.Clarke P. R, Hardie D. G. Regulation of HMG-CoA reductase: identification of the site phosphorylated by the AMP-activated protein kinase in vitro and in intact rat liver. The EMBO Journal. 1990;9:2439–2446. doi: 10.1002/j.1460-2075.1990.tb07420.x. [DOI] [PMC free article] [PubMed] [Google Scholar]
- 4.Connor S. L, Connor W. E. ‘Pathogenic and protective nutritional factors in coronary heart disease’ in Current Perspectives on Nutrition and Health, Kenneth. In: Carroll K, editor. Montreal, Canada: McGill-Queen’s University Press; 1998. pp. 59–100. [Google Scholar]
- 5.Corsini A, Bellosta S, Baetta R, Fumagalli R, Paoletti R, Bernini F. Effect of Hesperetin and Naringenin on Hepatic Lipid Metabolism and Gene Expression. New insights intothe pharmacodynamic and pharmacokinetic properties of statins. Pharmacology & Therapeutics. 1999;84:413–428. doi: 10.1016/s0163-7258(99)00045-5. [DOI] [PubMed] [Google Scholar]
- 6.Croston G. E, Milan L. B, Marschke K. B, Reichman M, Briggs M. R. Androgen Receptor-Mediated Antagonism of Estrogen-Dependent Low Density Lipoprotein Receptor Transcription in Cultured Hepatocytes. Endocrinology. 1997;138:3779–3786. doi: 10.1210/endo.138.9.5404. [DOI] [PubMed] [Google Scholar]
- 7.Davies R. J. The mitogen-activated protein kinase signal transduction pathway. The Journal of Biological Chemistry. 1993;268:14553–14556. [PubMed] [Google Scholar]
- 8.Davis R. J. Transcriptional regulation by MAP kinases. Molecular Reproduction and Development. 1995;42:459–467. doi: 10.1002/mrd.1080420414. [DOI] [PubMed] [Google Scholar]
- 9.Day A. J, Canada F. J, Diaz J. C, Kroon P. A, Mclauchlan R, Faulds C. B, Plumb G. W, Morgan M. R. A, Williamson G. Dietary flavonoid and isoflavone glycosides are hydrolysed by the lactase site of lactase phlorizin hydrolase. FEBS Letters. 2000;468:166–170. doi: 10.1016/s0014-5793(00)01211-4. [DOI] [PubMed] [Google Scholar]
- 10.De’chaud H, Ravard C, Claustrat F, de la Perrie’re A. B, Pugeat M. Xenoestrogen interaction with human sex hormone-binding globulin (hSHBG) Steroids. 1999;64:328–334. doi: 10.1016/s0039-128x(98)00114-7. [DOI] [PubMed] [Google Scholar]
- 11.DeBose-Boyd R. A, Brown M. S, Wei-Ping Li Axel, Nohturfft Goldstein J. L, EspeNshade P. J. Transport-Dependent Proteolysis of SREBP: Relocation of Site-1 Protease from Golgi to ER Obviates the Need for SREBP Transport to Golgi. Cell. 1999;99:703–712. doi: 10.1016/s0092-8674(00)81668-2. [DOI] [PubMed] [Google Scholar]
- 12.DeBose-Boyd R. A, Ou J, Goldstein J. L, Brown M. S. Expression of sterol regulatory element-binding protein 1c (SREBP-1c) mRNA in rat hepatoma cells requires endogenous LXR ligands. National Academy of Sciences (PNAS) 2001;98:1477–1482. doi: 10.1073/pnas.98.4.1477. [DOI] [PMC free article] [PubMed] [Google Scholar]
- 13.D’Eon T. M, Souza S. C, Aronovitz M, Obin M. S, Fried S. K, Greenberg A. S. Estrogen Regulation of Adiposity Fuel Partitioning. Evidence of Genomic and Non-genomic Regulation of Lipogenic Oxidative Pathways. The Journal of Biological Chemistry. 2005;280:35983–35991. doi: 10.1074/jbc.M507339200. [DOI] [PubMed] [Google Scholar]
- 14.Erlund I, Meririnne E, Alfthan G, Aro A. Plasma Kinetics and Urinary Excretion of the Flavanones Naringenin and Hesperetin in Humans after Ingestion of Orange Juice Grapefruit Juice. Journal of Nutrition. 2001;131:235–241. doi: 10.1093/jn/131.2.235. [DOI] [PubMed] [Google Scholar]
- 15.Espenshade P. J. SREBPs: sterol regulated transcription factors. Cell Science. 2006;119:973–976. doi: 10.1242/jcs.02866. [DOI] [PubMed] [Google Scholar]
- 16.Ettinger S. ‘Macronutrients: Carbohydrates, Proteins, and Lipids’ in Krause’s. In: Mahan L. K, Escott-Stump S, editors. Food, Nutrition, and Diet Therapy. 11th edition. W. B. Saunders Company; USA: 2004. pp. 51–62. [Google Scholar]
- 17.Fernández-Álvareza A, Turb G, López-Rodasb G, Casadoa M. Reciprocal regulation of the human sterol regulatory element binding protein (SREBP)-1a promoter by Sp1 andEGR-1 transcription factors. Federation of European Biochemical Societies. 2008;582:177–184. doi: 10.1016/j.febslet.2007.11.083. [DOI] [PubMed] [Google Scholar]
- 18.Fleischmann M, Iynedjian P. B. Regulation of sterol regulatory-element binding protein 1 gene expression in liver: role of insulin and protein kinase B/cAkt. Biochemical Society. 2000;349:13–17. doi: 10.1042/0264-6021:3490013. [DOI] [PMC free article] [PubMed] [Google Scholar]
- 19.Flier J. S, Hollenberg A. N. ADD-1 provides major new insight into the mechanism of insulin action. National Academy of Sciences (PNAS) 1999;96:14191–14192. doi: 10.1073/pnas.96.25.14191. [DOI] [PMC free article] [PubMed] [Google Scholar]
- 20.Foretz M, Guichard C, Ferre P, Foufelle F. Sterol regulatory element binding protein-1c is a major mediator of insulin action on the hepatic expression of glucokinase and lipogenesis related genes. Proceedings of the National Academy of Sciences. 1999;96:12737–12742. doi: 10.1073/pnas.96.22.12737. [DOI] [PMC free article] [PubMed] [Google Scholar]
- 21.Fung T. T, Willett W. C, Stampfer M. J, Manson J. E, Hu F. B. Dietary Patterns and the Risk of Coronary Heart Disease in Women. Arch Intern Med. 2001;161:1857–1862. doi: 10.1001/archinte.161.15.1857. [DOI] [PubMed] [Google Scholar]
- 22.Gierens H, Nauck M, Roth M, Schinker R, Schu’rmann C, Scharnagl H, Neuhaus G, Wieland H, Ma’rz W. Interleukin-6 Stimulates LDL Receptor Gene Expression via Activation of Sterol-Responsive and Sp1 Binding Elements. Arterioscler Thromb Vasc Biol. 2000;20:1777–1783. doi: 10.1161/01.atv.20.7.1777. [DOI] [PubMed] [Google Scholar]
- 23.Glass C. K, Witztum J. L. Atherosclerosis: The Road Ahead. Cell. 2001;104:503–516. doi: 10.1016/s0092-8674(01)00238-0. [DOI] [PubMed] [Google Scholar]
- 24.Gleeson A, Anderton K, Owens D, Bennett A, Collins P, Johnson A, White D, Tomkin G. H. The Role of microsomal triglyceride transfer protein and dietary cholesterol in chylomicron production in diabetes. Diabetologia. 1999;42:944–948. doi: 10.1007/s001250051252. [DOI] [PubMed] [Google Scholar]
- 25.Goldstein J. L, Brown M. S. Binding and degradation of low density lipoprotein by cultured human fibroblasts. The Journal of Biological Chemistry. 1974;249:5153–5162. [PubMed] [Google Scholar]
- 26.Goldstein J. L, Brown M. S. Regulation of the mevalonate pathway. Nature. 1990;343:425–430. doi: 10.1038/343425a0. [DOI] [PubMed] [Google Scholar]
- 27.Goldstein J. L, Basu S. K, Brown M. S. Receptor-mediated endocytosis of low-density lipoprotein in cultured cells. Methods Enzymol. 1983;98:241–260. doi: 10.1016/0076-6879(83)98152-1. [DOI] [PubMed] [Google Scholar]
- 28.Goldstein J. L, DeBose-Boyd R. A, Brown M. S. Protein Sensors for Membrane Sterols. Cell. 2006;124:35–46. doi: 10.1016/j.cell.2005.12.022. [DOI] [PubMed] [Google Scholar]
- 29.Goldstein J. L, Rawson R. B, Brown M. S. Mutant Mammalian Cells as Tools to Delineate the Sterol Regulatory Element-Binding Protein Pathway for Feedback Regulation of Lipid Synthesis. Archives of Biochemistry and Biophysics. 2002;397:139–148. doi: 10.1006/abbi.2001.2615. [DOI] [PubMed] [Google Scholar]
- 30.Gong Y, Lee J. N, Brown M. S, Goldstein J. L, Ye J. Juxtamembranous aspartic acid in Insig-1 and Insig-2 is required for cholesterol homeostasis. Proc. Natl. Acad. Sci. USA. 2006;103:6154–6159. doi: 10.1073/pnas.0601923103. [DOI] [PMC free article] [PubMed] [Google Scholar]
- 31.Gorinsteina S, Leontowicz H, Leontowicz M, Drzewiecki J, Jastrzebski Z, Tapia Ma. S, Katricha E, Trakhtenberg S. Red Star Ruby (Sunrise) and blond qualities of Jaffa grapefruits and their influence on plasma lipid levels and plasma antioxidant activity in rats fed with cholesterol-containing and cholesterol-free diets. Life Sciences. 2005;77(77):2384–2397. doi: 10.1016/j.lfs.2004.12.049. [DOI] [PubMed] [Google Scholar]
- 32.Goto D, Okimoto T, Ono M, Shimotsu H, Abe K, Tsujita Y, Kuwano M. Upregulation of Low Density Lipoprotein Receptor by Gemfibrozil, a Hypolipidemic Agent in Human Hepatoma Cells Through Stabilization of m RNA Transcripts. Arteriosclerosis, Thrombosis, and Vascular Biology. 1997;17:2707–2712. doi: 10.1161/01.atv.17.11.2707. [DOI] [PubMed] [Google Scholar]
- 33.Graham A, Russell L. J. Stimulation of low-density lipoprotein uptake in HepG2 cells by epidermal growth factor via a tyrosine kinase-dependent, but protein kinase Cindependent, mechanism. Biochem J. 1994;298:579–584. doi: 10.1042/bj2980579. [DOI] [PMC free article] [PubMed] [Google Scholar]
- 34.Grundy S. M. cholesterol and Coronary Heart Disease. The 21st Century. Arch Intern Med. 1997;157:1177–1184. [PubMed] [Google Scholar]


