

Abstract
This study tests the hypothesis that combined melatonin and exogenic adipose mesenchymal stem cell (ADMSC)-derived exosome treatment offers superior protection against liver ischemia-reperfusion (LIR) injury compared to either alone. In vitro studies utilized a macrophage cell line (RAW) pretreated with lipopolysaccharide and hepatocytes pretreated with melatonin or exosomes before hypoxia treatment, while in vitro experiments involved analyses of liver specimens from male adult Sprague-Dawley rats (n = 50) equally categorized into sham controls (SC), LIR only, LIR-exosome (100 µg, 30 minute post-LIR), LIR-melatonin (20 mg/kg, 30 minute post-LIR and 50 mg/kg at 6 and 18 hours post-LIR), and LIR-exosome-melatonin groups. In vitro studies showed suppression of inflammation (MIF, MMP-9, IL-1β, TNF-α, COX-2) and oxidative stress (NOX-1, NOX-2, oxidized protein)/apoptosis (cleaved caspase 3 and PARP) by exosome and exosome/melatonin treatment, respectively (all P<0.001). In vivo data demonstrated lowest liver injury score and plasma AST concentrations in LIR-exosome-melatonin group compared with other groups (P<0.001). Besides, expressions of inflammatory markers at protein (ICAM-1, IL-1β, MMP-9, TNF-α, NF-κB, RANTES) and cellular (CD3+, CD4+, CD8+, CD161+, CD11+, CD14+, F4/80) levels, and protein expressions of apoptosis (cleaved caspase-3, PARP), oxidative stress (NOX-1, NOX-2), DNA damage (γ-H2AX) and mitochondrial damage (cytosolic cytochrome-C) markers displayed a pattern similar to that of liver injury score, whereas protein expression of anti-oxidants (HO-1, NQO-1) showed progressive increase from SC to the combined treatment group (all P<0.001). In conclusion, combined exosome-melatonin regimen was superior to either alone in protecting the liver against ischemia-reperfusion injury.
Keywords: Exogenic exosomes, melatonin, liver ischemia-reperfusion injury, inflammation, oxidative stress, immunomodulation, anti-oxidant
Introduction
Liver ischemia-reperfusion (LIR) injury, which is encountered in various clinical situations including prolonged cardiopulmonary cerebral resuscitation (CPCR), hypovolemic shock from hemorrhage or dehydration, septic shock, severe congestive heart failure associated with cardiogenic shock, and during major hepatic resection or liver transplantation when occlusion of the hepatic vascular supplies (i.e. Pringle’s maneuver) or complete severance of hepatic vascular supply is necessary [1-3], has been identified as a major cause of hepatic failure. Although advances in critical care for patients with acute hepatic failure have improved the survival rate, the in-hospital morbidity and mortality remain high [1-6]. Therefore, it is of utmost importance to both clinician and medical researchers to find a safe and efficacious therapeutic modality for patients with acute hepatic failure refractory to conventional treatment.
The underlying mechanisms involved in LIR injury-associated liver failure have been extensively investigated. It has been reported that the generation of free radicals and inflammatory responses as well as the subsequent cascade of immune reactions, mitochondrial damage, and derangement of hepatic microvasculature are all significant contributors to acute liver damage [7-12]. It is, therefore, reasonable to believe that a therapeutic option that could effectively abrogate the inflammatory reactions, the over-reactive immune responses, and the generation of free radicals would offer significant benefit to patients at the acute phase of hepatic failure.
Exosomes, which are 30-120 nm endocytic membrane-derived vesicles physiologically released by all cell types and present in all body fluids, have been found to be key vehicles for the delivery of membrane-enclosed signaling molecules and gene products including protein, mRNA, and microRNA that may serve as important modulators for intercellular communications [13-16]. Growing data have shown that mesenchymal stem cell-, dendritic cell- and regulatory T cell-derived exosomes possess anti-inflammatory, anti-apoptotic, immunomodulatory, and pro-angiogenic properties [17-21].
On the other hand, melatonin, which is a ubiquitous hormone found in animals, plants, fungi and bacteria, has also been keenly investigated. Its role as a potent free radical scavenger with capacity of alleviating oxidative stress [22-24] and inflammatory reactions [25,26] as well as its stabilizing effect on cell membranes [25] that renders them less susceptible to inflammatory, oxidative, and LIR injury have been well documented [22-27].
Since it is widely recognized that the underlying mechanisms of acute LIR injury involve multiple signaling pathways, including inflammation, free radical production, mitochondrial damage associated with generation of oxidative stress [7-12], single therapy would be inferior to a combined regimen for protecting against acute LIR injury. Beside conventional treatment approaches, a number of studies have revealed that melatonin has beneficial therapeutic effect against LIR injury [26,28,29]. Additionally, combined therapy has been found to be a promising therapeutic option for experimental acute lung injury and LIR injury [27,29]. Therefore, based on the reported actions of exosomes [17-21] and melatonin [26-29] that are similar but yet different, it is rational to believe that combined therapy with melatonin and adipose mesenchymal stem cell (ADMSC)-derived exosomes may offer complementary and superior protection against LIR injury compared with either alone.
Materials and methods
In vitro study for assessment of anti-inflammatory and anti-oxidative properties of mini-pig ADMSC-derived exosomes
The purpose of utilizing ADMSCS-derived exosomes from mini-pigs for the treatment of rat acute LIR injury was to verify the intrinsic capacity of anti-inflammation and anti-oxidative stress of xenogenic exosomes. The specific purposes and procedures of the in vitro studies are: (1) To determine the suppressive effect of exosomes on inflammatory reaction, a macrophage cell line (1.0 × 10⁵) (RAW 264.7 purchased from ATCC) was cultured with lipopolysaccharide (LPS) (100 ng/mL) for 30 minutes. The cells were washed with PBS, followed by co-culturing with exosomes (50 µM) for 6 or 12 hours, and (2) To assess the impact of exosomes and melatonin on oxidative stress and apoptosis, hepatocytes were pretreated with melatonin or exosomes for 3 hours, followed by culturing in hypoxic condition (1% O2, 5% CO2 and 94% N2) for 12 hrs in hypoxia chamber.
Ethics on animal use
Male adult Sprague-Dawley (SD) rats were purchased from Charles River Technology, BioLASCO Taiwan Co., Ltd., Taiwan, and housed in an Association for Assessment and Accreditation of Laboratory Animal Care International (AAALAC)-approved animal facility in our hospital with controlled temperature (24°C), humidity (50%-70%), and light cycle (12/12) for 2 weeks before experimentation. All procedures of the study were approved by the Institute of Animal Care and Use Committee of Kaohsiung Chang Gung Memorial Hospital (IACUC No. 20122101) and performed in accordance with the Guide for the Care and Use of Laboratory Animals [The Eighth Edition of the Guide for the Care and Use of Laboratory Animals (NRC 2011)].
Animal grouping, liver ischemia-reperfusion procedure and treatment strategy
Pathogen-free, adult male SD rats (n = 50) weighing 325-350 g were randomly divided into five groups: group 1 [sham-operated control (SC) receiving laparotomy only, plus systemic venous administration of fresh culture medium (DMEM) immediately and at 0.5, 6 and 18 hours after operation], group 2 [LIR only, i.e., left liver lobe ischemia for 60 minutes followed by reperfusion for 72 hours, plus systemic venous administration of fresh culture medium (DMEM) immediately, 0.5, 6, and 18 hours after reperfusion], group 3 [LIR with intravenous administration of 100 µg exosomes (LIR-Ex)], group 4 [(LIR+intra-peritoneal administration of melatonin 20 mg/kg at 0.5 hours after LIR and 50 mg/kg at 6 and 18 hours after LIR (LIR-Mel)], and group 5 [LIR+exosomes+melatonin (LIR-Ex-Mel)]. The dosage and time points of melatonin administration at 30 minutes and 6 and 18 hours after LIR were based on our recent report [27,30] with some modifications. Similarly, the exosome dosage was based on our recent report with minimal modification [31]. The procedure and protocol of acute LIR injury have been described in details in our previous report [32]. Briefly, the left lobe liver was dissected free from the surrounding ligaments. Hepatic ischemia was induced by obstructing the vessels by placing a 4-0 silk loop around the hilar region of the left liver lobe in group 2 to group 5 rats, whereas group 1 animals received only laparotomy without undergoing hepatic ischemia. Reperfusion was started 60 minutes later when the hilar occlusion was released.
All animals were euthanized 72 hours after reperfusion. Blood samples were collected before and after the experiments and plasma specimens were harvested for analyses of aspartate aminotransferase (AST) concentration and circulating levels of inflammatory cytokines as well as markers for apoptosis, mononuclear cells, and immune cells. Liver specimens were acquired and then stored at -80°C for analyses of protein and mRNA expressions. Tissues were also embedded in OCT or 4% buffered formaldehyde for cryo-sectioning and paraffin sectioning, respectively.
Procedure and protocol for isolation and culturing of adipose-derived mesenchymal stem cells (ADMSCs), exosome protein quantification, characterization, and preparation
The procedure and protocol of ADMSC isolation and culture have been described in details in our recent reports [30,32]. Briefly, abdominal adipose tissue of six mini-pigs (about 16-18 kg) was carefully dissected and excised. ADMSCs were automatically isolated using KISO™ System (Keai Bioresearch, BC, Canada). For the purpose of purification, the harvested cells were cultured in a 100 mm diameter dish with MEM-α culture medium containing 10% FBS for 14 days. By day 14 after cell culture, flow cytometric analysis was performed for checking the purity of the ADMSC population (Figure 1).
Figure 1.

Flow cytometric quantification of adipose-derived mesenchymal stem cells (ADMSCs), morphological features of ADMSCs and exosomes. A: Flow cytometric identification of ADMSCs through quantification of the expression of surface markers including CD90, CD105, CD29, and CD217 as well as marker of hematopoietic stem cell, CD45, prior to cell culture (i.e., day 0). B: Flow cytometric analysis of markers of ADMSCs, including CD90, CD105, CD29, and CD217 as well as hematopoietic stem cell marker CD45 after cell culture (i.e., day 14). C: Spindle-shaped cells on light microscopy (100x and 200x, respectively) typical of ADMSC at day 14 after cell culture. D: Statistical analysis of the percentage of stem cell population prior to vs. after cell culture (n = 6). For CD90+ cell, * vs. day 0, P<0.0001; for CD105+ cells, † vs. day 0, P<0.0001; for CD29+ cells, ‡ vs. day 0, P<0.0001; for CD217+ cells, § vs. day 0, P<0.001; for CD45+ cells, ¶ vs. day 0, P<0.0001. E: Transmission electronic microscopy showing the morphological feature of exosomes with diameter ranging from 30-100 nm.
The procedures for isolation of exosomes from culture medium have been described in details in our recent report [31]. Briefly, the exosomes were isolated from the culture medium of ADMSCs and were pooled for electron microscopic assessment, protein separation and characterization, as well as western blot analysis. The proteins in Dulbecco’s Modified Eagle Medium (DMEM) (Gibco) supplemented with 10% serum before and after cell culture were separated by sodium dodecyl sulfate-polyacrylamide gel electrophoresis (SDS-PAGE). The exosomes in DMEM were purified and the proteins in different exosome fractions (1 μg, 2 μg, 10 μg, and 50 μg) were also separated by SDS-PAGE. The gel was stained with Coomassie blue for analysis. The following primary antibodies were used: mouse monoclonal anti-CD63 (Santa Cruz Biotechnology), rabbit polyclonal anti-tumor susceptibility gene-101 (TSG101) (Abcam), and anti-β-catenin (Abcam).
Isolation of mitochondria
The rat livers were excised after IR and washed with buffer A (100 mM Tris-HCl, 70 mM sucrose, 10 mM EDTA, and 210 mM mannitol, pH 7.4). After homogenization and centrifugation [14], the mitochondria-rich pellets were collected and stored at -70°C.
Histological assessment of liver injury
The criteria for scoring liver injury have been defined in our previous report [32]. Briefly, after hematoxylin and eosin staining of the liver sections, the degree of liver injury was assessed with liver injury score defined as follows: 0-No notable hepatocyte integrity impairment or sinusoidal distortion; 1-Mild hepatic injury with less than 25% of section involved; 2-Moderate hepatic injury with 25-50% of section involved; 3-Severe hepatic injury with more than 50% involved. For each rat, three liver sections were examined and three randomly selected HPFs (100 ×) were analyzed in each section. The mean score for each animal was then determined by summation of all numbers divided by 9.
Flow cytometric quantification of early and late apoptosis of circulating mononuclear cells and helper T cells and cytotoxic T cells
The procedure and protocol of flow cytometry for identification and quantification of circulating and splenic immune cells were based on our previous report [33]. Briefly, prior to sacrificing the animals, the peripheral blood mononuclear cells (PBMCs) and splenocytes were obtained from the tail vein using a 27# needle. PBMCs and splenocytes (1.0 × 10⁶ cells) were triple-stained with FITC-anti-CD3 (BioLegend), PE-anti-CD8a (BD Bioscience), and PE-Cy™5 anti-CD4 (BD bioscience). The numbers of CD3+CD4+ helper T cells and CD3+CD8+ cytotoxic T cells were analyzed using flow cytometry (FC500, Beckman Coulter).
Assessment of PBMC apoptosis by flow cytometry
The procedure and protocol for determining circulating level of mononuclear cells has been reported in details in our previous studies [33]. Briefly, 3 mL of blood was drawn from left ventricle prior to euthanization of animals into a vacutainer containing 3.8% buffered sodium heparin. Mononuclear cells (MNCs) were then isolated by density-gradient centrifugation of Ficoll 400 (Ficoll-PlaqueTM plus, Amersham Biosciences, Sweden).
Annexin V kit (Pharmingen, Becton Dickinson, San José, CA, USA) was used for apoptosis analysis according to the manufacturer’s instructions. The supernatant was decanted and the pellet was resuspended in 200 μL of 1 × annexin V binding buffer. Cells were incubated with 2 μL of annexin V-FITC and 5 μL of propidium iodide (PI) for 15 minutes at room temperature in the dark. Finally, 500 μL of 1 × annexin V-binding buffer was added, followed by immediate flow cytometric analysis [i.e., the percentages of viable and apoptotic cells were determined by flow cytometry using double staining of annexin V and propidium iodide (PI) (Figure 4)]. This is a simple and popular method for the identification of apoptotic cells (i.e. early [annexin V+/PI-] and late [annexin V+/PI+] phases of apoptosis).
Figure 4.
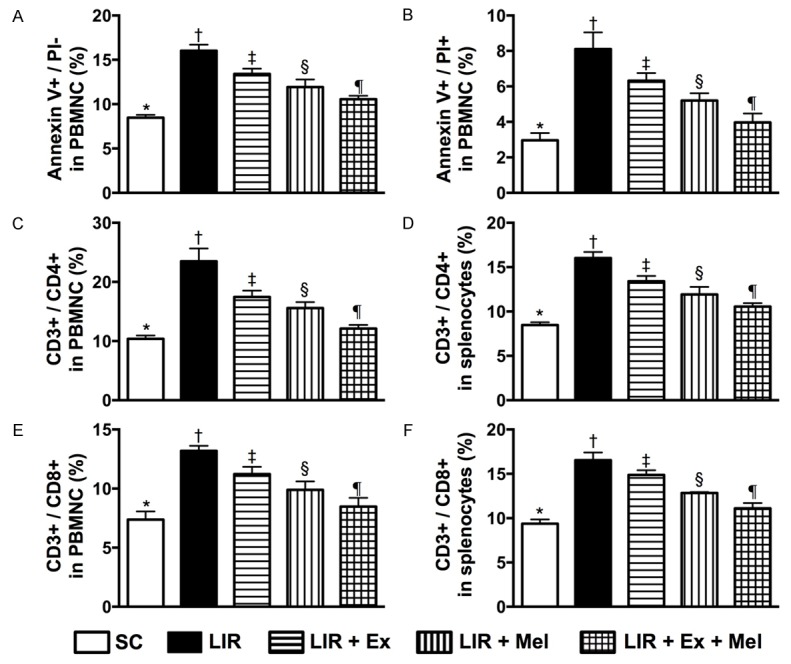
Flow cytometric identification of prevalence of early and late apoptotic mononuclear cells and immune cells in circulation and spleen 72 hours after reperfusion. A: Number of early (annexin V+/PI-) apoptotic peripheral blood mononuclear cells (PBMNCs). Analytical results, * vs. other groups with different symbols (†, ‡, §, ¶), P<0.0001. B: Number of late (annexin V+/PI+) apoptotic PBMNCs. Analytical results, * vs. other groups with different symbols (†, ‡, §, ¶), P<0.0001. C: Circulating CD3+/CD4+ helper T cells, * vs. other groups with different symbols (†, ‡, §, ¶), P<0.0001. D: Splenic CD3+/CD4+ helper T cells, * vs. other groups with different symbols (†, ‡, §, ¶), P<0.0001. E: Circulating CD3+/CD8+ cytotoxic T cells, * vs. other groups with different symbols (†, ‡, §, ¶), P<0.0001. F: Splenic CD3+/CD8+ cytotoxic T cells, * vs. other groups with different symbols (†, ‡, §, ¶), P<0.0001. All statistical analyses were performed by one-way ANOVA, followed by Bonferroni multiple comparison post hoc test (n = 10 for each group). Symbols (*, †, ‡, §, ¶) indicate significant differences (at 0.05 level). SC = sham control; LIR = liver ischemia reperfusion; Ex = exosome; Mel = melatonin.
Immunohistochemical (IHC) and immunofluorescent (IF) staining
The procedure and protocol of IF staining have been described in details in our previous reports [27,30-33]. For IHC and IF staining, rehydrated paraffin sections were first treated with 3% H2O2 for 30 minutes and incubated with Immuno-Block reagent (BioSB) for 30 minutes at room temperature. Sections were then incubated with primary antibodies specifically against F4/80 (1:100, Abcam), CD11 (1:200, Abcam), CD14 (1:300, Bioss), CD161 (1:400, AbD Serotec), CD3 (1:400, Abcam), CD4 (1:200, Novus Biologicals), CD8 (1:200, AbD Serotec), and H2DCFDA while sections incubated with irrelevant antibodies served as controls. Three sections of liver specimen from each rat were analyzed. For quantification, three randomly selected HPFs (200 × or 400 × for IHC and IF studies) were analyzed in each section. The mean number of positively-stained cells per HPF for each animal was then determined by summation of all numbers divided by 9.
Western blot analysis
The procedure and protocol for Western blot analysis were based on our recent reports [27,30-33]. Briefly, equal amounts (50 μg) of protein extracts were loaded and separated by SDS-PAGE using acrylamide gradients. After electrophoresis, the separated proteins were transferred electrophoretically to a polyvinylidene difluoride (PVDF) membrane (Amersham Biosciences). Nonspecific sites were blocked by incubation of the membrane in blocking buffer [5% nonfat dry milk in T-TBS (TBS containing 0.05% Tween 20)] overnight. The membranes were incubated with the indicated primary antibodies [cleaved poly ADP ribose polymerase (PARP) (1:1000, Cell Signaling), matrix metalloproteinase (MMP)-9 (1:3000, Abcam), TNF-α (1:1000, Cell Signaling), nuclear factor (NF)-κB (1:600, Abcam), intercellular adhesion molecule (ICAM)-1 (1:1000, Abcam), interleukin (IL)-1β (1:1000, Cell Signaling), IL-10 (1:1000, Abcam), RANTES (1:1000, Cell Signaling), NOX-1 (1:1500, Sigma), NOX-2 (1:750, Sigma), Bcl-2 (1:2000, Abcam), γ-H2AX (1:1000, Cell Signaling), cytosolic cytochrome C, mitochondrial cytochrome C (1:1000, BD), heme oxygenase (HO)-1 (1:500, Calbiochem), quinone oxidoreductase (NQO) 1 (1:1000, Abcam), and actin (1:10000, Millipore)], for 1 hour at room temperature. Horseradish peroxidase-conjugated anti-rabbit immunoglobulin IgG (1:2000, Cell Signaling) was used as a secondary antibody for one-hour incubation at room temperature. The washing procedure was repeated eight times within one hour. Immunoreactive bands were visualized by enhanced chemiluminescence (ECL; Amersham Biosciences) and exposed to Biomax L film (Kodak). For the purpose of quantification, ECL signals were digitized using Labwork software (UVP).
Assessment of oxidative stress reaction
The procedure and protocol for assessing the protein expression of oxidative stress have been described in details in our previous reports [27,30-33]. The Oxyblot Oxidized Protein Detection Kit was purchased from Chemicon (S7150). DNPH derivatization was carried out on 6 μg of protein for 15 minutes according to the manufacturer’s instructions. One-dimensional electrophoresis was carried out on 12% SDS/polyacrylamide gel after DNPH derivatization. Proteins were transferred to nitrocellulose membranes which were then incubated in the primary antibody solution (anti-DNP 1:150) for 2 hours, followed by incubation in secondary antibody solution (1:300) for 1 hour at room temperature. The washing procedure was repeated eight times within 40 minutes. Immunoreactive bands were visualized by enhanced chemiluminescence (ECL; Amersham Biosciences) which was then exposed to Biomax L film (Kodak). For quantification, ECL signals were digitized using Labwork software (UVP). For oxyblot protein analysis, a standard control was loaded on each gel.
Statistical analysis
Quantitative data are expressed as means ± SD. Statistical analysis was adequately performed by ANOVA followed by Bonferroni multiple-comparison post hoc test. SAS statistical software for Windows version 8.2 (SAS institute, Cary, NC) was utilized. A probability value <0.05 was considered statistically significant.
Results
Flow cytometric quantification and examination of morphological features of ADMSCs and exosomes (Figure 1)
Figure 1 illustrates the results of flow cytometric analysis of ADMSCs (Figure 1A, 1B) and their morphology (Figure 1C) prior to and after 14 days of cell culture, showing predominance of CD90+ and CD105+ cells. The populations of CD90+, CD105+, CD29+, and CD217+ cells were significantly higher at post-culture day 14 than those prior to cell culture (Figure 1D). On the other hand, the number of CD45+ cells (i.e., hematopoietic stem cell) was significantly lower at post-culture day 14 than that prior to cell culture (Figure 1D). Additionally, transmission electron microscopy identified small vesicles with the diameter range of exosomes (30-100 nm) isolated from the culture medium of ADMSCs through ultracentrifugation (Figure 1E).
Effect of exosomes on inflammation and oxidative stress (Figures 2 and 3)
Figure 2.
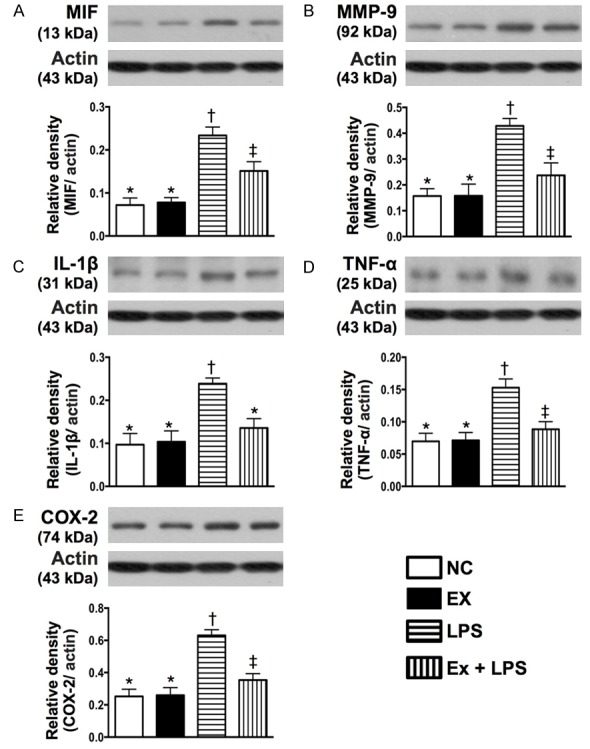
Protein expressions of inflammatory biomarkers of macrophage under lipopolysaccharide (LPS) stimulation in response to exosome treatment in vitro. A: Protein expression of macrophage migration inhibitory factor (MIF), * vs. other groups with different symbols (†, ‡), P<0.001. B: Protein expression of matrix metalloproteinase (MMP)-9, * vs. other groups with different symbols (†, ‡), P<0.001. C: Protein expression of interleukin (IL)-1β, * vs. other groups with different symbols (†, ‡), P<0.001. D: Protein expression of tumor necrosis factor (TNF)-α, * vs. †, P<0.001. E: Protein expression of COX-2, * vs. other groups with different symbols (†, ‡), P<0.001. All statistical analyses were performed by one-way ANOVA, followed by Bonferroni multiple comparison post hoc test (n = 6 for each group). Symbols (*, †, ‡) indicate significant differences (at 0.05 level). NC = normal control; LPS = lipopolysaccharide.
Figure 3.

Protein expressions of apoptosis and oxidative stress biomarkers in hepatocytes under hypoxic stimulation in response to melatonin and exosome treatment in vitro. A: Protein expression of cleaved caspase (c-Casp) 3, * vs. other groups with different symbols (†, ‡, §), P<0.001. B: Protein expression of cleaved poly ADP ribose polymerase (c-PARP), * vs. other groups with different symbols (†, ‡, §), P<0.001. C: Protein expression of NOX-1, * vs. other groups with different symbols (†, ‡, §), P<0.001. D: Protein expression of NOX-2, * vs. other groups with different symbols (†, ‡, §), P<0.001. E: Oxidized protein expression, * vs. other groups with different symbols (†, ‡, §), P<0.0001. (Note: left and right lanes shown on the upper panel represent protein molecular weight marker and control oxidized molecular protein standard, respectively). MW = molecular weight; DNP = 1-3 dinitrophenylhydrazone. All statistical analyses were performed by one-way ANOVA, followed by Bonferroni multiple comparison post hoc test (n = 6 for each group). Symbols (*, †, ‡, §) indicate significant differences (at 0.05 level). NC = normal control.
In vitro study demonstrated that the protein expressions of MIF, MMP-9, IL-1β, TNF-α, COX-2 (i.e., five indicators of inflammation) in cultured macrophages were significantly higher in the LPS-treated group than those in the control group and LPS-treated+exosome group at 12 hours of cell culturing, and significantly higher in LPS-treated+exosome group than those in the control group (Figure 2). Likewise, 12 hours after hypoxic cell culturing, the protein expressions of cleaved caspase 3 and PARP, two indicators of apoptosis, and the protein expressions of NOX-1, NOX-2, and oxidized protein, three indicators of oxidative stress in hepatocytes, were highest in the hypoxic group and lowest in the control group, and significantly higher in hypoxia+exosome (50 µM) group than those in hypoxia+melatonin (50 µM) group (Figure 3). The results of in vitro studies, therefore, imply that xenogenic exosomes possess intrinsic capacity of suppressing inflammation, apoptosis, and oxidative stress.
Flow cytometric characterization and quantification of peripheral blood mononuclear cell (PBMNC) apoptosis, and circulating and splenic immune cells 72 hours after reperfusion (Figure 4)
After 72 hours of liver reperfusion, flow cytometic analysis showed that the numbers of early and late apoptotic PBMNC were highest in group 2 (LIR only) and lowest in group 1 (SC), significantly higher in groups 3 (LIR-Ex) and 4 (LIR-Mel) than those in group 5 (LIR-Ex-Mel), and significantly higher in group 3 than those in group 4. Besides, the circulating and splenic numbers of CD3+/CD4+ helper T cells and CD3+/CD8+ cytotoxic T cells exhibited an identical pattern to that of PBMNC apoptosis among the five groups. The in vivo findings once again suggest that xenogenic exosomes not only possess anti-inflammatory but also process immunomodulatory and anti-apoptotic properties. In this experimental setting, combined treatment with exosomes and melatonin exerted an additive suppressive effect on apoptosis and immune reactivity.
Effect of exosomes and melatonin on the preservation of hepatocyte and liver histological integrity 72 hours after reperfusion (Figure 5)
Figure 5.
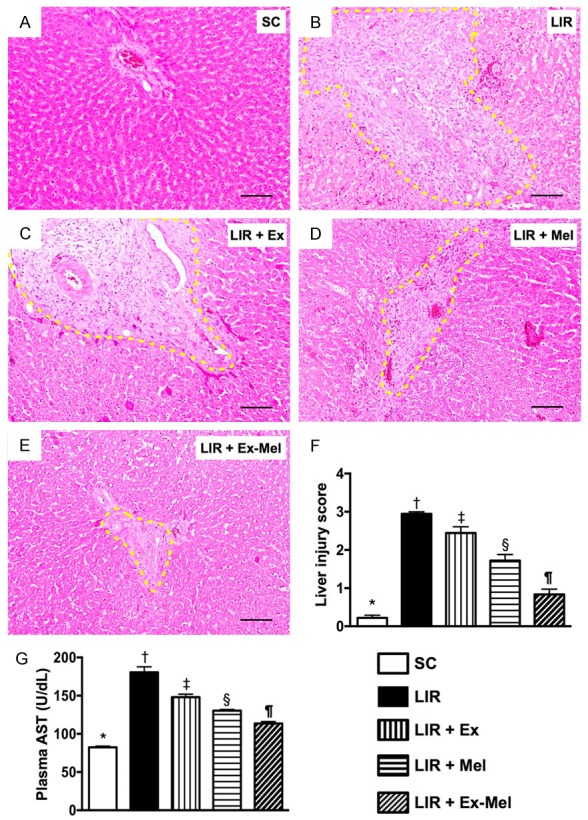
Exosome-melatonin treatment on preservation of hepatocyte and liver histological integrity 72 hours after reperfusion. (A to E) Hematoxylin and eosin (H&E) staining (100 x) for assessing hepatic damage at 72 hour after reperfusion. Note remarkable histological damage (bound by yellow dotted lines) in animals without exosome (Ex)-melatonin (Mel) treatment (B) compared to that in sham-operated controls (A) and in animals having received treatment with Ex (C), Mel (D) or Ex-Mel (E). Scale bars at right lower corners represent 100 µm. (F) Liver injury scores of different groups, * vs. other groups with different symbols (†, ‡, §, ¶), P<0.0001. (G) Circulating level of aspartate aminotransferase (AST), * vs. other groups with different symbols (†, ‡, §, ¶), P<0.0001. All statistical analyses were performed by one-way ANOVA, followed by Bonferroni multiple comparison post hoc test (n = 10 for each group). Symbols (*, †, ‡, §, ¶) indicate significant differences (at 0.05 level). SC = sham control; LIR = liver ischemia reperfusion; Ex = exosome; Mel = melatonin.
By the end of 72 hours after reperfusion, the circulating level of AST, an indicator of hepatocyte integrity, was highest in group 2 and lowest in group 1, significantly higher in group 3 than that in groups 4 and 5, and significantly higher in group 4 than that in group 5. Moreover, the liver injury score correlated well with the change in AST level.
Suppressive effect of exosomes and melatonin on inflammatory and immune cell infiltrations and protein expression of oxidative stress in liver parenchyma 72 hours after reperfusion (Figures 6, 7, 8 and 9)
Figure 6.
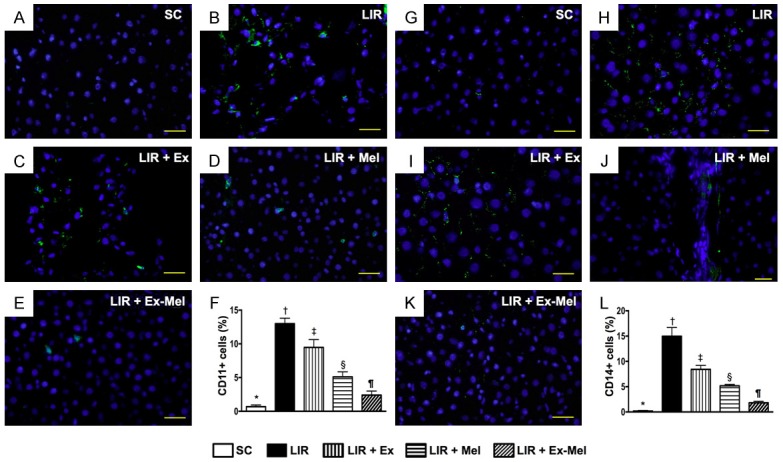
Immunofluorescent (IF) staining for identification of inflammatory cell (CD11+, CD14+) infiltration in liver parenchyma 72 hours after reperfusion. A to E: IF microscopy (400 x) demonstrating CD11+ cells (green) in liver parenchyma. Scale bars in right lower corner represent 20 µm. F: Analytic results of number of CD11+ cells, * vs. other groups with different symbols (†, ‡, §, ¶), P<0.0001. G to K: IF microscopy (400 x) identifying CD14+ cells (green) in liver parenchyma. Scale bars in right lower corner represent 20 µm. L: Number of CD14+ cells in different groups, * vs. other groups with different symbols (†, ‡, §, ¶), P<0.0001. All statistical analyses were performed by one-way ANOVA, followed by Bonferroni multiple comparison post hoc test (n = 10 for each group). Symbols (*, †, ‡, §, ¶) indicate significant differences (at 0.05 level). SC = sham control; LIR = liver ischemia reperfusion; Ex = exosome; Mel = melatonin.
Figure 7.
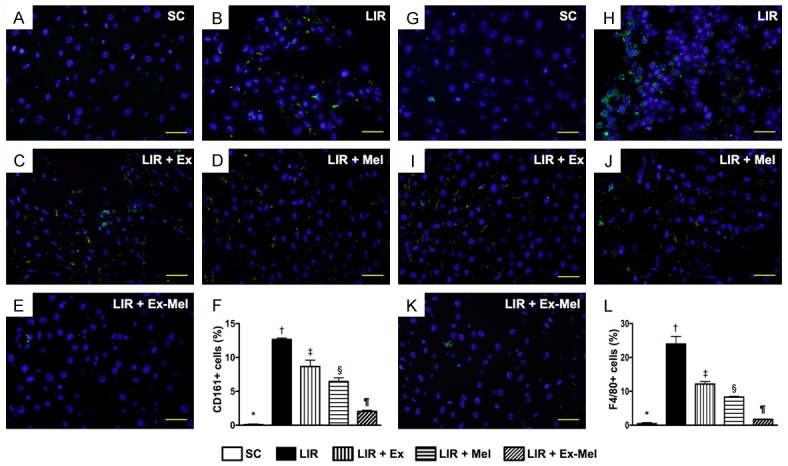
Immunofluorescent (IF) staining for identification of inflammatory cell (CD161+, F4/80+) infiltration in liver parenchyma 72 hours after reperfusion. (A to E) IF microscopy (400 x) showing CD161+ cells (green) in liver parenchyma. Scale bars in right lower corner represent 20 µm. F: Differences in number of CD161+ cells among different groups, * vs. other groups with different symbols (†, ‡, §, ¶), P<0.0001. (G to K) Identification of F4/80+ cells (green) in liver parenchyma using IF microscopy (400 x). Scale bars in right lower corner represent 20 µm. (L) Mean number of F4/80+ cells in different groups, * vs. other groups with different symbols (*, †, ‡, §, ¶), P<0.0001. All statistical analyses were performed by one-way ANOVA, followed by Bonferroni multiple comparison post hoc test (n = 10 for each group). Symbols (*, †, ‡, §, ¶) indicate significant differences (at 0.05 level). SC = sham control; LIR = liver ischemia reperfusion; Ex = exosome; Mel = melatonin.
Figure 8.
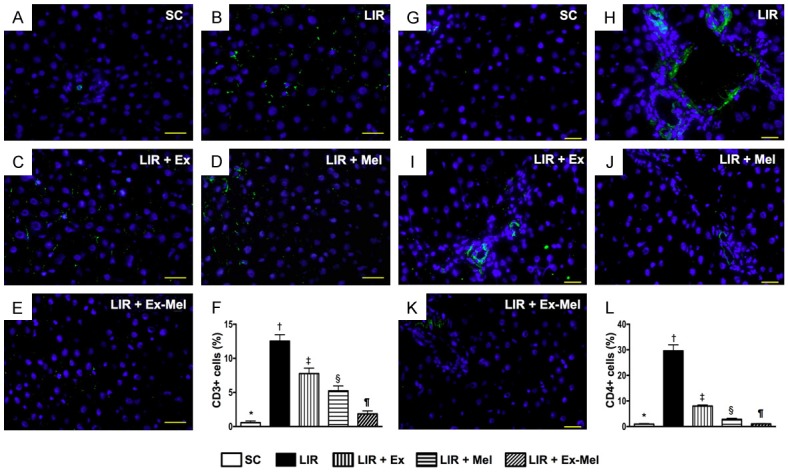
Immunofluorescent (IF) staining for identification of immunoreactive cell infiltration in liver parenchyma 72 hours after reperfusion. A to E: Illustration of IF microscopic finding (400 x) of CD3+ cells (green) in liver parenchyma. The scale bars in right lower corner represent 20 µm. F: Analytic results of number of CD3 + cells, * vs. other groups with different symbols (†, ‡, §, ¶), P<0.0001. G to K: Illustration of IF microscopic finding (400 x) of CD4+ cells (green color) in liver parenchyma. The scale bars in right lower corner represent 20 µm. L: Analytic results of number of CD4+ cells, * vs. other groups with different symbols (†, ‡, §, ¶), P<0.0001. All statistical analyses were performed by one-way ANOVA, followed by Bonferroni multiple comparison post hoc test (n = 10 for each group). Symbols (*, †, ‡, §, ¶) indicate significance (at 0.05 level). SC = sham control; LIR = liver ischemia reperfusion; Ex = exosome; Mel = melatonin.
Figure 9.
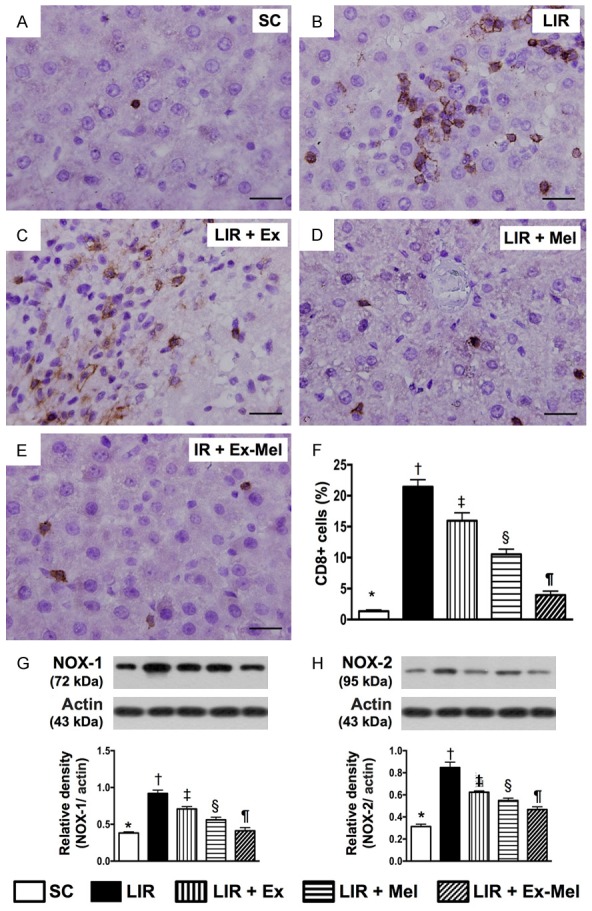
Prevalence of CD8+ cells and protein expression of NOX-1 and NOX-2 in liver parenchyma 72 hours after reperfusion. A to E: Immunohistochemical (IHC) staining (400 x) showing CD8+ cells (gray) in liver parenchyma. Scale bars in right lower corner represent 20 µm. F: Mean number of CD8 + cells in different groups, * vs. other groups with different symbols (†, ‡, §, ¶), P<0.0001. G: Protein expression of NOX-1, * vs. other groups with different symbols (†, ‡, §, ¶), P<0.001. H: Protein expression of NOX-2, * vs. other groups with different symbols (†, ‡, §, ¶), P<0.001. All statistical analyses were performed by one-way ANOVA, followed by Bonferroni multiple comparison post hoc test (n = 10 for each group). Symbols (*, †, ‡, §, ¶) indicate significant differences (at 0.05 level). SC = sham control; LIR = liver ischemia reperfusion; Ex = exosome; Mel = melatonin.
Following 72 hours of reperfusion, IF microscopy of the reperfused liver showed that the numbers of cells positive for CD11, CD14 (Figure 6), CD161, and F4/80 (Figure 7), four markers of inflammatory cells, were lowest in group 1 and highest in group 2, and significantly and progressively decreased from groups 3 to 5. In addition, the numbers of cells positive for CD3, CD4 (Figure 8), and CD8 (Figure 9), three markers of immunoreactive cells, exhibited an identical pattern compared with that of inflammatory cells among the five groups. Moreover, the protein expressions of NOX-1 and NOX-2, two indicators of oxidative stress, demonstrated a pattern identical to that of immune cells among all groups (Figure 9).
Protein expressions of inflammatory, anti-inflammatory, apoptotic and anti-apoptotic biomarkers, and cellular level of oxidative stress in liver parenchyma 72 hours after reperfusion (Figures 10 and 11)
Figure 10.
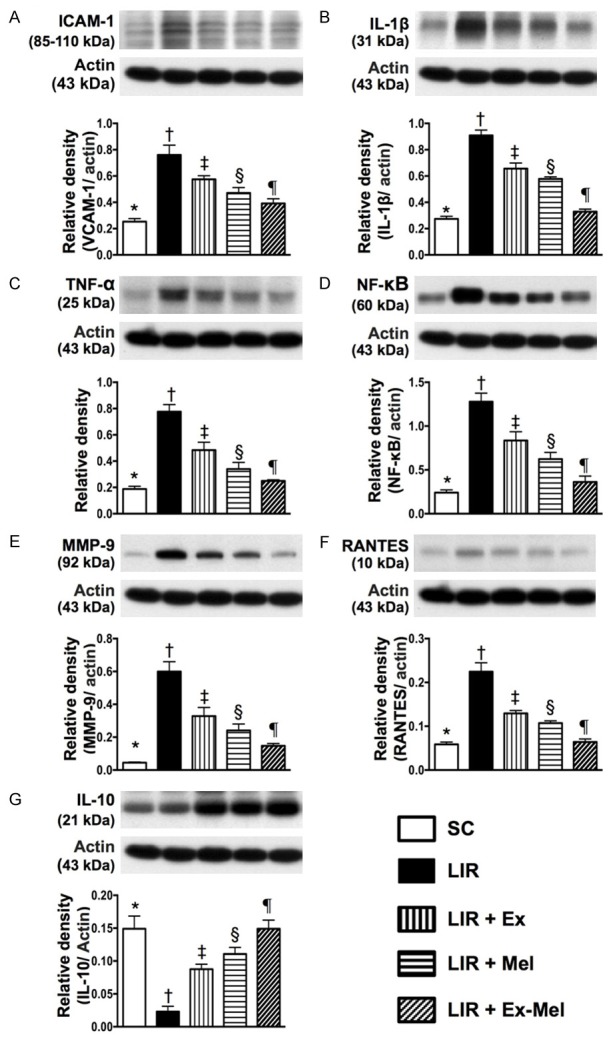
Protein expressions of inflammatory and anti-inflammatory biomarkers in liver parenchyma 72 hours after reperfusion. A: Protein expression of vascular cell adhesion molecule (ICAM)-1, * vs. other groups with different symbols (†, ‡, §, ¶), P<0.001. B: Protein expression of interleukin (IL)-1β, * vs. other groups with different symbols (†, ‡, §, ¶), P<0.001. C: Protein expression of tumor necrosis factor (TNF)-α, * vs. other groups with different symbols (†, ‡, §, ¶), P<0.001. D: Protein expression of nuclear factor (NF)-κB, * vs. other groups with different symbols (†, ‡, §, ¶), P<0.001. E: Protein expression of matrix metalloproteinase (MMP)-9, * vs. other groups with different symbols (†, ‡, §, ¶), P<0.001. F: Protein expression of RANTES, * vs. other groups with different symbols (†, ‡, §, ¶), P<0.001. G: Protein expression of IL-10, * vs. other groups with different symbols (†, ‡, §, ¶), P<0.001. All statistical analyses were performed by one-way ANOVA, followed by Bonferroni multiple comparison post hoc test (n = 10 for each group). Symbols (*, †, ‡, §, ¶) indicate significant differences (at 0.05 level). SC = sham control; LIR = liver ischemia reperfusion; Ex = exosome; Mel = melatonin.
Figure 11.
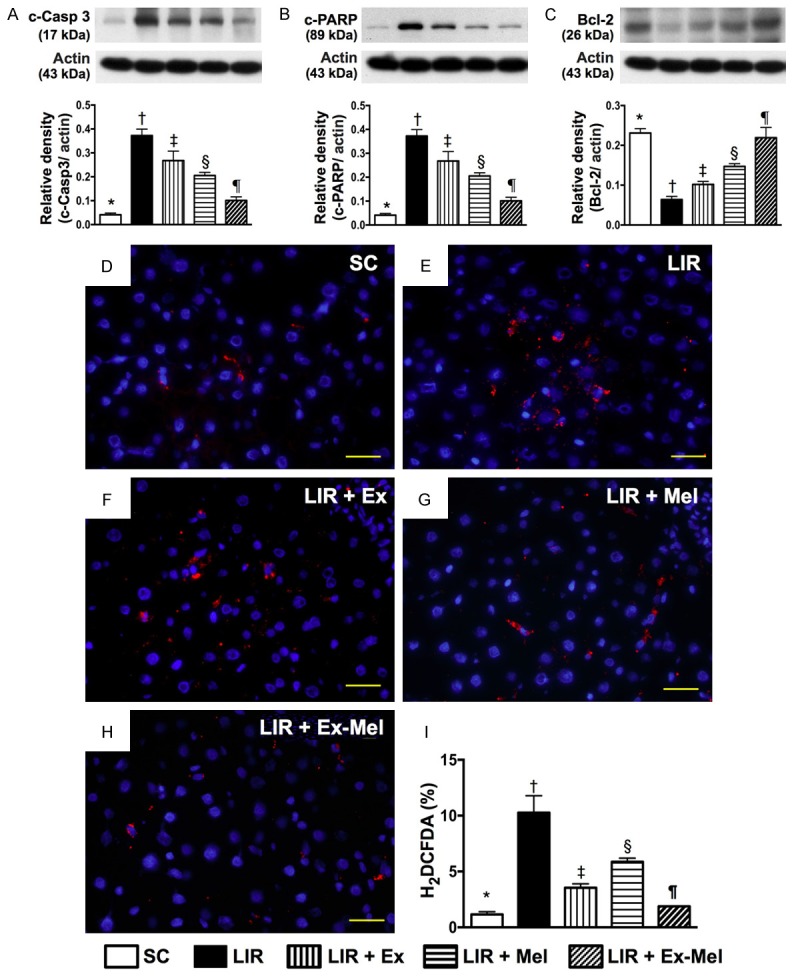
Protein expressions of apoptotic and anti-apoptotic biomarkers, and oxidative stress at cellular level in liver parenchyma 72 hours after reperfusion. A: Protein expression of cleaved caspase (c-Casp) 3, * vs. other groups with different symbols (†, ‡, §, ¶), P<0.001. B: Protein expression of cleaved poly ADP ribose polymerase (c-PARP), * vs. other groups with different symbols (†, ‡, §, ¶), P<0.001. C: Protein expression of Bcl-2, * vs. other groups with different symbols (†, ‡, §, ¶), P<0.001. D-H: Microscopic (400 x) identification of H2DCFDA-positive cells (red) in IR region. Scale bars in right lower corner represent 20 µm. I: Analysis of collagen deposition area, * vs. other groups with different symbols (†, ‡, §, ¶), P<0.0001. All statistical analyses were performed by one-way ANOVA, followed by Bonferroni multiple comparison post hoc test (n = 10 for each group). Symbols (*, †, ‡, §, ¶) indicate significant differences (at 0.05 level). SC = sham control; LIR = liver ischemia reperfusion; Ex = exosome; Mel = melatonin.
The protein expressions of ICAM-1, IL-1β, TNF-α, NF-κB, MMP-9, RANTES, six indices of inflammation, were highest in group 2 and lowest in group 1, significantly higher in group 3 than those in groups 4 and 5, and significantly higher in group 4 than those in group 5 in the reperfused livers (Figure 10). Conversely, the protein expression of IL-10, an indicator of anti-inflammation, showed an opposite pattern compared to that of inflammation among all groups (Figure 10). The protein expressions of cleaved caspase 3 and PARP, two indicators of apoptosis, exhibited an identical pattern compared to that of inflammation among the five groups (Figure 11). By contrast, the protein expression of Bcl-2, an index of anti-apoptosis, correlated well with the expression of IL-10 among the five groups (Figure 11). IF microscopy demonstrated that the number of cells positively stained for H2DCFDA, an indicator of reactive oxygen species (ROS), displayed a pattern identical to that of apoptosis among the five groups (Figure 11).
The protein expressions of DNA damage, mitochondrial damage, and anti-oxidant biomarkers 72 hours after reperfusion (Figure 12)
Figure 12.
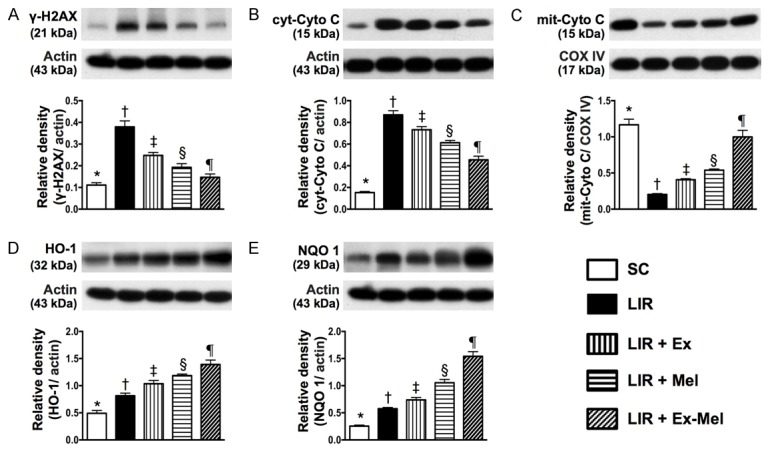
Protein expressions of DNA damage, mitochondrial damage, and anti-oxidant biomarkers in liver parenchyma 72 hours after reperfusion. A: Protein expression of γ-H2AX, * vs. other groups with different symbols (†, ‡, §, ¶), P<0.001. B: Protein expression of cytosolic cytochrome C (cyt-Cyto C), * vs. other groups with different symbols (†, ‡, §, ¶), P<0.001. C: Protein expression of mitochondrial cytochrome C (mit-Cyto C), * vs. other groups with different symbols (†, ‡, §, ¶), P<0.001. D: Protein expression of heme oxygenase (HO)-1, * vs. other groups with different symbols (†, ‡, §, ¶), P<0.001. E: Protein expression of quinone oxidoreductase (NQO) 1, * vs. other groups with different symbols (†, ‡, §, ¶), P<0.001. All statistical analyses were performed by one-way ANOVA, followed by Bonferroni multiple comparison post hoc test (n = 10 for each group). Symbols (*, †, ‡, §, ¶) indicate significant differences (at 0.05 level). SC = sham control; LIR = liver ischemia reperfusion; Ex = exosome; Mel = melatonin.
The protein expressions of γ-H2AX, an indicator of DNA damage, and cytosolic cytochrome C, an indicator of mitochondrial damage, were highest in group 2 and lowest in group 1, significantly higher in group 3 than those in groups 4 and 5, and significantly higher in group 4 than those in group 5 (Figure 12). On the other hand, the protein expression of mitochondrial cytochrome C, an indicator of mitochondrial integrity, showed an opposite pattern compared to that of DNA damage marker (Figure 12). Besides, the protein expressions of heme oxygenase (HO)-1 and quinone oxidoreductase (NQO) 1, two indicators of anti-oxidative capacity, were significantly and progressively increased from group 1 to group 5 (Figure 12).
Discussion
The present study, which investigated the protective effect of combined exosome and melatonin treatment against acute LIR injury, yielded several striking implications. First, to best of our knowledge, this is the first study to investigate the therapeutic potential of xenogenic exosomes (i.e., mini-pig ADMSC-derived exosomes) against acute LR injury in a rodent model. Second, both in vitro and in vivo experiments in the present study showed that not only could exosomes alleviate inflammation and oxidative stress, but they could also trigger immunomodulation. The results, therefore, suggest that ADMSC-derived exosomes possess pleiotropic properties for cell-to-cell communication regardless of their origins. Third, of particular importance is the finding of this study that melatonin treatment further improved the outcome of exosome therapy against acute LIR injury in the present experimental setting.
The most important finding of the present study is that the plasma level of AST (i.e., deranged hepatocyte integrity) and liver injury score (i.e., histological damage), which were substantially increased in LIR animals without treatment compared with those in the sham-operated controls, were significantly suppressed in LIR animals after exosome or melatonin therapy and further significantly improved following combined exosome-melatonin treatment. In addition to corroborating the results of previous studies that demonstrated notable protective effects of melatonin against LIR injury [26,28-32], one interesting finding in the present study is that combined exosome and melatonin treatment was superior to either alone in this experimental setting. In this way, our pre-clinical results highlight the clinical therapeutic potential of combining exosome with melatonin for the treatment of patients with critical acute liver injury, especially those sustaining overwhelming immune reactions as in fulminant liver failure.
In concert with the findings by other authors that the mechanisms by which IR causes hepatic damage actually involve multiple signaling pathways [1-6,26-29], the results of the present study demonstrated that the protein expressions of the markers of inflammation, oxidative stress, DNA and mitochondrial damage as well as the circulating and splenic levels of immune cells were all substantially increased in animals with acute LIR injury compared with those in the sham-operated controls. Therefore, our findings, in addition to strengthening those of previous studies [1-6,26-29], suggest that a single therapeutic agent may be inferior to a combined regimen. Accordingly, while our in vitro and in vivo studies had demonstrated that either exosome or melatonin could effectively ameliorate LIR-associated inflammation, oxidative stress, apoptosis as well as elicit immunomodulation, the combined exosome-melatonin regimen was found to be superior to either alone for preserving hepatocyte and liver parenchymal integrity. The results of the present investigation are also consistent with those of our recent experimental studies that demonstrated additional benefit of combing ADMSC with melatonin or mitochondria in the treatment of acute lung injuries from IR and acute respiratory distress syndrome [27,30]. Furthermore, previous study has also shown that cocktail therapy (i.e., melatonin and trimetazidine) offered additional hepatic protective effects in the setting of acute IR injury [29]. Therefore, not only are our findings consistent with those of the previous studies [27,29,30], but the current study also demonstrated that endogenous particles of stem cell origin could be of therapeutic potential in this common disease setting.
Another important finding in the present study is that, as compared with the animals with LIR, the protein expressions of anti-apoptotic and anti-oxidative markers were remarkably increased in animals with exosome or melatonin treatment and further augmented after combined treatment. These findings not only could account for the markedly increased protein expression of mitochondrial cytochrome C and the substantially suppressed oxidative stress, but could also explain the notably preserved hepatocyte and liver histological integrity in animals undergoing LIR after receiving the three different treatment regimens. The proposed mechanisms underlying the protective effects of combined exosome-melatonin treatment against LIR injury based on the in vitro and in vivo findings of the current study are summarized in Figure 13.
Figure 13.
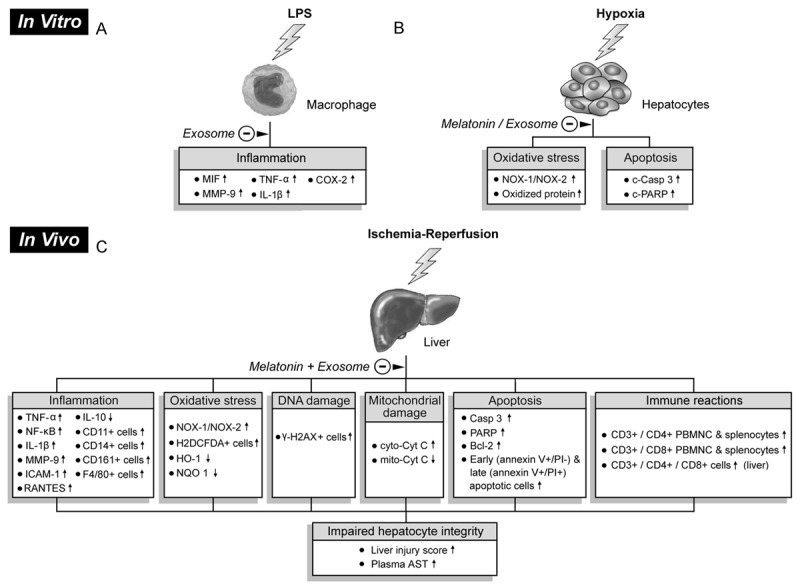
Proposed mechanisms underlying protective effects of exosome-melatonin treatment against liver ischemia-reperfusion injury based on findings of this study. A: Suppression of inflammatory responses (i.e., upregulated expressions of pro-inflammatory biomarkers) in macrophage in vitro by exosomes after lipopolysaccharide (LPS) pre-treatment. B: In vitro alleviation of oxidative stress and apoptosis in hepatocytes after exosome/melatonin treatment before hypoxic stimulation. C: In vivo impacts of exosome/melatonin treatment on inflammation, oxidative stress, DNA damage, mitochondrial damage, apoptosis, and immune reactions that contribute to impaired hepatocyte and histological integrity. LPS: lipopolysaccharide, MIF: migration inhibitory factor, MMP-9: matrix metalloproteinase 9, TNF-α: tumor necrosis factor alpha, IL-1β: interleukin-1 beta, COX-2: cyclooxygenase-2, NOX-1: NADPH oxidase 1, NOX-2: NADPH oxidase 2, c-Casp 3: cleaved caspase 3, c-PARP: cleaved poly ADP ribose polymerase, IL: interleukin, PBMNC: peripheral blood mononuclear cell, NF-κB: nuclear factor kappaB, ICAM-1: intercellular adhesion molecule 1, RANTES: regulated on activation, normal T cell expressed and secreted , HO-1: heme oxygenase-1, NQO: quinone oxidoreductase 1, cyt-Cyto C: cytosolic cytochrome C, mit-Cyto C: mitochondrial cytochrome C, AST: aspartate aminotransferase.
Study limitation
This study has limitations. First, although the short-term (i.e., 72 hours) results were promising, the long-term effect of exosome and melatonin treatment, either alone or combined, on LIR injury is still unclear. Second, although the results of the current study showed that melatonin was more effective than exosomes for protecting against LIR injury, whether a higher dose of exosomes would further improve the therapeutic effect of exosomes in this experimental setting remains to be elucidated.
In conclusion, the results of the present translational study provide important information on the therapeutic potential of xenogenic ADMSC-derived exosomes in the treatment of acute LIR injury and underscore an additive protective effect through combining exosomes with melatonin in this experimental setting.
Acknowledgements
Funding support from the E-Da Health Care group (Grant no. EDAHP104001) is gratefully acknowledged.
Disclosure of conflict of interest
None.
References
- 1.Khashab M, Tector AJ, Kwo PY. Epidemiology of acute liver failure. Curr Gastroenterol Rep. 2007;9:66–73. doi: 10.1007/s11894-008-0023-x. [DOI] [PubMed] [Google Scholar]
- 2.Henrion J. Hypoxic hepatitis. Liver Int. 2012;32:1039–1052. doi: 10.1111/j.1478-3231.2011.02655.x. [DOI] [PubMed] [Google Scholar]
- 3.Fuhrmann V, Kneidinger N, Herkner H, Heinz G, Nikfardjam M, Bojic A, Schellongowski P, Angermayr B, Kitzberger R, Warszawska J, Holzinger U, Schenk P, Madl C. Hypoxic hepatitis: underlying conditions and risk factors for mortality in critically ill patients. Intensive Care Med. 2009;35:1397–1405. doi: 10.1007/s00134-009-1508-2. [DOI] [PubMed] [Google Scholar]
- 4.Lee WM. Acute liver failure. Semin Respir Crit Care Med. 2012;33:36–45. doi: 10.1055/s-0032-1301733. [DOI] [PubMed] [Google Scholar]
- 5.Singanayagam A, Bernal W. Update on acute liver failure. Curr Opin Crit Care. 2015;21:134–141. doi: 10.1097/MCC.0000000000000187. [DOI] [PubMed] [Google Scholar]
- 6.Willars C. Update in intensive care medicine: acute liver failure. Initial management, supportive treatment and who to transplant. Curr Opin Crit Care. 2014;20:202–209. doi: 10.1097/MCC.0000000000000073. [DOI] [PubMed] [Google Scholar]
- 7.Abu-Amara M, Yang SY, Tapuria N, Fuller B, Davidson B, Seifalian A. Liver ischemia/reperfusion injury: processes in inflammatory networks--a review. Liver Transpl. 2010;16:1016–1032. doi: 10.1002/lt.22117. [DOI] [PubMed] [Google Scholar]
- 8.Bhogal RH, Curbishley SM, Weston CJ, Adams DH, Afford SC. Reactive oxygen species mediate human hepatocyte injury during hypoxia/reoxygenation. Liver Transpl. 2010;16:1303–1313. doi: 10.1002/lt.22157. [DOI] [PubMed] [Google Scholar]
- 9.Uchida Y, Freitas MC, Zhao D, Busuttil RW, Kupiec-Weglinski JW. The protective function of neutrophil elastase inhibitor in liver ischemia/reperfusion injury. Transplantation. 2010;89:1050–1056. doi: 10.1097/TP.0b013e3181d45a98. [DOI] [PMC free article] [PubMed] [Google Scholar]
- 10.Klune JR, Tsung A. Molecular biology of liver ischemia/reperfusion injury: established mechanisms and recent advancements. Surg Clin North Am. 2010;90:665–677. doi: 10.1016/j.suc.2010.04.003. [DOI] [PubMed] [Google Scholar]
- 11.Sun CK, Zhang XY, Sheard PW, Mabuchi A, Wheatley AM. Change in mitochondrial membrane potential is the key mechanism in early warm hepatic ischemia-reperfusion injury. Microvasc Res. 2005;70:102–110. doi: 10.1016/j.mvr.2005.04.003. [DOI] [PubMed] [Google Scholar]
- 12.Sun CK, Zhang XY, Zimmermann A, Davis G, Wheatley AM. Effect of ischemia-reperfusion injury on the microcirculation of the steatotic liver of the Zucker rat. Transplantation. 2001;72:1625–1631. doi: 10.1097/00007890-200111270-00008. [DOI] [PubMed] [Google Scholar]
- 13.Lin J, Li J, Huang B, Liu J, Chen X, Chen XM, Xu YM, Huang LF, Wang XZ. Exosomes: novel biomarkers for clinical diagnosis. ScientificWorldJournal. 2015;2015:657086. doi: 10.1155/2015/657086. [DOI] [PMC free article] [PubMed] [Google Scholar]
- 14.Ptak W, Nazimek K, Askenase PW, Bryniarski K. From mysterious supernatant entity to miRNA-150 in antigen-specific exosomes: a history of hapten-specific t suppressor factor. Arch Immunol Ther Exp (Warsz) 2015;63:345–356. doi: 10.1007/s00005-015-0331-4. [DOI] [PMC free article] [PubMed] [Google Scholar]
- 15.Gamez-Valero A, Lozano-Ramos SI, Bancu I, Lauzurica-Valdemoros R, Borras FE. Urinary extracellular vesicles as source of biomarkers in kidney diseases. Front Immunol. 2015;6:6. doi: 10.3389/fimmu.2015.00006. [DOI] [PMC free article] [PubMed] [Google Scholar]
- 16.Boyiadzis M, Whiteside TL. Information transfer by exosomes: A new frontier in hematologic malignancies. Blood Rev. 2015;29:281–290. doi: 10.1016/j.blre.2015.01.004. [DOI] [PubMed] [Google Scholar]
- 17.Zhang J, Guan J, Niu X, Hu G, Guo S, Li Q, Xie Z, Zhang C, Wang Y. Exosomes released from human induced pluripotent stem cells-derived MSCs facilitate cutaneous wound healing by promoting collagen synthesis and angiogenesis. J Transl Med. 2015;13:49. doi: 10.1186/s12967-015-0417-0. [DOI] [PMC free article] [PubMed] [Google Scholar]
- 18.Li X, Li JJ, Yang JY, Wang DS, Zhao W, Song WJ, Li WM, Wang JF, Han W, Zhang ZC, Yu Y, Cao DY, Dou KF. Tolerance induction by exosomes from immature dendritic cells and rapamycin in a mouse cardiac allograft model. PLoS One. 2012;7:e44045. doi: 10.1371/journal.pone.0044045. [DOI] [PMC free article] [PubMed] [Google Scholar]
- 19.Yu X, Huang C, Song B, Xiao Y, Fang M, Feng J, Wang P. CD4+CD25+ regulatory T cellsderived exosomes prolonged kidney allograft survival in a rat model. Cell Immunol. 2013;285:62–68. doi: 10.1016/j.cellimm.2013.06.010. [DOI] [PubMed] [Google Scholar]
- 20.Zhang Y, Chopp M, Meng Y, Katakowski M, Xin H, Mahmood A, Xiong Y. Effect of exosomes derived from multipluripotent mesenchymal stromal cells on functional recovery and neurovascular plasticity in rats after traumatic brain injury. J Neurosurg. 2015;122:856–867. doi: 10.3171/2014.11.JNS14770. [DOI] [PMC free article] [PubMed] [Google Scholar]
- 21.Yu B, Kim HW, Gong M, Wang J, Millard RW, Wang Y, Ashraf M, Xu M. Exosomes secreted from GATA-4 overexpressing mesenchymal stem cells serve as a reservoir of anti-apoptotic microRNAs for cardioprotection. Int J Cardiol. 2015;182:349–360. doi: 10.1016/j.ijcard.2014.12.043. [DOI] [PMC free article] [PubMed] [Google Scholar]
- 22.Galano A, Tan DX, Reiter RJ. Melatonin as a natural ally against oxidative stress: a physicochemical examination. J Pineal Res. 2011;51:1–16. doi: 10.1111/j.1600-079X.2011.00916.x. [DOI] [PubMed] [Google Scholar]
- 23.Zhang HM, Zhang Y. Melatonin: a well-documented antioxidant with conditional pro-oxidant actions. J Pineal Res. 2014;57:131–146. doi: 10.1111/jpi.12162. [DOI] [PubMed] [Google Scholar]
- 24.Galano A, Tan DX, Reiter RJ. On the free radical scavenging activities of melatonin’s metabolites, AFMK and AMK. J Pineal Res. 2013;54:245–257. doi: 10.1111/jpi.12010. [DOI] [PubMed] [Google Scholar]
- 25.Garcia JJ, Lopez-Pingarron L, Almeida-Souza P, Tres A, Escudero P, Garcia-Gil FA, Tan DX, Reiter RJ, Ramirez JM, Bernal-Perez M. Protective effects of melatonin in reducing oxidative stress and in preserving the fluidity of biological membranes: a review. J Pineal Res. 2014;56:225–237. doi: 10.1111/jpi.12128. [DOI] [PubMed] [Google Scholar]
- 26.Kang JW, Koh EJ, Lee SM. Melatonin protects liver against ischemia and reperfusion injury through inhibition of toll-like receptor signaling pathway. J Pineal Res. 2011;50:403–411. doi: 10.1111/j.1600-079X.2011.00858.x. [DOI] [PubMed] [Google Scholar]
- 27.Sun CK, Lee FY, Kao YH, Chiang HJ, Sung PH, Tsai TH, Lin YC, Leu S, Wu YC, Lu HI, Chen YL, Chung SY, Su HL, Yip HK. Systemic combined melatonin-mitochondria treatment improves acute respiratory distress syndrome in the rat. J Pineal Res. 2015;58:137–150. doi: 10.1111/jpi.12199. [DOI] [PubMed] [Google Scholar]
- 28.Kireev R, Bitoun S, Cuesta S, Tejerina A, Ibarrola C, Moreno E, Vara E, Tresguerres JA. Melatonin treatment protects liver of Zucker rats after ischemia/reperfusion by diminishing oxidative stress and apoptosis. Eur J Pharmacol. 2013;701:185–193. doi: 10.1016/j.ejphar.2012.11.038. [DOI] [PubMed] [Google Scholar]
- 29.Zaouali MA, Boncompagni E, Reiter RJ, Bejaoui M, Freitas I, Pantazi E, Folch-Puy E, Abdennebi HB, Garcia-Gil FA, Rosello-Catafau J. AMPK involvement in endoplasmic reticulum stress and autophagy modulation after fatty liver graft preservation: a role for melatonin and trimetazidine cocktail. J Pineal Res. 2013;55:65–78. doi: 10.1111/jpi.12051. [DOI] [PubMed] [Google Scholar]
- 30.Yip HK, Chang YC, Wallace CG, Chang LT, Tsai TH, Chen YL, Chang HW, Leu S, Zhen YY, Tsai CY, Yeh KH, Sun CK, Yen CH. Melatonin treatment improves adipose-derived mesenchymal stem cell therapy for acute lung ischemia-reperfusion injury. J Pineal Res. 2013;54:207–221. doi: 10.1111/jpi.12020. [DOI] [PubMed] [Google Scholar]
- 31.Ko SF, Yip HK, Zhen YY, Lee CC, Lee CC, Huang CC, Ng SH, Lin JW. Adipose-derived mesenchymal stem cell exosomes suppress hepatocellular carcinoma growth in a rat model: apparent diffusion coefficient, natural killer T-cell responses, and histopathological features. Stem Cells Int. 2015;2015:853506. doi: 10.1155/2015/853506. [DOI] [PMC free article] [PubMed] [Google Scholar]
- 32.Sun CK, Chang CL, Lin YC, Kao YH, Chang LT, Yen CH, Shao PL, Chen CH, Leu S, Yip HK. Systemic administration of autologous adipose-derived mesenchymal stem cells alleviates hepatic ischemia-reperfusion injury in rats. Crit Care Med. 2012;40:1279–1290. doi: 10.1097/CCM.0b013e31823dae23. [DOI] [PubMed] [Google Scholar]
- 33.Chang CL, Leu S, Sung HC, Zhen YY, Cho CL, Chen A, Tsai TH, Chung SY, Chai HT, Sun CK, Yen CH, Yip HK. Impact of apoptotic adipose-derived mesenchymal stem cells on attenuating organ damage and reducing mortality in rat sepsis syndrome induced by cecal puncture and ligation. J Transl Med. 2012;10:244. doi: 10.1186/1479-5876-10-244. [DOI] [PMC free article] [PubMed] [Google Scholar]