

Abstract
Mycobacterium tuberculosis (Mtb) infection has been regional outbreak, recently. The traditional focus on the patterns of “reductionism” which was associated with single molecular changes has been unable to meet the demand of early diagnosis and clinical application when current tuberculosis infection happened. In this study, we employed a systems biology approach to collect large microarray data sets including mRNAs and microRNAs (miRNAs) to identify the differentially expressed mRNAs and miRNAs in the whole blood of TB patients. The aim was to identify key genes associated with the immune response in the pathogenic process of tuberculosis by analyzing the co-regulatory network that was consisted of transcription factors and miRNAs as well as their target genes. The network along with their co-regulatory genes was analyzed utilizing Transcriptional Regulatory Element Database (TRED) and Database for Annotation, Visualization and Integrated Discovery (DAVID). We got 21 (19 up-regulated and 2 down-regulated) differentially expressed genes that were co-regulated by transcription factors and miRNAs. KEGG pathway enrichment analysis showed that the 21 differentially expressed genes were predominantly involved in Tuberculosis signaling pathway, which may play a major role in tuberculosis biological process. Quantitative real-time PCR was performed to verify the over expression of co-regulatory genes (FCGR1A and CEBPB). The genetic expression was correlated with clinicopathological characteristics in TB patients and inferences drawn. Our results suggest the TF-miRNA gene co-regulatory network may help us further understand the molecular mechanism of immune response to tuberculosis and provide us a new angle of future biomarker and therapeutic targets.
Keywords: Transcription factor, microRNA, co-regulatory network, tuberculosis, biomarker
Introduction
Tuberculosis (TB) is a major public health problem both in the developing and developed countries. Despite global efforts to halt the spread of TB and availability of effective treatment, the number of annual deaths (1.5-2 million per year) remain almost unchanged, making it the most prevalent bacterial infection [1]. Moreover, the alarming rise in the incidence of multidrug-resistant tuberculosis is adversely affecting the global TB control efforts [2,3]. Mycobacterium tuberculosis (Mtb), the causative agent of TB, is a particularly successful pathogen with the ability to evade the immune response and has acquired the ability to survive in the macrophages of immunocompetent individuals [4]. The currently available tools for prevention, diagnosis and treatment of tuberculosis are largely inadequate. Globally, there is much variability in the use and efficacy of Bacille Calmette-Guérin (BCG) vaccine [5]. Given the complexity of the disease pathophysiology, a system’s biology approach may help understand the principal host immune response against Mtb [6]. Human whole blood reflects pathological and immunological changes in the body, therefore, studying the blood transcriptional signature may reveal insights into dynamics of immune response, both in heath and disease [7-10]. Studies based on whole-blood microarray gene expression analysis and whole blood genome-wide transcriptional profiles have documented distinct signatures associated with TB [11,12]. But gene expression in cells is determined by both transcription and post transcriptional levels. Transcription factors (TFs) can regulate gene transcription, while microRNAs (miRNAs) as a group of a small non-coding RNA can be endogenously expressed and regulate gene expression on the posttranscriptional levels [13]. MiRNAs play essential roles in the modulation of immune responses against intracellular pathogens and regulating multiple biological pathways including innate host defenses against various infections [14-16]. Latorre l et al have reported that there were numerous miRNAs aberrantly expressed when tuberculosis happened using a novel whole blood miRNA signature test [17]. If we combine the mRNAs and miRNAs that expressed differentially and construct an aberrant TF-miRNA gene co-regulatory network, which are all analyzed in whole blood of TB patients. We may further understand that how TFs and miRNAs coordinate the regulation of gene expression contributing to the process of tuberculosis disease. In this study, We first envisaged an aberrant TF-gene regulatory network that is associated with the differentially expressed genes including transcription factors, based on data sourced from the Transcriptional Regulatory Element Database (TRED) [18] which may help integrate related genes. Second we profiled differentially expressed miRNAs based on the microarray data in whole blood of TB patients and healthy human, and we constructed a miRNA-gene regulatory network for the process of tuberculosis disease by integrating the miRNA targeting gene databases that were Targetscan, miRDB and microRNA. Then we built the TF-miRNA gene co-regulatory network using the data we analyzed earlier and then performed KEGG pathway analysis and put to use quantitative real time PCR to verify the data. Thus, both of the methods and analyses about the co-regulatory network based on the study of human whole blood transcription profiles in patients with TB and healthy controls may provide insights on the role of these genes in the immunopathogenesis of TB. This may also help identify novel biomarkers and new therapeutic targets for tuberculosis.
Materials and methods
Ethics statement
Our study was approved by the Ethics Committee of College of Basic Medical Sciences, Jilin University and each patient was consented in a written informed consent form.
Collection of microarray data
This research involves the microarray data obtained by retrieving GEO datasets of NCBI. Collection standard: 1) Experimental design of mRNA and miRNA expression datasets, which must be a study as for the whole blood of tuberculosis patients contrast normal people. 2) Each mRNA and miRNA expression data set involved two kinds of whole blood sample and the number of each type must be greater than 5. 3) Samples of mRNA and miRNA expression chip in the research must be genome-wide expression levels of RNA, that is to say, total RNA. Microarray expression value datasets were downloaded through the Bioconductor package’s GEO query function, which was conducted by R language.
Analysis of microarray data
We organized the microarray mRNA and miRNA expression data which were sorted out and designed the level of phenotypic covariance according to the microarray experiments. Then we applied method of linear model and empirical Bayes statistics, which is from Limma bag, and combined traditional t-test to conduct a nonspecific filtering for the expression data. For mRNA data, controlling P < 0.05, |Log2FC| > 0.58 (FC > 1.5/FC < 0.66) to eventually screen the differentially expressed genes. And for miRNA data, controlling P < 0.05, |Log2FC| > 1 (FC > 2/FC < 0.5) to eventually screen the differentially expressed miRNAs.
Function analysis and gene annotation
We made use of Database for Annotation, Visualization and Integrated Discovery (DAVID) and Kyoto Encyclopedia of Genes and Genomes (KEGG) to conduct the differential genes’ function analysis and pathway classification, respectively.
Construction of TF-gene, miRNA-gene and TF-miRNA gene network
Based on mRNA expression profiles after microarray data analysis and through searching of Transcriptional Regulatory Element Database (TRED), we obtained some TFs and their target genes. Meanwhile, databases of Targetscan, miRDB and microRNA were used for obtaining the predicted target genes of the differentially expressed miRNAs. Then we put to use ggplot2 bag which be implemented by R to take the hierarchical clustering analysis. The networks were constructed applying Cytoscape software. The yellow triangles in TF-gene network represented transcription factors and the circles represented genes that red is up-regulated and green is down-regulated. The deep pink diamonds in miRNA-gene network represented MicroRNAs and the wathet blue circles represented predicted target genes that were differentially expressed. The TFs and miRNAs as well as their target genes are combined by dotted lines with arrows which direction is from the source to the target. The construction of TF-miRNA gene network is based on both TF-gene network and miRNA-gene network.
Blood specimens
We recruited 40 patients of pulmonary tuberculosis from hospital for infectious diseases, Changchun, China (patients’ information were showed in Table S1). At the same time a total of 20 healthy volunteers were recruited from The First Hospital of Jilin University, Changchun, China. We collected the blood that were all from veins of TB patients and healthy people, that be preserved in low temperature (not less than 4 degrees below zero) then be used in experiments.
RNA isolation
All of the blood was collected into Tempus tubes (One-time blood collection tube, EDTAK2, IMPROVACUTER, China) by standard phlebotomy and using Red Blood Cell Lysis Buffer (DINGGUO, Beijing, China) to remove the red blood cells that exist in the whole blood. Then we extracted total RNA of leucocyte by Trizol (Invitrogen, CA, USA) and using RNeasy Mini kit (Qiagen, Düsseldorf, Germany) for further purification. Through Epoch Multi-volume Spectrophotometer System (BioTek, Vermont, USA) we got the absorbance and concentration of RNA, that is, RNA absorbance with A260/A280 between 1.8~2.0 and the RNA concentration was ranged from 100 ng/ml to 1 mg/ml.
Analysis of qPCR
The Whole blood RNA from TB patients and healthy people using PrimeScriptTM RT reagent Kit with gDNA Eraser (Perfect Real Time) (Takara, Dalian, China) to do the RT-PCR reaction. Expression of FCGR1A and CEBPB mRNA was analyzed in 40 cases of TB whole blood and 20 cases normal whole blood by qPCR using SYBR Premix Ex Taq (Takara) and β-actin was used as an internal control. The primer sequences for amplification were listed in Table 1. To quantify the qPCR data we used 2-ΔΔCt methods. The differences between groups were statistically evaluated by sample one-tailed Student’s t-test with p-value, less than 0.05 considered as significant.
Table 1.
Primers used for qPCR amplification
| Gene | Forward | Reverse |
|---|---|---|
| FCGR1A | 5’-GCAGGAACACATCCTCTGAA-3’ | 5’-GTAACTGGAGGCCAAGCACT-3’ |
| CEBPB | 5’-AAGCTGAGCGACGAGTACAAGA-3’ | 5’-GTCAGCTCCAGCACCTTGTG-3’ |
| β-actin | 5’-CTGGAACGGTGAAGGTGACA-3’ | 5’-AAGGGACTTCCTGTAACAATGCA-3’ |
Analysis of clinic pathological characteristics from TB patients by the assumptive blood diagnosis symbol set: FCGR1A and CEBPB
We used receiver operating characteristic (ROC) curves to analysis the differentially expressed genes that are FCGR1A and CEBPB between TB blood and normal blood. Then we applied binary logistic regression analysis to determine that the blood diagnosis symbol set which consisted of these two genes weather a clinic pathological characteristic diagnosis way or not.
Statistical analysis
The ROC curve and binary logistic regression analysis were used between TB blood and normal blood for FCGR1A and CEBPB. GraphPad Prism 6 software was utilized to draw ROC curve and calculated the sensitivity, specificity and area under the curve (AUC). SPSS 19.0 was performed to take the binary logistic regression analysis. A p-value < 0.05 was regarded as the systemic importance.
Results
Differentially expressed mRNA and miRNA profiles in TB patients
Four mRNA expression datasets was collected from GEO DataSets of NCBI (accession number GSE42825, GSE42826, GSE42830 and GSE42832). And the four cases contained 40 TB samples vs. 118 Control samples in the study (Table S2). More than 1.5 fold change in expression was considered as the cut-off level for identification of differentially expressed genes. A total of 1539 differentially expressed genes were identified, of which 1041 were up-regulated and 498 were down-regulated (Table S3). DAVID and KEGG were used for functional analysis and pathway classification of these differentially expressed genes, respectively. The differentially expressed genes were found to be predominantly involved in type I interferon biosynthetic process (biological-process), Toll-like receptor binding (molecular-function), response to host immune response (molecular-function), Toll-like receptor signaling pathway, and T cell receptor signaling pathway (Figure 1A and 1B). Most of the differentially expressed genes were related to immune biological processes or signaling pathways. Meanwhile, the case GSE34608 that is a miRNA expression dataset was collected from GEO DataSets of NCBI. It was thought that more than two fold change was the cut-off level for identification of differentially expressed miRNAs. A total of 140 differentially expressed miRNAs were acquired, of which were all up-regulated by our data analysis method (Figure 2; Table S4).
Figure 1.
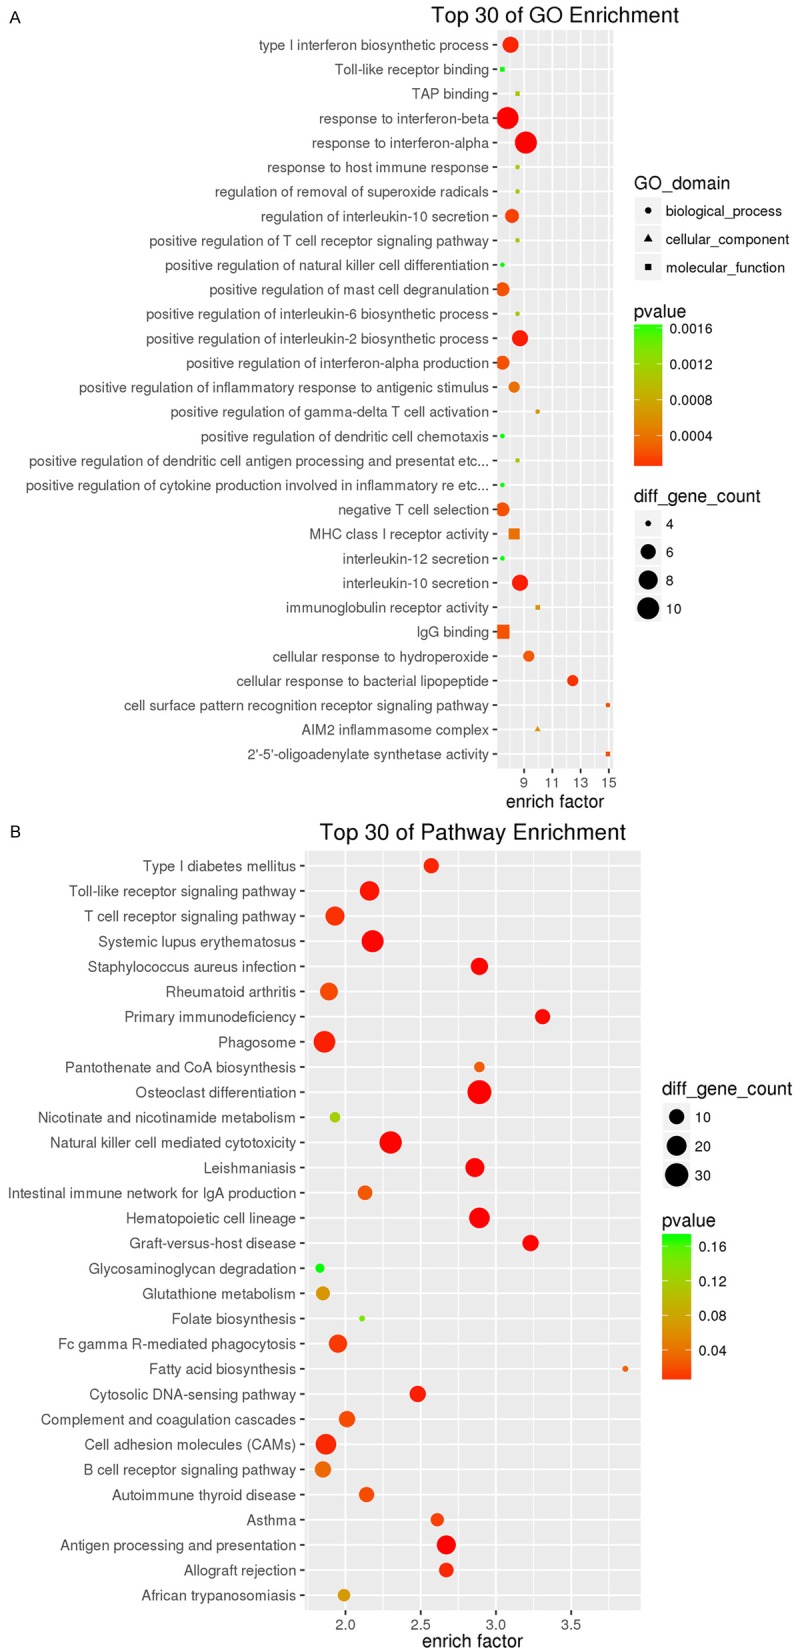
Significant two kinds of analyses of 1539 differentially expressed genes, which was respectively listed about the top 30. A. Gene ontology analysis; B. KEGG analysis.
Figure 2.

Hierarchical clusters analysis of 140 differentially expressed miRNAs in human whole blood of tuberculosis versus normal blood of healthy people. Each row represents a miRNA; each column represents a sample. The “TB” columns at the bottom represent TB whole blood, while “Normal” represents normal whole blood. Red indicates higher expression in TB patients as compared to that in normal subjects, Green indicates low expression in TB compared to that in normal subjects. TF, Transcription factor; TB, tuberculosis.
Research of the TF-gene and miRNA-gene regulatory network in TB patients
Based on differential mRNA expression profiles and the information derived from TRED as well as the hierarchical cluster analysis (Figure 3), there were 53 genes that can form the TF-gene network, 47 of which were up-regulated and 6 were down-regulated (Table S5). Specifically, transcription factors CEBPB, SPI1, STAT1, STAT2, STAT3 and STAT5A were up-regulated and STAT4 was down-regulated (Figure 4). TF-gene network showed that SPI1, CEBPB, STAT1, STAT2, STAT3, STAT4 and STAT5A directly regulated 22, 12, 11, 1, 10, 1 and 3 genes, respectively. Further, the top three disease classes associated with these 53 differentially expressed genes were identified (Table 2) in the DAVID, which applied functional annotation to these genes. The most important class was IMMUNE (39 genes); followed by CANCER (37 genes) and INFFECTION (28 genes).
Figure 3.

Hierarchical clusters analysis of 53 differentially expressed genes in TF-gene regulatory network. Each row represents a gene; each column represents a sample. The “TB” columns at the bottom represent TB whole blood, while “Normal” represents normal whole blood. Red indicates higher expression in TB patients as compared to that in normal subjects, Green indicates low expression in TB compared to that in normal subjects. TF, Transcription factor; TB, tuberculosis.
Figure 4.
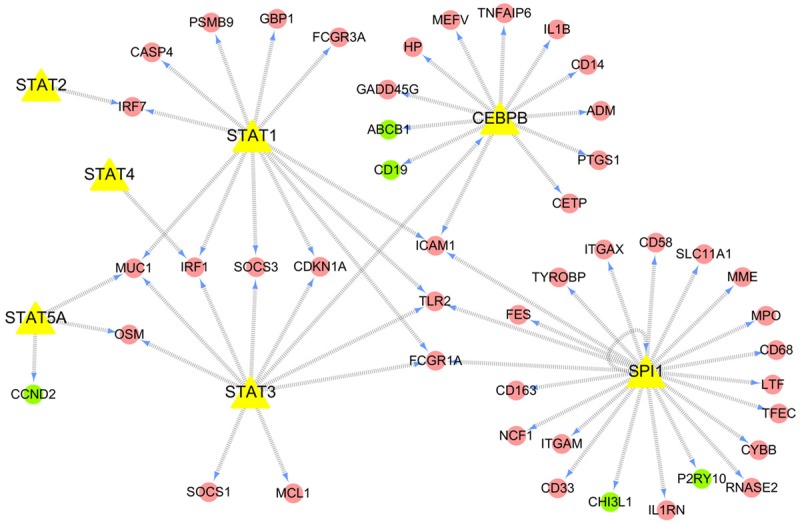
TF-gene network in whole blood of patients with tuberculosis. This TF-gene network consisted of 53 differentially expressed genes. Red ovals represent up-regulated genes; green ovals represent down-regulated genes; and the yellow triangles represent seven TFs; The direction of the connecting arrows is from the source to the target.
Table 2.
Genetic Association DB Disease Class analysis of 53 genes in TF-gene network
| Term | p-value | Fold enrichment | Benjamini | FDR | Genes |
|---|---|---|---|---|---|
| IMMUNE | 2.83E-15 | 3.32 | 5.20E-14 | 2.13E-12 | STAT5A, PTGS1, TLR2, HPITGAM, STAT4, SLC11A1, MEFV, LTF, ITGAX, CETP, FCGR1A, CD19, IRF1, TFEC, IL1B, FCGR3A, CD14, MUC1, ICAM1, CEBPB, RNASE2, NCF1, SOCS3, SOCS1, IL1RN, CHI3L, ABCB1, STAT1, STAT3, PSMB9, STAT2, MPO, TNFAIP6, IRF7, CD58, CYBB, GBP1, CDKN1A |
| CANCER | 2.30E-12 | 2.94 | 1.38E-11 | 1.70E-09 | STAT5A, PTGS1, SPI1, TLR2, MME, HP, FES, MPOSLC11A1, STAT4, CASP4, CETP, CYBB, MEFV, IL1B, FCGR1A, FCGR3A, CD14, TYROBP, MUC1, ICAM1, SOCS3, SOCS1, IL1RN, CHI3L1, ABCB1, STAT1, STAT3, PSMB9, STAT2, TNFAIP6, IRF7 CDKN1A, IRF1, CCND2, CD33, GADD45G |
| INFEC-TION | 1.59E-09 | 3.31 | 7.17E-09 | 1.17E-06 | MCL1, STAT5A, PTGS1, TLR2, HP, SLC11A11, STAT4LTF, IL1B, FCGR3A, MUC1, CD14, IRF1, MPO, ICAM1, NCF1, SOCS3, IRF7, CD58, IL1RN, SOCS1, CHI3L1, ABCB1, STAT1, STAT3, PSMB9, STAT2, CYBB |
| OTHER | 2.35E-08 | 3.67 | 8.45E-08 | 1.73E-05 | MUC1, ICAM1, SOCS1, IL1RN, PTGS1, TRL2, MME, HP, ABCB1, STAT1, ITGAM, CD14, CDKN1A, CYBB, LTF, ITGAX, IL1B, MEFVMPO, GADD45G, IRF1, CETP, FCGR3A |
Based on the mRNA and miRNA expression datasets as well as the databases of Targetscan, miRDB and microRNA as mentioned earlier, we not only obtained the predicted target genes of differentially expressed miRNAs but also constructed an aberrant miRNA-gene network (Figure 5; Table S7), 113 of which were differentially expressed miRNAs and 657 were differentially expressed genes.
Figure 5.

MiRNA-gene network in whole blood of patients with tuberculosis. This miRNA-gene network consisted of 113 differentially expressed miRNAs and their 657 predicted target genes that were expressed aberrantly. Deep pink diamonds represent miRNA; wathet blue circles represent predicted target genes; The direction of the connecting arrows is from the source to the target.
TF-miRNA gene co-regulatory network was constructed and analized in TB patients
Based on the TF-gene and miRNA-gene network, we further constructed an aberrant TF-miRNA co-regulatory network which regulated the expression of genes in the pathogenic process of tuberculosis. The TF-miRNA co-regulatory network contained 21 differentially expressed genes (CEBPB, CCND2, SOCS3, SOCS1, IRF1, GBP1, CDKN1A, MCL1, FCGR1A, FCGR3A, CD163, MME, CD58, TNFAIP6, ITGAX, ITGAM, TFEC, ADM, IL1B, ABCB1, and PTGS1) that were regarded as hub-genes, most of which (19 out of 21) were up-regulated in TB patients (Figure 6; Table S6). DAVID were used for KEGG pathway enrichment analysis of these 21 differentially expressed genes. The results showed that the 21 differentially expressed genes were predominantly involved in Tuberculosis signaling pathway, followed by Osteoclast differentiation, Transcriptional misregulation in cancer and Leishmaniasis, etc (Figure 7). And six co-regulatory genes (CEBPB, FCGR1A, FCGR3A, ITGAX, ITGAM, and IL1B) were most significantly altered and enriched in Tuberculosis signaling pathway (Table 3), which suggested that they may play a major role in tuberculosis biological process. In particular, FCGR1A and CEBPB were the two genes that had the highest difference multiple among these six co-regulatory genes. Therefore, FCGR1A and CEBPB were served as the representative genes to validated the microarray data using qPCR in 40 TB and 20 normal blood specimens. The results showed that FCGR1A mRNA expression was up-regulated by 9.58 ± 0.54 (P < 0.001), while that of CEBPB was up-regulated by 2.57 ± 0.32 (P < 0.01) (Figure 8).
Figure 6.

TF-miRNA co-regulatory network in whole blood of patients with tuberculosis. This TF-miRNA co-regulatory network contains 26 differentially expressed genes and 28 differentially expressed miRNAs. Yellow triangles represent TFs; purple diamonds represent miRNAs; red ovals represent up-regulated genes; green ovals represent down-regulated genes; The direction of the connecting arrows is from the source to the target.
Figure 7.
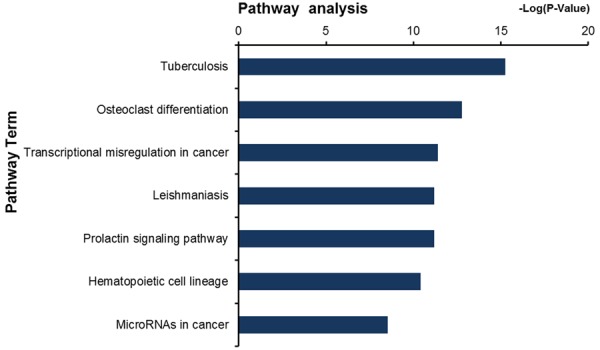
KEGG pathway enrichment analysis of the 21 differentially expressed hub-genes regulated by both TFs and miRNAs.
Table 3.
The most significant KEGG pathway of the hub-genes regulated by both TFs and miRNAs
| Term | p-value | Benjamini | FDR | Genes |
|---|---|---|---|---|
| hsa05152: Tuberculosis | 2.54E-05 | 0.002005458 | 0.026943901 | CEBPB, ITGAX, FCGR1A, IL1B, FCGR3A, ITGAM |
Figure 8.

Differential expression of FCGR1A and CEBPB. Validation based on expression in whole blood from patients with tuberculosis (N=40) and normal individuals (N=20) by qPCR and compared to microarray results (*, ** and ***represent P < 0.05, P < 0.01 and P < 0.001, respectively).
Clinicopathological characteristics correlate of the expression of FCGR1A and CEBPB
The expression of FCGR1A and CEBPB was further analyzed and associated them with the clinicopathological characteristics from TB patients. The receiver operating characteristic (ROC) curve analysis showed that the expression of FCGR1A and CEBPB may be used as marker of TB disease (Figure 9). Moreover, on binary logistic regression analysis (Figure 9), the latent TB diagnosis symbol (FCGR1A and CEBPB) appeared to improve the sensitivity and specificity of the diagnosis of tuberculosis.
Figure 9.

ROC curve showing discriminators between TB and normal blood. All refers to the combination of FCGR1A and CEBPB. ROC, Receiver operating characteristics; AUC, area under the curve.
Discussion
In the present study, using cases of mRNA and miRNA microaray data we constructed the transcription factors-MicroRNA co-regulatory network in whole blood of TB patients. And we identified 21 genes that were regulated by both transcription factors and MicroRNAs, we regarded them as hub-genes. Further, 6 genes (CEBPB, FCGR1A, FCGR3A, ITGAX, ITGAM, and IL1B) were enriched in the Tuberculosis signaling pathway. And the expression of FCGR1A and CEBPB was confirmed in whole blood of TB patients and healthy people. However, which in the world of miRNA regulate the expression of the two genes in TB patients is still unknown.
CEBPB, SPI1 and parts of STATs family (STAT1, STAT3, STAT4 and STAT5A) were transcription factors that regulated 21 hub-genes in the co-regulatory network. CEBPB and SPI1 are known to be associated with differentiation and activation of macrophages and are concerned in the regulation of immune and inflammatory response. In addition, CEBPB plays a crucial part in IgG immune compound stimuli. SPI1 also plays an important role in compound adjustment of immunoglobulin class by regulating B cell development [19,20]. CEBPB and SPI1 were over expressed according to our analysis of whole blood microarray data sets from TB patients. In the present study, CEBPB, SPI1, and members of STATs family along with their regulated genes, were found to play a critical role in the pathogenesis of TB.
STAT1 activates the immune system, and is thought to play a critical role in the immune response against viruses, bacteria and parasites. Mice deficient in STAT1 were shown to die within eight weeks of birth from viral infections [21]. Moreover, the expression of cell surface IgG was shown to be significantly decreased in individuals who lacked STAT1 [22]. JAK/STAT signaling pathway in macrophages is thought to protect against mycobacterial infection [23]. The activity of SPI1 transcription factor has been shown to be essential for the development of bone marrow cells and lymphoid cells, and mice deficient in SPI1 were shown to lack immune cells such as macrophages and B cells, and die within the first 48 hours of birth [19]. Thus, SPI1 and STAT1 have an overlapping function in certain aspects of the immune response. These findings suggest that SPI1 and STAT1 may play a pivotal role in resisting invasion by Mtb.
Meanwhile, STAT3 may also play a part in inducing transcription of a limited set of target genes. For example, macrophages are thought to exert anti-inflammatory effect through secretion of cytokines with the help of active STAT3 [24]. CEBPB was shown to be directly regulated by STAT3 and is known to find a high expression in alveolar macrophages [25], and plays a role in macrophage-mediated inflammation [26]. In the present study, CEBPB was found to be an over-expressed transcription factor in whole blood of TB patients as well, and was a member of 21 hub-genes belong to the co-regulatory network, which indicated that CEBPB might play a critical role in the immune defense against tuberculosis.
For another validated gene FCGR1A that was co-regulatory by both TFs and miRNAs, encodes a high-affinity Fc-gamma receptor that plays an important role in the immune response. The high expression of FCGR1A in TB patients has been reported previously [27]. Microarray analysis of PBMCs from TB patients and healthy donors also yielded similar results [28]. In another study, patients with active TB had a significantly higher pre-treatment expression of FCGR1A as compared to that in patients with LTBI, regardless of HIV status or genetic background [29]. And FCGR1A expression level of TB patients was obviously higher than that of other lung diseases patients [30]. We also found that FCGR1A was over-expressed in human whole blood of patients who have pulmonary tuberculosis. These may suggest that FCGR1A is related to the pathogenesis of tuberculosis, which is worth our further study.
Like genes FCGR1A and CEBPB we mentioned early, FCGR3A, ITGAX, ITGAM, and IL1B were co-regulated by both TFs and miRNAs and they also participated in Tuberculosis signaling pathway. Through the relevant researches we understood that FCGR3A was expressed on mcrophages, monoctytes, natural kller (NK) cells, and dendritic cells, and FCGR3A plays a key role in mediating the biological effects of the humoral immune response, such as ADCC and ADCVI [31]. According to our analysis, FCGR3A was over expressed and regulated by STAT1 as well as took part in Tuberculosis signaling pathway, which may be the mark of immune cells that are activated in the pathogenic process of tuberculosis. Researches have shown that ITGAX (also known as CD11C) is a surface marker expressed in most antigen-presenting cells (APCs), including macrophages [32], dendritic cells [33,34], monocytes [35], neutrophils [36], and B cells [37]. ITGAX and ITGAM (also known as CD11B) were also co-expressed in the most mononuclear phagocyte population in bronchoalveolar labage (BAL) cells of humans and cynomolgus macaques after Mtb infection [38]. And there is a study showed that BTLA (B and T lymphocyte attenuator)-expressing CD11C APCs produced more IL-6 in mixed leukocyte culture with allogenic T cells, which might favor CD8+ T cells differentiation. But this ability was impaired in active TB patients, showing that less CD8+ T cell proliferation stimulated by BTLA-expressing CD11C APCs from active tuberculosis patients [39]. IL1B was enriched in Tuberculosis signaling pathway in terms of our study, as we know, IL1B is a potent proinflammatory cytokine and plays a critical part in many inflammation-related diseases. IL1B is also important in the pathogenesis of TB in mice [40], and its polymorphisms have been suggested to have different effects on TB susceptibility, such as the polymorphism of rs1143627 (SNPs) in IL1B might influence the inflammatory response to Mtb and increase IL1B production when Mtb invades the human immune system [41].
In general, we just provided a preliminary research about the TF-miRNA gene co-regulatory network in the whole blood of TB patients. Then we mainly analyzed the 6 differently expressed genes (CEBPB, FCGR1A, FCGR3A, ITGAX, ITGAM, and IL1B) that belong to the Tuberculosis signaling pathway and conjectured they may play a critical role in the process of immune response to tuberculosis. Then we focused on the verification of the two genes (FCGR1A and CEBPB) that were with the greatest fold change among the 6 hub-genes. However, a further study is needed to verify the expression status of FCGR1A and CEBPB as potential biomarkers for early diagnosis and prediction of TB, which was also required to confirm in vitro and ex vivo. But construction of the TF-miRNA gene co-regulatory network is a helpful tool in the identification of significant regulators and their target genes in tuberculosis. This systematic approach may provide the theoretical basis for further unravel molecular mechanisms by which these important genes modulate the immune response to tuberculosis, and it may help us search novel strategy for treatment of tuberculosis in future.
Acknowledgements
This work was supported by the National Natural Science Foundation of China (81672109 and 81611130074). We also thank the Medjaden Bioscience Limited (Hong Kong, China) for editing and proofreading this manuscript.
Disclosure of conflict of interest
None.
Supporting Information
References
- 1.Maitra A, Bhakta S. TB Summit 2014: prevention, diagnosis, and treatment of tuberculosis-a meeting report of a Euroscicon conference. Virulence. 2014;5:638–644. doi: 10.4161/viru.29803. [DOI] [PMC free article] [PubMed] [Google Scholar]
- 2.Manjunatha UH, S Rao SP, Kondreddi RR, Noble CG, Camacho LR, Tan BH, Ng SH, Ng PS, Ma NL, Lakshminarayana SB, Herve M, Barnes SW, Yu W, Kuhen K, Blasco F, Beer D, Walker JR, Tonge PJ, Glynne R, Smith PW, Diagana TT. Direct inhibitors of InhA are active against Mycobacterium tuberculosis. Sci Transl Med. 2015;7:269ra3. doi: 10.1126/scitranslmed.3010597. [DOI] [PMC free article] [PubMed] [Google Scholar]
- 3.Falzon D, Mirzayev F, Wares F, Baena IG, Zignol M, Linh N, Weyer K, Jaramillo E, Floyd K, Raviglione M. Multidrug-resistant tuberculosis around the world: what progress has been made? Eur Respir J. 2015;45:150–160. doi: 10.1183/09031936.00101814. [DOI] [PMC free article] [PubMed] [Google Scholar]
- 4.Hmama Z, Pena-Diaz S, Joseph S, Av-Gay Y. Immunoevasion and immunosuppression of the macrophage by Mycobacterium tuberculosis. Immunol Rev. 2015;264:220–232. doi: 10.1111/imr.12268. [DOI] [PubMed] [Google Scholar]
- 5.Zwerling A, Behr MA, Verma A, Brewer TF, Menzies D, Pai M. The BCG World Atlas: a database of global BCG vaccination policies and practices. PLoS Med. 2011;8:e1001012. doi: 10.1371/journal.pmed.1001012. [DOI] [PMC free article] [PubMed] [Google Scholar]
- 6.Satproedprai N, Wichukchinda N, Suphankong S, Inunchot W, Kuntima T, Kumpeerasart S, Wattanapokayakit S, Nedsuwan S, Yanai H, Higuchi K, Harada N, Mahasirimongkol S. Diagnostic value of blood gene expression signatures in active tuberculosis in Thais: a pilot study. Genes Immun. 2015;16:253–260. doi: 10.1038/gene.2015.4. [DOI] [PubMed] [Google Scholar]
- 7.Pascual V, Chaussabel D, Banchereau J. A genomic approach to human autoimmune diseases. Annu Rev Immunol. 2010;28:535–571. doi: 10.1146/annurev-immunol-030409-101221. [DOI] [PMC free article] [PubMed] [Google Scholar]
- 8.Chaussabel D, Pascual V, Banchereau J. Assessing the human immune system through blood transcriptomics. BMC Biol. 2010;8:84. doi: 10.1186/1741-7007-8-84. [DOI] [PMC free article] [PubMed] [Google Scholar]
- 9.Maertzdorf J, Ota M, Repsilber D, Mollenkopf HJ, Weiner J, Hill PC, Kaufmann SH. Functional correlations of pathogenesis-driven gene expression signatures in tuberculosis. PLoS One. 2011;6:e26938. doi: 10.1371/journal.pone.0026938. [DOI] [PMC free article] [PubMed] [Google Scholar]
- 10.Kong B, Liu GB, Zhang JA, Fu XX, Xiang WY, Gao YC, Lu YB, Wu XJ, Qiu F, Wang WD, Yi LL, Zhong JX, Chen ZW, Xu JF. Elevated serum IL-35 and increased expression of IL-35-p35 or -EBI3 in CD4(+)CD25(+) T cells in patients with active tuberculosis. Am J Transl Res. 2016;8:623–633. [PMC free article] [PubMed] [Google Scholar]
- 11.Bloom CI, Graham CM, Berry MP, Rozakeas F, Redford PS, Wang Y, Xu Z, Wilkinson KA, Wilkinson RJ, Kendrick Y, Devouassoux G, Ferry T, Miyara M, Bouvry D, Valeyre D, Gorochov G, Blankenship D, Saadatian M, Vanhems P, Beynon H, Vancheeswaran R, Wickremasinghe M, Chaussabel D, Banchereau J, Pascual V, Ho LP, Lipman M, O’Garra A. Transcriptional blood signatures distinguish pulmonary tuberculosis, pulmonary sarcoidosis, pneumonias and lung cancers. PLoS One. 2013;8:e70630. doi: 10.1371/journal.pone.0070630. [DOI] [PMC free article] [PubMed] [Google Scholar]
- 12.Maertzdorf J, Repsilber D, Parida SK, Stanley K, Roberts T, Black G, Walzl G, Kaufmann SH. Human gene expression profiles of susceptibility and resistance in tuberculosis. Genes Immun. 2011;12:15–22. doi: 10.1038/gene.2010.51. [DOI] [PubMed] [Google Scholar]
- 13.Beermann J, Piccoli MT, Viereck J, Thum T. Non-coding RNAs in development and disease: background, mechanisms, and therapeutic approaches. Physiol Rev. 2016;96:1297–1325. doi: 10.1152/physrev.00041.2015. [DOI] [PubMed] [Google Scholar]
- 14.Huang Y, Shen XJ, Zou Q, Wang SP, Tang SM, Zhang GZ. Biological functions of microRNAs: a review. J Physiol Biochem. 2011;67:129–139. doi: 10.1007/s13105-010-0050-6. [DOI] [PubMed] [Google Scholar]
- 15.Kim JK, Kim TS, Basu J, Jo EK. MicroRNA in innate immunity and autophagy during mycobacterial infection. Cell Microbiol. 2017;19 doi: 10.1111/cmi.12687. [DOI] [PubMed] [Google Scholar]
- 16.Cohen TS. Role of MicroRNA in the lung’s innate immune response. J Innate Immun. 2016 doi: 10.1159/000452669. [Epub ahead of print] [DOI] [PMC free article] [PubMed] [Google Scholar]
- 17.Latorre I, Leidinger P, Backes C, Dominguez J, de Souza-Galvao ML, Maldonado J, Prat C, Ruiz-Manzano J, Sanchez F, Casas I, Keller A, von Briesen H, Knobel H, Meese E, Meyerhans A. A novel whole-blood miRNA signature for a rapid diagnosis of pulmonary tuberculosis. Eur Respir J. 2015;45:1173–1176. doi: 10.1183/09031936.00221514. [DOI] [PubMed] [Google Scholar]
- 18.Jiang C, Xuan Z, Zhao F, Zhang MQ. TRED: a transcriptional regulatory element database, new entries and other development. Nucleic Acids Res. 2007;35:D137–140. doi: 10.1093/nar/gkl1041. [DOI] [PMC free article] [PubMed] [Google Scholar]
- 19.Zakrzewska A, Cui C, Stockhammer OW, Benard EL, Spaink HP, Meijer AH. Macrophagespecific gene functions in SPI1-directed innate immunity. Blood. 2010;116:e1–11. doi: 10.1182/blood-2010-01-262873. [DOI] [PubMed] [Google Scholar]
- 20.Carotta S, Willis SN, Hasbold J, Inouye M, Pang SH, Emslie D, Light A, Chopin M, Shi W, Wang H, Morse HC 3rd, Tarlinton DM, Corcoran LM, Hodgkin PD, Nutt SL. The transcription factors IRF8 and PU. 1 negatively regulate plasma cell differentiation. J Exp Med. 2014;211:2169–2181. doi: 10.1084/jem.20140425. [DOI] [PMC free article] [PubMed] [Google Scholar]
- 21.Durbin JE, Hackenmiller R, Simon MC, Levy DE. Targeted disruption of the mouse STAT1 gene results in compromised innate immunity to viral disease. Cell. 1996;84:443–450. doi: 10.1016/s0092-8674(00)81289-1. [DOI] [PubMed] [Google Scholar]
- 22.Najjar I, Deglesne PA, Schischmanoff PO, Fabre EE, Boisson-Dupuis S, Nimmerjahn F, Bornkamm GW, Dusanter-Fourt I, Fagard R. STAT1-dependent IgG cell-surface expression in a human B cell line derived from a STAT1-deficient patient. J Leukoc Biol. 2010;87:1145–1152. doi: 10.1189/jlb.1109714. [DOI] [PubMed] [Google Scholar]
- 23.von Both U, Kaforou M, Levin M, Newton SM. Understanding immune protection against tuberculosis using RNA expression profiling. Vaccine. 2015;33:5289–5293. doi: 10.1016/j.vaccine.2015.05.025. [DOI] [PMC free article] [PubMed] [Google Scholar]
- 24.Riley JK, Takeda K, Akira S, Schreiber RD. Interleukin-10 receptor signaling through the JAK-STAT pathway. Requirement for two distinct receptor-derived signals for anti-inflammatory action. J Biol Chem. 1999;274:16513–16521. doi: 10.1074/jbc.274.23.16513. [DOI] [PubMed] [Google Scholar]
- 25.Gautier EL, Shay T, Miller J, Greter M, Jakubzick C, Ivanov S, Helft J, Chow A, Elpek KG, Gordonov S, Mazloom AR, Ma’ayan A, Chua WJ, Hansen TH, Turley SJ, Merad M, Randolph GJ Immunological Genome Consortium. Gene-expression profiles and transcriptional regulatory pathways that underlie the identity and diversity of mouse tissue macrophages. Nat Immunol. 2012;13:1118–1128. doi: 10.1038/ni.2419. [DOI] [PMC free article] [PubMed] [Google Scholar]
- 26.Huber R, Pietsch D, Panterodt T, Brand K. Regulation of C/EBPbeta and resulting functions in cells of the monocytic lineage. Cell Signal. 2012;24:1287–1296. doi: 10.1016/j.cellsig.2012.02.007. [DOI] [PubMed] [Google Scholar]
- 27.Jacobsen M, Repsilber D, Gutschmidt A, Neher A, Feldmann K, Mollenkopf HJ, Ziegler A, Kaufmann SH. Candidate biomarkers for discrimination between infection and disease caused by Mycobacterium tuberculosis. J Mol Med (Berl) 2007;85:613–621. doi: 10.1007/s00109-007-0157-6. [DOI] [PubMed] [Google Scholar]
- 28.Joosten SA, Goeman JJ, Sutherland JS, Opmeer L, de Boer KG, Jacobsen M, Kaufmann SH, Finos L, Magis-Escurra C, Ota MO, Ottenhoff TH, Haks MC. Identification of biomarkers for tuberculosis disease using a novel dual-color RT-MLPA assay. Genes Immun. 2012;13:71–82. doi: 10.1038/gene.2011.64. [DOI] [PubMed] [Google Scholar]
- 29.Sutherland JS, Loxton AG, Haks MC, Kassa D, Ambrose L, Lee JS, Ran L, van Baarle D, Maertzdorf J, Howe R, Mayanja-Kizza H, Boom WH, Thiel BA, Crampin AC, Hanekom W, Ota MO, Dockrell H, Walzl G, Kaufmann SH, Ottenhoff TH GCGH Biomarkers for TB consortium. Differential gene expression of activating Fcgamma receptor classifies active tuberculosis regardless of human immunodeficiency virus status or ethnicity. Clin Microbiol Infect. 2014;20:O230–238. doi: 10.1111/1469-0691.12383. [DOI] [PubMed] [Google Scholar]
- 30.Laux da Costa L, Delcroix M, Dalla Costa ER, Prestes IV, Milano M, Francis SS, Unis G, Silva DR, Riley LW, Rossetti ML. A real-time PCR signature to discriminate between tuberculosis and other pulmonary diseases. Tuberculosis (Edinb) 2015;95:421–425. doi: 10.1016/j.tube.2015.04.008. [DOI] [PMC free article] [PubMed] [Google Scholar]
- 31.Sadki K, Lamsyah H, Rueda B, Akil E, Sadak A, Martin J, El Aouad R. Analysis of MIF, FCGR2A and FCGR3A gene polymorphisms with susceptibility to pulmonary tuberculosis in Moroccan population. J Genet Genomics. 2010;37:257–264. doi: 10.1016/S1673-8527(09)60044-8. [DOI] [PubMed] [Google Scholar]
- 32.Mattila JT, Ojo OO, Kepka-Lenhart D, Marino S, Kim JH, Eum SY, Via LE, Barry CE 3rd, Klein E, Kirschner DE, Morris SM Jr, Lin PL, Flynn JL. Microenvironments in tuberculous granulomas are delineated by distinct populations of macrophage subsets and expression of nitric oxide synthase and arginase isoforms. J Immunol. 2013;191:773–784. doi: 10.4049/jimmunol.1300113. [DOI] [PMC free article] [PubMed] [Google Scholar]
- 33.Poltorak MP, Schraml BU. Fate mapping of dendritic cells. Front Immunol. 2015;6:199. doi: 10.3389/fimmu.2015.00199. [DOI] [PMC free article] [PubMed] [Google Scholar]
- 34.Csiffary A, Ruttner Z, Toth Z, Palkovits M. Oxytocin nerve fibers innervate beta-endorphin neurons in the arcuate nucleus of the rat hypothalamus. Neuroendocrinology. 1992;56:429–435. doi: 10.1159/000126259. [DOI] [PubMed] [Google Scholar]
- 35.Rosas-Taraco AG, Arce-Mendoza AY, Caballero-Olin G, Salinas-Carmona MC. Mycobacterium tuberculosis upregulates coreceptors CCR5 and CXCR4 while HIV modulates CD14 favoring concurrent infection. AIDS Res Hum Retroviruses. 2006;22:45–51. doi: 10.1089/aid.2006.22.45. [DOI] [PubMed] [Google Scholar]
- 36.Lewis SM, Treacher DF, Edgeworth J, Mahalingam G, Brown CS, Mare TA, Stacey M, Beale R, Brown KA. Expression of CD11c and EMR2 on neutrophils: potential diagnostic biomarkers for sepsis and systemic inflammation. Clin Exp Immunol. 2015;182:184–194. doi: 10.1111/cei.12679. [DOI] [PMC free article] [PubMed] [Google Scholar]
- 37.Rubtsov AV, Rubtsova K, Kappler JW, Jacobelli J, Friedman RS, Marrack P. CD11c-expressing B cells are located at the T cell/B cell border in spleen and are potent APCs. J Immunol. 2015;195:71–79. doi: 10.4049/jimmunol.1500055. [DOI] [PMC free article] [PubMed] [Google Scholar]
- 38.Silver RF, Myers AJ, Jarvela J, Flynn J, Rutledge T, Bonfield T, Lin PL. Diversity of human and macaque airway immune cells at baseline and during tuberculosis infection. Am J Respir Cell Mol Biol. 2016;55:899–908. doi: 10.1165/rcmb.2016-0122OC. [DOI] [PMC free article] [PubMed] [Google Scholar]
- 39.Wang WD, Gao YC, Lu YB, Zhang JA, Liu GB, Kong B, Xiang WY, Dai YC, Yu SY, Jia Y, Fu XX, Yi LL, Zheng BY, Chen ZW, Zhong J, Xu JF. BTLA-expressing CD11c antigen presenting cells in patients with active tuberculosis exhibit low capacity to stimulate T cell proliferation. Cell Immunol. 2017;311:28–35. doi: 10.1016/j.cellimm.2016.09.015. [DOI] [PubMed] [Google Scholar]
- 40.Mishra BB, Rathinam VA, Martens GW, Martinot AJ, Kornfeld H, Fitzgerald KA, Sassetti CM. Nitric oxide controls the immunopathology of tuberculosis by inhibiting NLRP3 inflammasome-dependent processing of IL-1beta. Nat Immunol. 2013;14:52–60. doi: 10.1038/ni.2474. [DOI] [PMC free article] [PubMed] [Google Scholar]
- 41.Zhang G, Zhou B, Li S, Yue J, Yang H, Wen Y, Zhan S, Wang W, Liao M, Zhang M, Zeng G, Feng CG, Sassetti CM, Chen X. Allele-specific induction of IL-1beta expression by C/EBPbeta and PU. 1 contributes to increased tuberculosis susceptibility. PLoS Pathog. 2014;10:e1004426. doi: 10.1371/journal.ppat.1004426. [DOI] [PMC free article] [PubMed] [Google Scholar]
Associated Data
This section collects any data citations, data availability statements, or supplementary materials included in this article.