

Abstract
Introduction
Phenylketonuria (PKU) is an autosomal recessive disorder characterized by a deficiency in phenylalanine (Phe) hydroxylase activity. Early diagnosis and continuous treatment with a low Phe diet prevents severe neurological and cognitive impairment.
Aims
1. Analyze how treatment adherence evolves through infancy, childhood, and early adolescence in individuals with PKU. 2. Identify early signs of treatment discontinuation.
Methodology
This longitudinal, retrospective study included 75 children diagnosed through newborn screening, ages 7 to 13 years. Data on blood Phe concentration, number of blood samples sent, proportion of samples with Phe concentrations over the recommended range, and number of visits to the metabolism clinic were recorded. Logistic regression analysis was used to identify the variables that predict treatment discontinuation before 13 years of age.
Results
A progressive increase in mean blood Phe concentrations with age was identified. The greatest increase occurred between the first and second years of life. By age ten, mean Phe blood concentration of the group was above the recommended range. The proportion of samples with Phe concentrations over the recommended range also increased with age, from an average of 13% during the first year of life to 67% in early adolescence. Sixty-eight percent of the children attended the outpatient clinic and sent samples from birth to the time of the study. Individuals who discontinued follow-up showed significantly higher mean blood Phe concentrations (360 vs. 220.9 μmol/L; p = 0.004) and the proportion of samples over the recommended range (37% vs. 12% p = 0.002) was significantly higher during the second year of life. Mean age for children who discontinued treatment was 5.5 years of age. Blood Phe concentration values at 12 to 23 months of age and at 6 to 8 years of age significantly predicted treatment discontinuation before 13 years of age.
Conclusion
Treatment adherence in PKU diminishes with age. Early signs of treatment discontinuation can be identified during the second year of life, allowing preventive interventions in high risk groups.
Keywords: Adherence, Phenylketonuria, PKU, IQ
1. Introduction
Phenylketonuria (PKU) is an autosomal recessive disorder characterized by a deficiency in phenylalanine hydroxylase activity, causing increased phenylalanine (Phe) plasma and tissue concentrations. Left untreated, PKU leads to severe intellectual disability. Early diagnosis and continuous treatment with a low Phe diet prevents severe neurological and cognitive impairment in affected individuals, with the achievement of intelligence quotients (IQs) within the average range, but lower than control groups [1], [2], [3], [4], [5], [6], [7].
Treatment for PKU requires avoidance of high protein foods, such as all meats, dairy, nuts, beans, and eggs and allows for only measured amounts of grains, fruits, and vegetables. A special formula provides the necessary nutrients found in protein without the phenylalanine. The diet is extremely restrictive and the formula has a strong taste and odor, which makes adherence to treatment extremely challenging [8], [9].
In a study of treatment adherence in 56 Brazilian PKU patients, in which adherence was defined by the median Phe concentration for a 12-month period, only 32.1% of the samples attained the targeted Phe levels: for children < 13 years this was ≤ 360 μmol/L; for children ≥ 13 years, the target was ≤ 900 μmol/L [10].
Progressive deterioration in metabolic control has also been reported with age. Data from a survey of 10 European centers with a total of 1921 patients showed that at age one, the median blood Phe concentration was 175 μmol/L; between 1 and 3 years, the median was 230 μmol/L; between 4 and 10 years the median was 287 μmol/L; between 11 and 16 years the median was 465 μmol/L; and over 16 years the median was 777 μmol/L. Also, the median percentage of blood samples meeting guidelines tended to diminish with age [11].
Similar results were reported by Meli and Bianca [12]. In this sample, blood Phe concentrations were greater than the recommended value in none of the patients younger than 1 year of age, in 8% of the 1- to 6-year-olds, 18% of the 6- to 10-year-olds, 40% of the 10- to 14-year-olds, and 70% of those older than 14 years.
When trying to understand how compliance to treatment changes in different stages of life, what the underlying causes are, and the impact of non-compliance to treatment in PKU, it must be understood that there is no agreement regarding which compliance measures are most important and how they should be defined. As Mac Donald [8] proposes, direct assessment of blood Phe concentration is perhaps the best overall measure, but there is still no consensus regarding the number of Phe concentrations that should be within target range over time and the frequency or timing of the measure. Also, most studies of compliance in PKU focus on short periods (12 to 24 months) and follow the same patients over longer periods of time.
In Chile, the prevalence is 1/18,916 births for PKU and 1/10,198 births for mild hyperphenylalaninemia (mHPA). Since 1992, Chile has had a national neonatal screening program for phenylketonuria that covers 99% of newborns. Children with classical PKU (Phe ≥ 20 mg/dL [1200 μmol/L]), mild PKU (Phe 6 to 19 mg/dL [360 to 1190 μmol/L]) and also mHPA (Phe 2 to 6 mg/dL1[20 to 360 μmol/L]) enter a follow-up program for hyperphenylalaninemia (HPA) at the Institute of Nutrition and Food Technology (INTA), University of Chile national referral center. The follow-up program for children with PKU and mHPA includes regular measurements of Phe and tyrosine levels, as well as specialized assessments by a multidisciplinary team of pediatricians, nutritionists, neurologists, and psychologists. From diagnosis to adulthood multiple resources are used in patient education, from group workshops, written materials, individual/family education sessions, apps, among others.
Phe concentrations were both home monitored (samples taken at home and sent by mail) and monitored during clinical visits. Until 2010 the targeted blood Phe concentration of the Center was < 6 mg/dL during the first years of life and < 8 mg/dL (480 μmol/L) for patients age 10 years or older. Currently, the targeted blood Phe concentrations are ≤ 4 mg/dL (240 μmol/L) during the first year of life and < 6 mg/dL (360 μmol/L) after that. Nutritional treatment should be maintained for life. All PKU patients from birth to age 24 years have access through government subsidy to Phe free formula at no charge.
The present study seeks to describe and understand how treatment compliance changes through infancy, childhood, and early adolescence in PKU patients. We also aim to identify early indicators of poor treatment compliance and risk of treatment discontinuation that could be addressed to prevent poor cognitive outcome in early-diagnosed patients.
2. Subjects and methods
This longitudinal, retrospective study included all children diagnosed through newborn screening in Chile between February 2001 and October 2008 (age 7 years to 13 years 11 months, median age: 11.4 years). Data on a total of 75 patients (33 females and 42 males) with a mean age of diagnosis confirmation of 15.8 days of life (range 2 to 45; SD = 7.3) and average Phe blood concentration of 18.8 mg/dL (1138 μmol/L) (range 6 to 38.5 mg/dL; SD = 7.8) at diagnosis were analyzed. Treatment of all patients was initiated immediately after diagnostic confirmation. All included patients received a protein-restricted diet and had access to Phe-free formula at no cost, through government subsidy. No patients were receiving sapropterin treatment.
Yearly mean Phe concentration, number of blood samples sent, proportion of samples over the recommended range, and visits to the outpatient clinic were recorded for all patients. Given the relevance of early years on neurological development, data from the first year of life through age 4 years were analyzed separately in four groups, namely 0 to 11 months, 12 to 23 months, 24 to 35 months, and 36 to 48 months. Data from 4 years of age onward were analyzed in two-year periods, including 4 to 5 years and 11 months, 6 years to 7 years and 11 months, 8 years to 9 years and 11 months, 10 years to 11 years to 11 months, and 12 years to 12 years and 11 months.
Patients' treatment discontinuation was defined as no attendance to the outpatient clinic in a two-year period and no blood samples sent in a one-year period, both together.
Changes in the number of samples provided by the participants across the different assessment times were assessed with a repeated-measures ANOVA, Greenhouse-Geisser corrections were applied when sphericity assumptions were not met. Changes in blood Phe levels were assessed with a Friedman's ANOVA, since the variables were not normally distributed. Additional post hoc analyses were conducted using Wilcoxon signed-rank tests with a Bonferroni correction applied.
A hierarchical regression analysis was conducted to explore the prospective contribution of blood Phe levels measured across the participants´ first to seventh year of age to blood Phe levels at 8–10 years of age. Blood Phe levels measured at each assessment time were entered separately into the equation to control for the influence of earlier blood Phe levels. Results were tested against Bonferroni corrected p values.
The Shapiro-Wilk test was used to verify normal distribution of the data. Treatment adherence variables from individuals who did and did not discontinue treatment before 13 years of age were compared using Student's t-test. When normal distribution of a variable could not be proven, the nonparametric Mann-Whitney test was used. Additionally, child development and cognitive performance between groups was compared by using the nonparametric Mann-Whitney test. It was hypothesized that the participants in the group who discontinued treatment before 13 years of age would have poorer treatment compliance as expressed in all the measured variables. Therefore, significance was tested against 1-tailed p values.
A series of independent logistic regression analyses were conducted to ascertain the effect of the above mentioned treatment adherence variables measured at each assessment time on the likelihood that participants would discontinue treatment before 13 years of age. The variables were entered into the equation using the Enter method. Data were analyzed using SPSS 21.
3. Results
The results show a progressive increase in mean blood Phe concentrations with age. A Friedman's ANOVA analysis showed a statistically significant difference in blood Phe levels measured at different assessment times, χ2(7) = 79.32, p = 0.000. Post hoc analyses with Wilcoxon signed-rank tests were conducted with a Bonferroni correction applied, resulting in a significance level set at p < 0.007. A significant increase in Phe levels was observed between the participant's first and second year of life (Z = − 3.869, p = 0.000) with an increase of 1.1 mg/dL (66.1 μmol/L), and between the participants' second and third year of life (Z = − 2.756, p = 0.006). There were no significant differences between blood Phe levels measured at 36–48 months and at 4 years–5 years 11 months of age. However, there was a statistically significant increase in blood Phe levels between the age ranges of 6–7 years 11 months of age and 8–9 years 11 months of age (Z = − 3.381, p = 0.001).
By age ten, the mean Phe blood concentration of the group was above the recommended range (< 6 mg/dL) (Fig. 1).
Fig. 1.
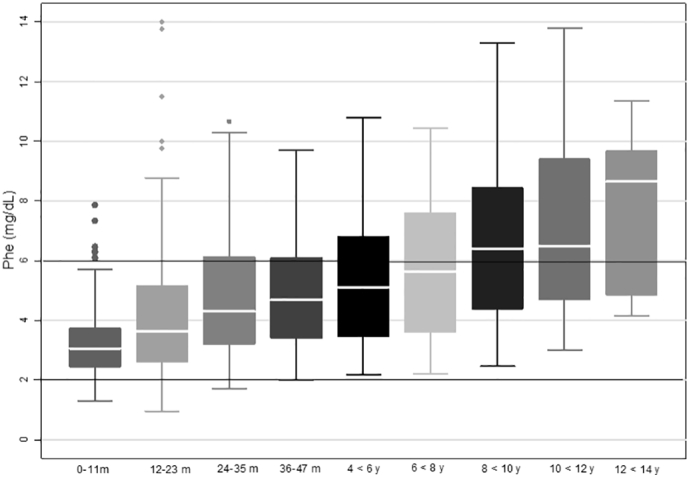
Mean blood Phe concentrations according to age period.
As expected, the proportion of samples with Phe concentrations over 6 mg/dL (360 μmol/L) also increased with age, rising from an average of 13% during the first year of life to 67% in early adolescence. However, between 12 years and 13 years 11 months of age only 6 participants were in the studied group (Table 1).
Table 1.
Descriptive analysis of treatment adherence variables from 0 months to 13 years of age.
| Age (years: y, m: months) | Proportion of samples with Phe > 6 mg/dL (> 360 μmol/L) | Mean blood samples sent per year | Mean outpatient clinic visits per year |
|---|---|---|---|
| 0–11 m (n = 73) | 13% | 29.0 | 11.8 |
| 12–23 m (n = 72) | 20% | 16.1 | 4.5 |
| 24–35 m (n = 73) | 28% | 12.6 | 3.5 |
| 36–48 m (n = 70) | 31% | 11.1 | 2.7 |
| 4 y–5 y 11 m (n = 67) | 34% | 10.8 | 2.0 |
| 6 y–7 y 11 m (n = 61) | 42% | 8.0 | 1.7 |
| 8 y–9 y 11 m (n = 42) | 52% | 8.0 | 1.3 |
| 10 y–11 y 11 m (n = 25) | 52% | 7.5 | 1.1 |
| 12 y–13 y 11 m (n = 6) | 67% | 6.4 | 0.9 |
A hierarchical regression analysis showed that blood Phe levels from the second to the seventh year of age made a significant contribution to blood Phe levels at 8–10 years of age. Detailed results of the contribution of individual predictors are in Table 2.
Table 2.
Summary of hierarchical regression analyses predicting blood Phe levels at 8–10 years of age.
| Model | R2 | Adj R2 | F | df | Significant contributors |
||
|---|---|---|---|---|---|---|---|
| Variable | t | Beta | |||||
| 1 | 0.03 | 0.01 | 1.28 | (1,35) | |||
| 2 | 0.19 | 0.14 | 4.22⁎ | (2,34) | Phe-2 | 2.65⁎ | 0.49 |
| 3 | 0.32 | 0.26 | 5.59⁎⁎ | (3,33) | Phe-3 | 2.63⁎ | 0.49 |
| 4 | 0.33 | 0.26 | 4.38⁎⁎ | (4,32) | Phe-3 | 2.04⁎ | 0.42 |
| 5 | 0.40 | 0.31 | 4.52⁎⁎ | (5,31) | |||
| 6 | 0.42 | 0.32 | 4.0⁎⁎ | (6,30) | |||
| 7 | 0.60 | 0.51 | 6.90⁎⁎ | (7,29) | Phe-7 | 3.80⁎⁎ | 0.75 |
Note. Phe-2 = Phe at 12–23 months of age, Phe-3 = Phe at 24–35 months of age, Phe-5 = Phe at 4 years to 4 years 11 months of age, Phe-7 = Phe at 6 years to 7 years 11 months of age.
Predictors. Model 1: (constant), Phe at 1–11 months of age.
Model 2: (constant), Phe at 1–11 months of age, Phe at 12–23 months of age.
Model 3: (constant), Phe at 1–11 months of age, Phe at 12–23 months of age, Phe at 24–35 months of age.
Model 4: (constant), Phe at 1–11 months of age, Phe at 12–23 months of age, Phe at 24–35 months of age, Phe at 3 years to 3 years 11 months.
Model 5: (constant), Phe at 1–11 months of age, Phe at 12–23 months of age, Phe at 24–35 months of age, Phe at 3 years to 3 years 11 months, Phe at 4 years to 4 years 11 months.
Model 6: (constant), Phe at 1–11 months of age, Phe at 12–23 months of age, Phe at 24–35 months of age, Phe at 3 years to 3 years 11 months, Phe at 4 years to 4 years 11 months, Phe at 5–6 years of age.
Model 7: (constant), Phe at 1–11 months of age, Phe at 12–23 months of age, Phe at 24–35 months of age, Phe at 3 years to 3 years 11 months, Phe at 4 years to 4 years 11 months, Phe at 5–6 years of age, Phe at 6–8 years of age.
p < 0.05.
p < 0.01.
The mean number of samples sent also diminished significantly in the first three years of life, (Table 1). A repeated-measures ANOVA revealed that there were significant changes in the number of samples provided by the participants across the different assessment times F(1.19, 22.63) = 4.72. Contrasts revealed that number of samples provided during the first year of life (1–11 months of age) was larger than those provided during the second year of life (12–23 months of age) F(1, 19) = 75.31, p = 0.000. Similarly, the number of samples provided during the second year of life was larger than during the third year of life (24–35 months of age) F(1, 19) = 21.58, p = 0.000. No other significant differences were observed.
The number of patients with poor treatment compliance (defined as > 25% of samples > 6 mg/dL), increased with age. From age 1 to 10–12 years the percentage of patients with a proportion samples over the recommended range increased from 14% to 76% (see Table 3). During the first three years of life, the proportion of patients with mean Phe concentrations over the recommended range doubled each year. Between ages four and six years, more than one-third of the patients' mean Phe concentrations were over the recommended range. From age 8 years onward, more than half of the patients reported mean Phe concentrations over the recommended range (see Table 3).
Table 3.
Descriptive analysis of the proportion of patients to comply with treatment guidelines from 0 months to 13 years of age.
| Age (years: y, m: months) | Proportion of patients mean Phe > 6 mg/dL (> 360 μmol/L) | Proportion of patients with > 25% of samples with Phe 6 > mg/dL (> 360 μmol/L) | Proportion of patients with an insufficient number of yearly blood samples |
|---|---|---|---|
| 0–11 m (n = 73) | 7% | 14% | 2% |
| 12–23 m (n = 72) | 13% | 28% | 7% |
| 24–35 m (n = 73) | 26% | 43% | 19% |
| 36–48 m (n = 70) | 26% | 49% | 26% |
| 4 y–5 y 11 m (n = 67) | 34% | 52% | 42% |
| 6 y–7 y 11 m (n = 61) | 46% | 66% | 56% |
| 8 y–9 y 11 m (n = 42) | 55% | 64% | 60% |
| 10 y–11 y 11 m (n = 25) | 60% | 76% | 60% |
| 12 y–13 y 11 m (n = 6) | 67% | 100% | 83% |
Regarding the number of visits to the outpatient clinic, during the first year of life, the mean number of visit was of 11.8 (range 2–20 visits; SD 4.2). During this period, the minimum number of recommended visits was 12. In the second year of life, the mean number of visit was 4.52 (range 0–11; SD 3.48). During this period the minimum number of recommended visits was 4. In the following years the number of visits continued to diminish. From ages 3 to 14, the minimum number of recommended visits per year was 3. By age 10 to 11 years, the mean number of visits was of 1.08 visits per year (see Table 3).
The number of patients sending an insufficient number of blood samples per year was 2% in the first year of life (minimum of 17 samples per year). By puberty > 60% of the patients sent an insufficient number of samples (minimum of 12 samples per year) (Table 3).
3.1. Follow-up discontinuation
Of the 75 patients, 51 (68%) attended the outpatient clinic and sent samples from birth to the end of the study period, regardless of metabolic control. The mean full scale IQ (FSIQ) at school age of the group that continued treatment was 93.7 ± 15.
Fifteen (20%) patients discontinued follow-up treatment, defined as no attendance at the outpatient clinic in a two-year period and no blood samples sent in a one-year period. The average age of follow-up discontinuation was 5.5 years, and half of these patients were between ages 4 and 6 years when they ceased sending blood samples and attending the outpatient clinic. In this group, IQ assessment data obtained by age appropriate Wechsler Scale, were available for only 7 patients before discontinuation. Mean FSIQ was 86 ± 13, and only 3 of the 6 patients preformed within the average range.
Five patients (7%) discontinued follow up, but later resumed. The mean FSIQ in this group was 74 ± 13 and only 1 of the 5 patients performed within the average range after follow-up resumption.
Four patients (5%) stopped attending outpatient clinic between ages 8 to 11 years of age, but continued to send blood samples. All four children had performed within the average range with a mean FSIQ of 97.2 ± 11 prior to discontinuing attendance at the outpatient clinic.
To identify possible early signs that could suggest follow-up discontinuation, the group of patients who discontinued follow up (completely or partially) was compared to those who did not. During the first year of life, the proportion of samples over the recommended range in the group to discontinue was 19% compared to 10% in the rest of the patients, but this difference was not statistically significant. During the second year of life (between 12 and 23 months of age) the group of patients to later discontinue showed significantly higher mean Phe blood concentration (5.96 mg/dL (360 μmol/L) compared to 3.65 mg/dL (220.1 μmol/L); U = 333.5, p = 0.004). And, 59% of the children who later discontinued follow up, partially or completely, presented mean Phe concentrations over the recommended range, compared with only 6% of the remainder of the group. The proportion of samples over the recommended range was significantly higher in the group to discontinue follow up, 37% vs. 12% (U = 210, p = 0.002) during second year of life.
When comparing both groups during the third year of life, a significantly higher mean Phe blood concentration was noted in the group to discontinue follow up (5.7 vs. 4.4 mg/dL (345 vs 266 μmol/L); U = 397 p = 0.031) as well as a higher proportion of samples over the recommended range (40% vs. 23% U = 319.5 p = 0.028). Also during this period, the group that discontinued submitted fewer blood samples (median 12 vs. 9; U = 338 p = 0.05).
Between ages 4 and 6 years, mean Phe concentrations were also significantly higher in the group that discontinued treatment (6.7 vs. 4.8 mg/dL U = 262, p = 0.005) as was the percentage of samples over the recommended range (48% vs. 29%, U = 309.5, p = 0.031).
Logistic regression analyses included the following variables to predict treatment discontinuation before 13 years of age: Phe levels, Phe standard deviation, number of blood samples submitted, and proportion of samples with Phe levels > 6 mg/dL at each assessment time. Following multicollinearity analysis, the proportion of samples with Phe levels > 6 mg/dL was removed from the analyses.
The logistic regression models identified variables from periods between 12 and 23 months of age and 6 to 8 years of age as significant. Variables from age 12 to 23 months (χ2(3) = 13.689, p < 0.01) explained 29% (Nagelkerke R2) of the variance in adherence to treatment and correctly classified 75% of cases. Higher Phe levels were associated with an increase in the likelihood of discontinuing treatment before 13 years of age (OR = 1751; IC 95% 1109–2764; p = 0,016). Similarly, the model including data from ages 6 to 8 years of age (χ2(3) = 14.499, p < 0.01) explained 30.1% (Nagelkerke R2) of the variance in adherence to treatment and correctly classified 77% of cases. Again, for ages 6 to 8 years, higher Phe levels were associated with an increased treatment discontinuation (OR = 1.682; IC 95% 1199–2358; p = 0,003).
4. Discussion
Since 1992, 216 early diagnosed phenylketonuria and 184 mild hyperphenylalaninemia patients have entered a follow-up program for PKU patients at the Laboratory of Genetic and Metabolic Diseases of INTA, University of Chile.
Early diagnosis and nutritional treatment resulted in dramatic improvement in the prognosis for patients with PKU in our group, as in many other centers worldwide. Despite this success, medical management of PKU is complex and challenging for the patients and their parents. Many barriers have been described to treatment compliance, such as access to specialized food, educational background, family and social characteristics among others [8].
Although alternative therapies are now effective in some patients and are available in some countries, most patients continue to require protein-restricted diets and Phe-free formula. Moreover, the targeted Phe blood concentrations has progressively decreased and treatment is now recommended to be maintained for life. Understanding how treatment adherence changes as the child gets older is helpful in developing age-appropriate strategies to promote health behaviors, especially during critical periods even before suboptimal results are identified.
When comparing our results to European countries it is possible to see that the mean Phe concentrations we have reported are slightly above the mean of 10 European centers, but still maintaining mean Phe under 6 mg/dL until 8 years of age. For example, during the first year of life mean Phe concentrations of our group (3.2 mg/dL) are similar to the ones reported in Turkey, The Netherlands, and Belgium. During puberty, the mean Phe concentration of our group (6.9 mg/dL) are similar to those in Belgium, higher than those in Italy and The Netherlands; but lower than those in Denmark, Norway, Poland and Turkey [13] (supplementary table). Also, when comparing our results to results reported by [14] in a study that included 47 PKU patients age 6 to 18, from the United States, our group showed lower mean Phe concentrations from first years (year or years?) of life until age 10 years.
Harnett [15] studied metabolic control in a group of 33 PKU patients in Canada during childhood. Good metabolic control was defined as > 60% of the samples being in the recommended range (2–6 mg/dL [120–360 μmol/L]). Approximately 61% of the patients did not meet good adherence criteria during the first year of life. For our group only 14% did not meet good adherence criteria (good compliance defined as ≥ 75% being in the recommended range). Our group also showed a greater percentage of patients with a proportion of samples in the recommended age between age 1 and 6 years, yet in the group between 6 and 12 years of age, the results are similar to those in other countries.
Regarding treatment discontinuation, when comparing our results to recent reports on adherence in PKU patients, it was possible to observe that in our group only 5% of the patients between 0 and 4 years of age where lost to follow up, compared with 10% reported by Jureki et al. [16] in patients in the United States. Between 5 and 12 years of age, 15% percent of the patients in our group were lost to follow up, compared with 12% reported in the mentioned study.
Our study demonstrated the possibility of identifying early signs of treatment discontinuation during the first years of life and the importance of using different indicators of treatment adherence simultaneously. Specifically it was possible to observe that during the first year of life children to later discontinue follow-up had a higher mean Phe concentration and proportion of blood samples with Phe concentration over the recommended range. Between 12 and 23 months of age, these patients had significantly higher mean Phe concentrations and proportions of samples over the recommended range.
During the second year of life, submitting a diminished number of blood samples might also be relevant. Overall, 64% of patients who had an insufficient number of blood samples sent (nine or fewer per year) between 12 and 23 months of age later discontinued treatment.
However, our models showed that when more than one variable was included in the analyses, we were able to more accurately predict which children would discontinue treatment. Indicators included number of samples, number of visits to outpatient clinic, as well as Phe levels and variability in metabolic control. By considering multiple indicators, we can better identify children and families who may need additional support, education, or counseling. In addition, this allows for the possibility of intervening early to increase treatment adherence before cognitive functioning is affected.
When analyzing the number of outpatient clinic visits, a limitation of the study was not including data on the location where the child lived. Location is relevant in this group since some of our most remote patients live > 1000 miles from the clinic. For this reason, nutritional counseling is frequently given by telephone. These data were not included in the analysis.
Despite this limitation, the information presented in this article has helped define a set of strategies implemented in our Center to promote treatment adherence in our young PKU patients. One strategy has been to focus on identifying early risk factors in the following areas: low parental degree of understanding or acceptance of the condition, insufficient number of blood samples sent, no request for blood sample results, elevated Phe blood concentration, insufficient Phe free formula intake, missing outpatient clinic visits and psychosocial risk factors.
When one or more of these areas are affected in infants and children, the patient is assigned to our high priority group. These cases are addressed in a monthly meeting where a physician, nutritionist, psychologist and social worker develop the most appropriate strategy to support the patient and his/her family. Cases of older children with very poor treatment compliance or who require social services protection due to severe parental neglect are also addressed in this way. In the upcoming years, we intend to report on the long-term impact of these strategies.
Conflict of interest
María Ignacia García declares that she has no conflict of interest.
Gabriela Araya declares that she has no conflict of interest.
Susan E Waisbren receives honorarium as consultant to Bio Marin Inc. doing scoring of neuropsychological tests. She is not involved in prescribing any medications.
Alicia de la Parra declares that she has no conflict of interest.
Informed consent
All procedures followed were in accordance with the ethical standards of the responsible committee on human experimentation (institutional and national) and with the Helsinki Declaration of 1975, as revised in 2000. Institute of Nutrition and Food Technologies IRB approved a waiver of consent for registries and chart reviews.
Details of the contributions of individual authors
María Ignacia García contributed to the study conception and design; acquisition, analysis and interpretation of the data, and drafting of the manuscript.
Gabriela Araya contributed to the acquisition and analysis of the data.
Susan E Waisbren contributed to the interpretation of data and revisions to the manuscript with respect to intellectual content.
Soledad Coo contributed to the analysis and interpretation of the data and drafting of the manuscript.
Alicia de la Parra contributed to the study conception and design, acquisition, analysis and interpretation of the data, and revising the manuscript.
All authors gave final approval of the present manuscript.
Financial disclosures
The study was not funded by any grant. The study was supported by the Laboratory of Genetics and Metabolic Diseases, INTA, University of Chile.
Acknowledgements
The authors would like to acknowledge the medical, nutritionist and laboratory staff of the LabGEM of INTA, University of Chile, for their assistance. And also to all the children that have participated of this study.
References
- 1.Berry H.K., O. D. Intellectual development and academic achievement of childrens treated early for phenylketonuria. Dev. Med. Child Neurol. 1979;21(3):311–320. doi: 10.1111/j.1469-8749.1979.tb01623.x. [DOI] [PubMed] [Google Scholar]
- 2.Burgard P., Schmidt E., Rupp A., Schneider W., Bremer H. Intellectual development of the patients of German collaborative study of children treated for phenylketonuria. Eur. J. Pediatr. 1996;55(1):S33–S38. doi: 10.1007/pl00014245. [DOI] [PubMed] [Google Scholar]
- 3.Gassió R., Fusté E., López-Sala A., Artuch R., Villaseca M. School performance in early and continuously treated phenylketonuria. Peditr. Neurol. 2005;33(4):267–271. doi: 10.1016/j.pediatrneurol.2005.05.003. [DOI] [PubMed] [Google Scholar]
- 4.Griffiths P., D. C., Fay N., Robinson P., Davidson D. Wechsler subscale IQ and subtest profile in early treated phenylketonuria. Arch. Dis. Child. 2000;82:209–215. doi: 10.1136/adc.82.3.209. [DOI] [PMC free article] [PubMed] [Google Scholar]
- 5.Ris M., Williams S., Hunt M., Berry H., Leslie N. Early-treated phenylketonuria: adult neuropsychologic outcome. J. Pediatr. 1994;124(3):388–392. doi: 10.1016/s0022-3476(94)70360-4. [DOI] [PubMed] [Google Scholar]
- 6.Salardi S., Missiroli G., Piazzi S., Mandini M., Cassio A., Colli C., Tacconi M., Tolomelli M., Cacciari E. Neuropsychological follow-up of children with phenylketonuria treated early. Med. Surg. Pediatr. 1992;14(14):409–413. [PubMed] [Google Scholar]
- 7.Waisbren S., Mahon B., Schnell R. Predictors of intelligence quotient and intelligence quotient change in persons treated for phenylketonuria. Pediatrics. 1987;79(3):351–355. [PubMed] [Google Scholar]
- 8.MacDonald A., v. R. Adherence issues in inherited metabolic disorders treated by low natural protein diets. Ann. Nutr. Metab. 2012;61(4):289–295. doi: 10.1159/000342256. [DOI] [PubMed] [Google Scholar]
- 9.MacDonald A., Gizewska M., Giovannini M., Walter J. The reality of dietary compliance in the management of phenylketonuria. J. Inherit. Metab. Dis. 2010:665–670. doi: 10.1007/s10545-010-9073-y. [DOI] [PubMed] [Google Scholar]
- 10.Vieira T.A., Naline T., Krug B.C., Matzenbacher C., Brickmann C., Doederlein I. Adherence to treatment of phenylketonuria. J. Inborn Errors Metab. Screen. 2015:1–7. [Google Scholar]
- 11.Ahring K., B.-Q., A.-O. Blood phenylalanine control in phenylketonuria: a survey of 10 European centres. Eur. J. Clin. Nutr. 2011;65(2):275–278. doi: 10.1038/ejcn.2010.258. [DOI] [PubMed] [Google Scholar]
- 12.Meli C., B. S. Dietary control of phenylketonuria. Lancet. 2002;360 doi: 10.1016/S0140-6736(02)11958-1. [DOI] [PubMed] [Google Scholar]
- 13.Blau N., B.-Q. A. Management of phenylketonuria in Europe: survey results from 19 countries. Mol. Genet. Metab. 2010;99(2):109–115. doi: 10.1016/j.ymgme.2009.09.005. [DOI] [PubMed] [Google Scholar]
- 14.Hood A., Grange D.K., Christ S.E., Steiner R., White D.A. Variability in phenylalanine control predicts IQ and executive abilities in children with phenylketonuria. Mol. Genet. Metab. 2014 Apr;111(4):445–451. doi: 10.1016/j.ymgme.2014.01.012. [DOI] [PMC free article] [PubMed] [Google Scholar]
- 15.Carol Hartnett R., S.-Z.-T.-I Long-term outcomes of blood phenylalanine concentrations in children with classical phenylketonuria. 2013;104(255–258) doi: 10.1016/j.ymgme.2013.01.007. [DOI] [PubMed] [Google Scholar]
- 16.Jurecki E.R., Cederbaum S., Kopesky J., Perry K., Rohr F., Sanchez-Valle A., Viau K.S., Sheinin M.Y., Cohen-Pfeffer J.L. Adherence to clinic recommendations among patients with phenylketonuria in the United States. Mol. Genet. Metab. 2017;12(3):190–197. doi: 10.1016/j.ymgme.2017.01.001. [DOI] [PubMed] [Google Scholar]