Abstract
Automated texture analysis of lung computed tomography (CT) images is a critical tool in subtyping pulmonary emphysema and diagnosing chronic obstructive pulmonary disease (COPD). Texton-based methods encode lung textures with nearest-texton frequency histograms, and have achieved high performance for supervised classification of emphysema subtypes from annotated lung CT images. In this work, we first explore characterizing lung textures with sparse decomposition from texton dictionaries, using different regularization strategies, and then extend the sparsity-inducing constraint to the construction of the dictionaries. The methods were evaluated on a publicly available lung CT database of annotated emphysema subtypes. We show that enforcing sparse decompositions from texton dictionaries and unsupervised dictionary learning can achieve high classification accuracy (>90%). The flexibility of sparse-inducing models embedded either in the representation stage or dictionary learning stage has potential in providing consistency in classification performance on heterogeneous lung CT datasets with further parameter tuning.
Index Terms: Lung CT, emphysema, texture analysis, supervised learning, sparse representation
I. Introduction
Chronic obstructive pulmonary disease (COPD) is a chronic lung disease characterized by limitation of airflow, and is currently the third leading cause of death in the United States, affecting over 11 million people [1]. Pulmonary emphysema, which is defined morphologically by the enlargement of airspaces with destruction of alveolar walls, overlaps considerably with COPD.
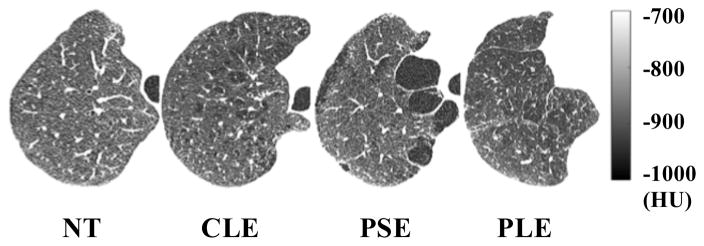
Computed tomography (CT) is a vital tool in the analysis of lung structures. There are three primary subtypes of pulmonary emphysema with distinct visual characteristics on CT images, defined as follows [2]: centrilobular emphysema (CLE), defined as focal regions of low attenuation, surrounded by normal lung attenuation, located within the central portion of secondary pulmonary lobules; paraseptal emphysema (PSE), defined as regions of low attenuation adjacent to visceral pleura (including fissures); and panlobular emphysema (PLE), defined as diffuse regions of low attenuation involving entire secondary pulmonary lobules.
Illustrations of the visual appearance of normal tissue (NT) and the three emphysema subtypes are provided in Figure 1. There are clear texture differences among the emphysema subtypes and normal lung tissue. These emphysema subtypes are associated with distinct risk factors and clinical manifestations [3, 4]. They likely represent different diseases and could help with the diagnosis of COPD.
Figure 1.
Illustration of visual appearances of normal lung tissue and emphysema subtypes, adapted from [2].
Traditional interpretation of emphysema subtypes relies on radiologists’ labeling, which is labor-intensive, has high cost and limited inter-rater agreement [2]. Texture analysis of lung CT images enables automated quantitative assessment of different subtypes of emphysema and could benefit COPD diagnosis and follow up, bringing robustness and reproducibility.
Textons are very powerful tools to encode and label textures in computer vision, and have shown better performance for emphysema subtypes labeling compared with classic texture features [5]. Compared with deep-learning based method [6], they are more adaptable to classification tasks with small training sets. Classic texton-based methods construct textons as dictionaries of image texture patches, characterize textures via labeling of patches within regions of interest (ROIs) with the most similar texton and generate texton frequency histograms. Such labeling can be interpreted as a sparse decomposition of an n-D image and can be extended in this context. Textons are comprised of centroids from a k-means clustering of patch features, which is based on Euclidean distance. The elements belonging to a certain cluster are thus distributed in an n-D sphere, which might not reflect the intrinsic underlying distribution of the data in the feature space [7].
In this work, we first explore characterizing lung textures with sparse decomposition from texton dictionaries using three variants of the sparsity-inducing constraint. We then explore alternative unsupervised texton dictionary learning approaches exploiting sparsity regularization which can provide more flexibility in characterizing data distribution in feature space.
II. Method
A. Labeling Framework Overview
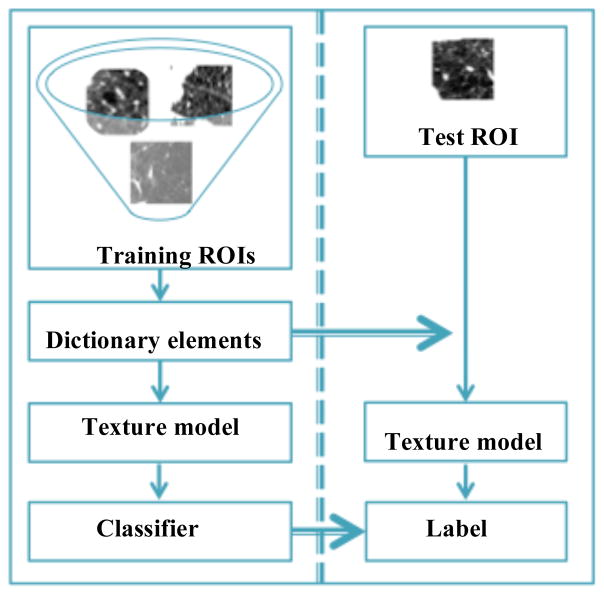
The lung texture labeling framework is divided into training and testing stages. A dictionary encoding the texture information is trained using the training ROIs. Specifically, we adopted two strategies for dictionary construction in this work: texton-based construction and dictionary learning with sparsity regularization. For the texton-based construction method, we extend the original nearest-texton frequency histogram model, which can be viewed as a special case of sparsity-inducing regularization, to other sparsity-inducing constraints, detailed in Section II-B. For the dictionary learning with sparsity regularization, ROIs are modeled using three strategies, detailed in Section II-C. Textures of the training ROIs are modeled in the learning stage, and are used to train the classifier. Textures of the test ROIs are modeled with the same formulation as the training ROIs, and are classified in the testing stage. A graphical overview of the lung texture labeling framework is shown in Figure 2.
Figure 2.
Overview of the lung texture labeling on ROIs.
B. Texton-based Models
To construct a texton dictionary, small-sized local patches are randomly extracted from training images. Patches from the same class are clustered in feature space using k-means. For lung texture on CT images, the features are the patch intensity values directly. The centroids constitute the textons in the dictionary. ROIs are modeled via projection coefficients of patches extracted from each ROI onto the dictionary. The projection coefficients can be generated in multiple ways, as described below.
1) Texton histogram model
In the original texton histogram model, a ROI is modeled via the normalized frequency histogram A of the nearest textons of its patches in the dictionary D with a Euclidean distance metric. Formally, , where n is the number of patches from the ROI, and ai is the projection coefficient vector of patch pi subject to:
| (1) |
The projection coefficient vector can be alternatively obtained by relaxing or changing the sparsity-inducing constraints as follows:
2) l0 norm regularization model
| (2) |
3) l1 norm regularization model
| (3) |
4) Elastic-net regularization model
| (4) |
C. Dictionary Learning-Based Models
Instead of using the texton dictionaries, we can alternatively model the ROIs based on dictionary learning with sparsity regularization, using the following strategies:
1) Multiple-dictionary model
Separate dictionaries for each class are built by [8]:
| (5) |
where Dk denotes the dictionary for the kth class, and m is the number of all training patches in ROIs belonging to the kth class. For a test ROI with n patches, the classification is achieved via k̂ = argmin kL(k), where:
| (6) |
2) Single-dictionary model
Instead of constructing separate dictionaries using class-specific data, a single and general dictionary is built with m training patches from all classes, as:
| (7) |
The sparse representation of each ROI of n patches with respect to dictionary D is calculated as , where:
| (8) |
3) Concatenated-dictionary model
A single and general dictionary is built for all classes. Instead of training on data from all classes as in 2), the single dictionary is constructed by concatenating the dictionaries Dk constructed following Equation (5). The sparse representation is again generated following Equation (8).
In the last two models, the sparse histogram-like representations of the training ROIs, defined as A, are used to train a multi-class classifier. We used a random forest classifier with 100 trees (heuristically determined). We generated one random forest classifier per dictionary of textons.
III. Results
A. Data and Experimental Settings
The dataset used in this work is the publicly available Computed Tomography Emphysema Database [9], which contains 168 manually annotated 2D ROIs of size 61×61 pixels (slice thickness of 1.25 mm; in-plane resolution of 0.78 mm × 0.78 mm) from three different classes of lung tissue: normal lung tissue (NT, 59 ROIs), centrilobular emphysema (CLE, 50 ROIs), paraseptal emphysema (PSE, 59 ROIs). PLE is excluded in this work due to the low number of cases in the dataset.
Experiments based on sparsity regularizations were implemented using the Sparse Modeling Software (SPAMS) [10]. The l0 norm regularization problem was implemented using a greedy approach. The ROIs were randomly divided into training and testing sets, with a ratio of 3:1. All classification accuracy values reported in the sections below are averaged values over 50 permutations.
B. Texton-based Dictionary Construction
For the classification using texton-based dictionaries, the parameters in the texton histogram model include the number K of textons per class and the size of local patches. Parameters in l0 norm regularization are the same as the original model. Two additional parameters are introduced in the l1 norm and elastic net regularization models: λ1 and λ2. Parameter selection was done via a grid-search manner.
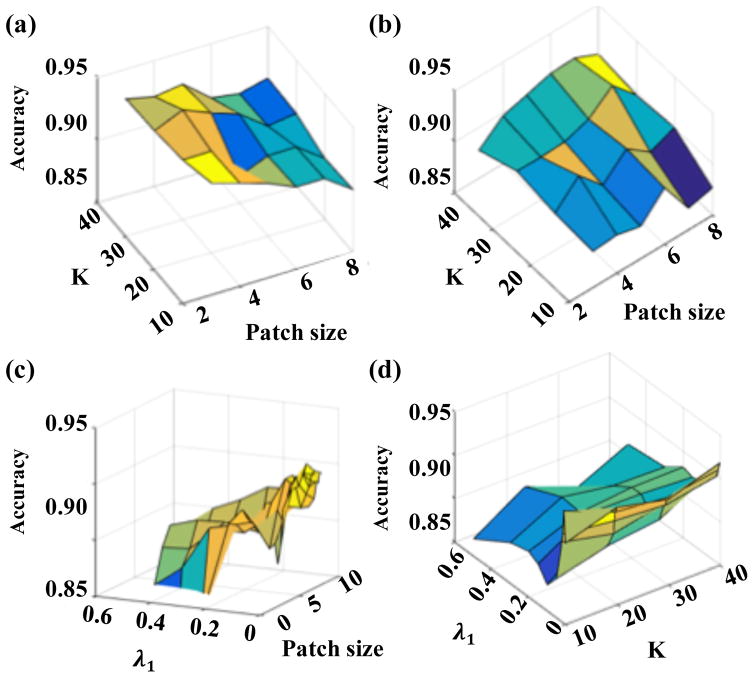
Parameter values were set as follows: K in the range [10, 40], patch size in the range [3×3, 8×8] pixels, λ1 in the range [0.001, 0.5], and λ2 in the range [0.001, 0.1]. Example of a texton dictionary (K=10, patch size = 8×8 pixels) is shown in Figure 3. We illustrate in Figure 4 the evolution of the classification accuracy when varying some parameter values, for the different regularization strategies.
Figure 3.
Example of a texton dictionary. The three rows correspond to the trained centroids from three classes of lung tissue (From top to bottom: NT, CLE, PSE).
Figure 4.
Classification accuracy of the different texton dictionary construction approaches. (a) Accuracy vs. K and patch size for the texton histogram model; (b) accuracy vs. K and patch size for the l0 regularization model; (c) accuracy vs. λ1 and patch size for the l1 regularization model; (d) accuracy vs. λ1 and K for the l1 regularization model. The trend for elastic net model, not shown here, is similar to the l1 regularization model.
With the original texton histogram model, accuracy tends to increase with a larger K and a smaller patch size. The best classification accuracy achieved is 93.9%. With the l0 norm regularization model, accuracy tends to increase with a larger K but with a larger patch size. The best classification accuracy achieved is 92.1%. With the l1 norm regularization model, accuracy tends to increase with a larger K, a larger patch size and a smaller λ1 within the tested ranges. The best classification accuracy achieved is 91.8%. With the elastic net regularization model, the trend is similar to the l1 regularization model, and we found that λ2 =0.01 yields the best accuracy, which is 92.4%. Overall, the classification accuracies obtained with the four sparse texture representation models based on texton dictionaries are very similar.
C. Dictionary Learning-Based Construction
The best classification accuracy achieved is 89.4% using the single-dictionary model, and 91.7% using the concatenated-dictionary model, which compares to the performance obtained with the texton dictionary-based models. Using the multiple-dictionary model, the best accuracy achieved is only 83.3%. Best accuracies obtained with the different models are summarized in Table I. All models except for the multiple-dictionary model achieve classification accuracy around 90%. The multiple-dictionary model uses the dictionary learning encoding cost function rather than the projection coefficients for the classification task. This model was shown to achieve excellent performance in previous studies on classifying images of digital numbers [8], but it is not discriminative enough for this lung texture database. However, models based on classifiers might gain power from the discriminative capabilities of the classifiers. That may be part of the reason behind the current poorer performance of the multiple-dictionary model.
Table I.
Summary of Classification Accuracy
| Texton-based models | Freq. Hist. | l0 | l1 | Elastic net |
|---|---|---|---|---|
| Accuracy (%) | 93.9 | 92.1 | 91.8 | 92.4 |
| Dictionary learning-based models | Single Dict. | Multiple Dict. | Concatenated Dict. | |
| Accuracy (%) | 89.4 | 83.3 | 91.7 | |
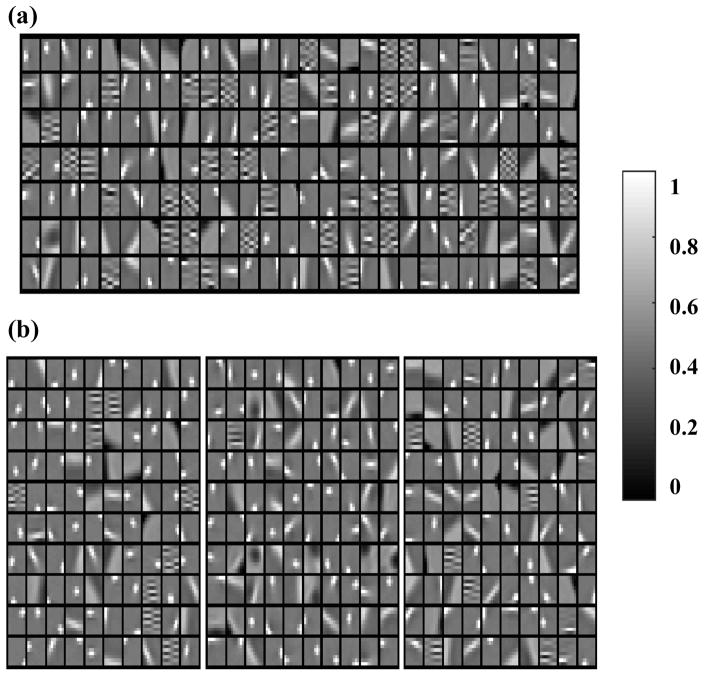
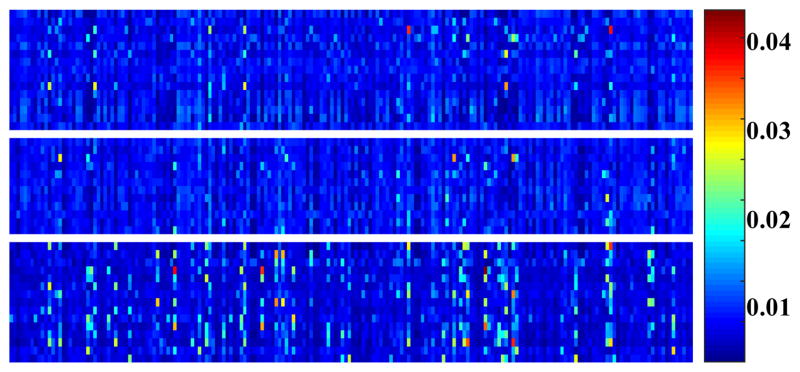
Examples of dictionaries (single dictionary and multiple dictionaries) are shown in Figure 5. Examples of feature vectors for the single-dictionary model are shown (as a matrix of concatenated test ROIs) in Figure 6. It is clear that the NT and CLE classes are not easily distinguishable, whereas feature vectors of the PSE class are clearly different, which is reflected in the final classification results.
Figure 5.
Examples of learned dictionaries. (a) Single dictionary generated with data from all classes; (b) Separate dictionaries generated for separate classes (From left to right: NT, CLE, and PSE).
Figure 6.
Feature vectors of different emphysema subtypes and normal lung tissue based on a single dictionary (From top to bottom: NT, CLE, PSE).
IV. Discussion and Future Work
In this work, we investigated seven texture models for the classification of emphysema subtypes and normal lung tissue, on CT lung images, including four models based on texton dictionaries (texton histogram, l0 norm regularization, l1 norm regularization, and elastic net regularization), and three models based on dictionary learning with sparsity regularizations (multiple-dictionary, single-dictionary and concatenated-dictionary model). All models except for the multiple-dictionary model achieved high classification accuracy (~90%). The multiple-dictionary model, which uses the dictionary learning encoding cost function rather than the projection coefficients for texture labeling, is shown to be less discriminative and suboptimal for the classification task in this lung texture database.
In practice, automated labeling of emphysema subtypes is a challenging task in the presence of heterogeneous visual properties of lung CT images across scanners and subjects. We validate in this work the feasibility of using both the classic texton-based models and sparsity-inducing models for the classification of emphysema subtypes using a dataset acquired with a single scanner type and protocol. Compared with classic texton-based models, the higher flexibility of sparse-inducing models embedded either at the representation stage or dictionary learning stage has potential in providing consistency of texture classification in heterogeneous lung CT dataset with finer parameter tuning, which could be a future work for this study.
Another perspective of the study is to use histogram features or filter-based features in addition to raw CT intensity values used in this work. The filtered data can incorporate additional desired property, such as translation-invariance and rotation-invariance. Other strategies such as data augmentation and convolutional sparse modeling can also be investigated.
Acknowledgments
The authors would like to thank Dr. John Wright from the Department of Electrical Engineering, Columbia University for his helpful advice. This work was partially supported by the NIH/NHLBI R01-HL121270 grant.
References
- 1.From the Global Strategy for the Diagnosis, Management and Prevention of COPD, Global Initiative for Chronic Obstructive Lung Disease (GOLD) 2016. 2015 Available from: http://www.goldcopd.org/
- 2.Smith BM, Austin JH, Newell JD, D’Souza BM, Rozenshtein A, Hoffman EA, et al. Pulmonary emphysema subtypes on computed tomography: the MESA COPD study. The American Journal of Medicine. 2014;127:94. e7–94. e23. doi: 10.1016/j.amjmed.2013.09.020. [DOI] [PMC free article] [PubMed] [Google Scholar]
- 3.Shapiro SD. Evolving concepts in the pathogenesis of chronic obstructive pulmonary disease. Clinics in Chest Medicine. 2000;21:621–632. doi: 10.1016/s0272-5231(05)70172-6. [DOI] [PubMed] [Google Scholar]
- 4.Dahl M, Tybjaerg-Hansen A, Lange P, Vestbo J, Nordestgaard BG. Change in lung function and morbidity from chronic obstructive pulmonary disease in alpha1-antitrypsin MZ heterozygotes: A longitudinal study of the general population. Ann Intern Med. 2002 Feb 19;136:270–9. doi: 10.7326/0003-4819-136-4-200202190-00006. [DOI] [PubMed] [Google Scholar]
- 5.Gangeh MJ, Sorensen L, Shaker SB, Kamel MS, de Bruijne M, Loog M. A texton-based approach for the classification of lung parenchyma in CT images. Med Image Comput Comput Assist Interv. 2010;13:595–602. doi: 10.1007/978-3-642-15711-0_74. [DOI] [PubMed] [Google Scholar]
- 6.Greenspan Hayit, van Ginneken Bram, Summers Ronald M. Guest Editorial Deep Learning in Medical Imaging: Overview and Future Promise of an Exciting New Technique. IEEE Transactions on Medical Imaging. 2016;35(5):1153–1159. [Google Scholar]
- 7.Xie J, Zhang L, You J, Zhang D. Texture classification via patch-based sparse texton learning. Image Processing (ICIP), 2010 17th IEEE International Conference on; 2010; pp. 2737–2740. [Google Scholar]
- 8.Ramirez I, Sprechmann P, Sapiro G. Classification and clustering via dictionary learning with structured incoherence and shared features. Computer Vision and Pattern Recognition (CVPR), 2010 IEEE Conference on; 2010; pp. 3501–3508. [Google Scholar]
- 9.Sørensen L, Shaker SB, De Bruijne M. Quantitative analysis of pulmonary emphysema using local binary patterns. Medical Imaging, IEEE Transactions on. 2010;29:559–569. doi: 10.1109/TMI.2009.2038575. [DOI] [PubMed] [Google Scholar]
- 10.Mairal J, Bach F, Ponce J, Sapiro G, Jenatton R. Spams: Sparse modeling software. WILLOW, INRIA. 2011;2 [Google Scholar]


