

Abstract
Cancer progression depends on cellular metabolic reprogramming as both direct and indirect consequence of oncogenic lesions; however, the underlying mechanisms are still poorly understood. Here, we report that CUEDC2 (CUE domain‐containing protein 2) plays a vital role in facilitating aerobic glycolysis, or Warburg effect, in cancer cells. Mechanistically, we show that CUEDC2 upregulates the two key glycolytic proteins GLUT3 and LDHA via interacting with the glucocorticoid receptor (GR) or 14‐3‐3ζ, respectively. We further demonstrate that enhanced aerobic glycolysis is essential for the role of CUEDC2 to drive cancer progression. Moreover, using tissue microarray analysis, we show a correlation between the aberrant expression of CUEDC2, and GLUT3 and LDHA in clinical HCC samples, further demonstrating a link between CUEDC2 and the Warburg effect during cancer development. Taken together, our findings reveal a previously unappreciated function of CUEDC2 in cancer cell metabolism and tumorigenesis, illustrating how close oncogenic lesions are intertwined with metabolic alterations promoting cancer progression.
Keywords: CUEDC2, GLUT3, LDHA, tumorigenesis, Warburg effect
Subject Categories: Cancer, Metabolism, Signal Transduction
Introduction
An emerging hallmark of cancer cells is the altered metabolism that most, if not all, cancer cells predominantly generate energy by glycolysis in the cytosol rather than by oxidative phosphorylation (OXPHOS) through the TCA cycle in mitochondria 1, 2, 3, 4. It is clear now that oncogenic lesions are largely behind the enhanced aerobic glycolysis, or Warburg effect, in many types of cancer cells. For instance, hypoxia‐inducible factor 1 (HIF‐1) has been known to mediate the increased transcription of genes encoding glucose transporters and glycolytic enzymes, including LDHA (lactate dehydrogenase A) and PDK1 (pyruvate dehydrogenase kinase, isozyme 1) 5, 6, 7. Oncogene cMyc also contributes to the regulation of most glycolytic enzymes including GLUT1 (glucose transporter 1) and LDHA 8, 9, 10. Recently, our group reported that Lin28/let‐7 axis reprogrammed cancer cell metabolism via the important metabolic enzyme PDK1 11. These reports suggest that metabolic reprogramming in cancer cells is far more complicatedly regulated than expected and warrants further investigation.
CUEDC2 is a CUE domain‐containing protein that plays a dual role in mono‐ and polyubiquitin recognition as well as in facilitating intramolecular monoubiquitination 12, 13. CUEDC2 has been reported to be a multifunctional protein involved in the regulation of many key cellular events 14. Intriguingly, accumulated evidence indicates that CUEDC2 expression is elevated in many types of cancer cells, suggesting its emerging importance in tumorigenesis. CUEDC2 was initially reported to repress PR (progesterone receptor) transactivation and impair the effect of progesterone on breast cancer cell growth 15. CUEDC2 also inhibited the activation of transcription factor nuclear factor‐κB (NF‐κB) by interacting with IκB kinase‐α and IκB kinase‐β (IKKα and IKKβ), indicating its potential role in inflammation regulation 16. Human CUEDC2 protein was often found to be doublet by Western blotting as a result of CDK1‐dependent phosphorylation, and this CDK1‐dependent phosphorylation of CUEDC2 was reported to be critical for metaphase–anaphase transition in mitosis progress and deregulation of CUEDC2 contributes to tumor development by causing chromosomal instability 17. Moreover, CUEDC2 modulates ERα (estrogen receptor‐α) protein stability and high CUEDC2 expression impairs the response to tamoxifen treatment of breast cancer cells, suggesting that CUEDC2 is a crucial determinant of cell resistance to endocrine therapy 18. It is also reported recently that miR‐324‐5p‐regulated CUEDC2 expression plays a key role in maintaining appropriate function of macrophages and their deregulation causes colon inflammation and tumorigenesis 19. While these findings substantially expanded our understanding of the roles of CUEDC2 in tumor initiation and development, they also suggest it be necessary to further explore the additional roles of CUEDC2, which is obviously more extensively involved in tumor development.
Recently, we have focused our interest on the metabolic alterations of cancer cells under various stress conditions. Specifically, we have discovered that, under hypoxic condition, HIF‐1 suppresses lipid oxidation for cancer cell survival and proliferation 20. We also identified cMyc as a regulator of serine synthesis pathway to promote cancer cell survival and growth, especially under nutrition stress 21. All these results suggest that oncogenic lesions are more extensively intertwined with metabolic alterations to promote cancer progression. Here, in this study, we investigated the potential role of CUEDC2 in metabolic regulation of cancer cells and found that CUEDC2 enhanced aerobic glycolysis in different types of cancer cells by regulating glucose transporter GLUT3 and a critical glycolytic enzyme LDHA. We further discovered that CUEDC2 increased GLUT3 mRNA level by interacting with the transcription factor GR and stabilized LDHA protein through 14‐3‐3ζ. Importantly, we demonstrated that both GLUT3 and LDHA were required for CUEDC2‐mediated tumor progression. Moreover, our tissue microarray analysis revealed that aberrant expression of CUEDC2 was correlated with levels of GLUT3 and LDHA in clinical HCC samples. Thus, our results identify a novel function of CUEDC2 in tumorigenesis and provide a previously unappreciated mechanism by which cancer cells switch to aerobic glycolysis, or Warburg effect, for cancer progression.
Results
CUEDC2 facilitates Warburg effect in cancer cells
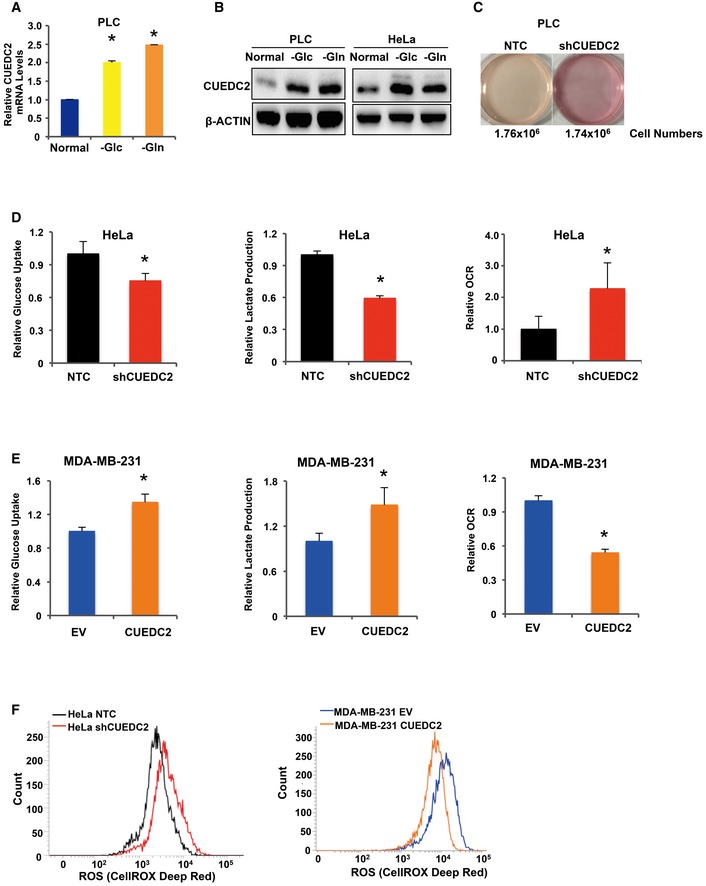
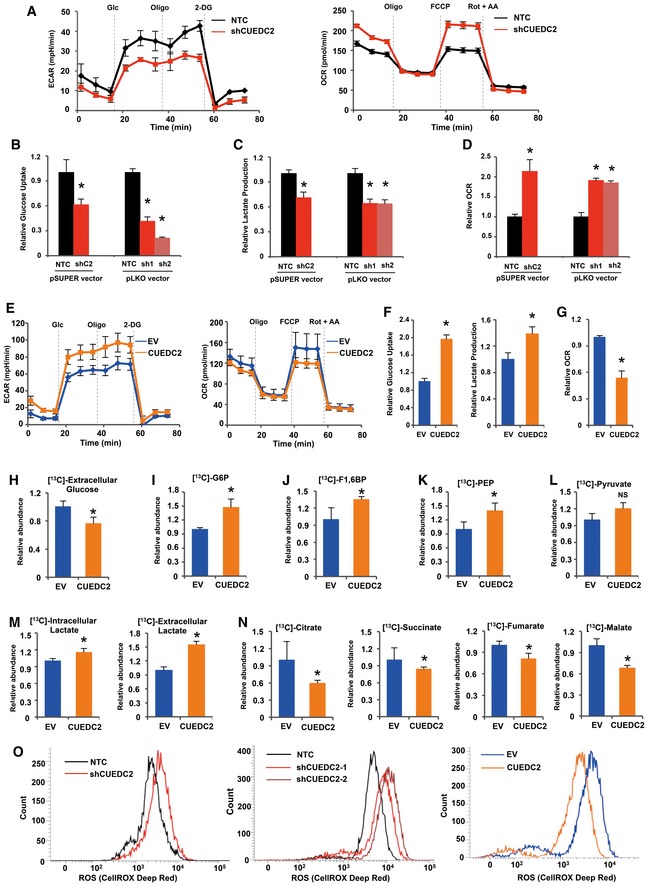
We set out to determine whether CUEDC2, which was previously shown to have a role in tumor initiation and development, also has a role in cancer metabolism. We found that CUEDC2 expression was activated under glucose/glutamine‐deprived conditions (Fig EV1A and B). More intriguingly, we noticed that, during the cell culture, the medium color of cultured cancer cells with CUEDC2 knocking down was much pinker than control cells (Fig EV1C). These observations led us to further investigate the potential involvement of CUEDC2 in facilitating cancer metabolic alterations. To evaluate the effect of CUEDC2 on glucose metabolism in cancer cells, we initially measured extracellular acidification rate (ECAR) and our results revealed reduction in both basal and maximal ECAR in hepatocellular carcinoma PLC cells with CUEDC2 knocking down by shRNA in pSUPER vector which has been widely used in our previous publications (Fig 1A, left panel). To avoid the off target effect, in our experiments, we also incorporated two additional shRNAs targeting CUEDC2 which were cloned in pLKO vector and found that knocking down CUEDC2 in PLC cells by shRNAs, in either pSUPER or pLKO vector, resulted in reduced glucose uptake and lactate production (Fig 1B and C), accompanied by increased oxygen consumption (Fig 1A, right panel and Fig 1D). Consistently, overexpression of CUEDC2 led to increased ECAR, glucose uptake, and lactate production, accompanied by decreased oxygen consumption in PLC cells (Fig 1E–G). Similar results were observed in HeLa and MDA‐MB‐231 cells (Fig EV1D and E). These data suggest that CUEDC2 expression promotes glycolytic metabolism in cancer cells.
Figure EV1. CUEDC2 facilitates aerobic glycolysis in different types of cancer cell lines.
-
A, BmRNA (A) and protein (B) levels of CUEDC2 were determined by qRT–PCR and Western blot, respectively, in glucose‐ or glutamine‐starved PLC cells (A, B) or HeLa cells (B).
-
CThe medium color of cultured PLC cells expressing shCUEDC2 was much pinker than that of control cells expressing NTC. The cell numbers were 1.76 × 10⁶ for NTC cells and 1.74 × 10⁶ for shCUEDC2 cells, respectively.
-
D, ECellular glucose uptake, lactate production, and O2 consumption rate were measured in HeLa cells expressing shCUEDC2 (D) or MDA‐MB‐231 cells stably overexpressing HA‐CUEDC2 (E).
-
FCellular ROS levels were detected by flow cytometry using CellROX DeepRed staining in HeLa cells expressing shCUEDC2 and MDA‐MB‐231 cells overexpressing CUEDC2.
Figure 1. CUEDC2 facilitates Warburg effect in cancer cells.
-
AExtracellular acidification rate (ECAR) and O2 consumption rate (OCR) of PLC cells stably expressing shCUEDC2 or NTC were detected using a Seahorse Bioscience XFp analyzer.
-
BCellular glucose uptake was measured in PLC cells stably expressing shCUEDC2 or NTC in pSUPER or pLKO vectors using the glucose assay kit. The data were normalized to protein concentrations.
-
CExtracellular lactate production was measured in PLC cells stably expressing shCUEDC2s or NTC in pSUPER or pLKO vectors using lactate assay kit. The data were normalized to protein concentrations.
-
DEqual numbers of PLC cells stably expressing shCUEDC2s or NTC in pSUPER or pLKO vectors were subjected to an Oxytherm unit to measure the O2 consumption rate.
-
EECAR and OCR of PLC cells with stable overexpression of CUEDC2 were detected using a Seahorse Bioscience XFp analyzer.
-
FCellular glucose uptake and extracellular lactate production were measured in PLC cells with stable overexpression of CUEDC2 or empty vector (EV) using the glucose or lactate assay kit. The data were normalized to protein concentration.
-
GEqual numbers of PLC cells with stable overexpression of CUEDC2 or EV were subjected to an Oxytherm unit to measure their O2 consumption rate.
-
H–NPLC cells with stable overexpression of CUEDC2 or EV were cultured in medium containing 13C‐labeled glucose for 36 hours. Extracellular 13C‐labeled glucose (H), 13C‐G6P (I), 13C‐F1,6BP (J), 13C‐PEP (K), 13C‐pyruvate (L), intracellular and extracellular 13C‐lactate (M), and cellular 13C‐labeling TCA cycle metabolites (N) were measured by GC‐MS.
-
OCellular reactive oxygen species (ROS) were detected by flow cytometry using CellROX DeepRed staining in PLC cells expressing shCUEDC2s (in pSUPER vector, left panel; in pLKO vector, middle panel) or overexpressing CUEDC2 (right panel).
To further confirm the possible role of CUEDC2 in regulating glucose metabolism in cancer cells, we traced the metabolic flux of 13C‐labeled glucose in CUEDC2 overexpressing PLC cells by gas chromatography‐mass spectrometry (GC‐MS). As a result, the level of 13C‐labeled glucose in the culture medium of CUEDC2 overexpressing PLC cells was significantly reduced (Fig 1H), suggesting enhanced glucose uptake of these cells from medium. Consistently, 13C‐labeled glucose‐6‐phosphate (G6P), 1,6‐bisphosphate (F1,6BP), and phosphoenolpyruvate (PEP) were elevated in CUEDC2 overexpressing PLC cells (Fig 1I–K). The level of 13C‐labeled pyruvate had no significant difference in CUEDC2 overexpressing cells and EV (empty vector) cells (Fig 1L), which might be caused by the fast flow of pyruvate to lactate in CUEDC2 overexpressing cells. Overexpression of CUEDC2 also led to increased levels of both 13C‐labeled intracellular and extracellular lactate (Fig 1M), confirming that CUEDC2 facilitates glycolysis in cancer cells. On the other hand, the levels of the TCA cycle metabolites derived from 13C‐labeled glucose, including citrate, succinate, fumarate, and malate were generally decreased by forced expression of CUEDC2 (Fig 1N), indicating suppressed oxidative phosphorylation of glucose by CUEDC2. Mitochondria oxidative phosphorylation is the major source for ROS generation in cells. Consistently, we observed decreased cellular ROS levels in CUEDC2 overexpressing cells but increased levels in CUEDC2 knocking down cells (Figs 1O and EV1F). Taken together, these data demonstrate that CUEDC2 drives glucose metabolism to glycolytic metabolism rather than oxidative phosphorylation in cancer cells.
GLUT3 and LDHA are essential for CUEDC2‐mediated Warburg effect and cancer cell survival
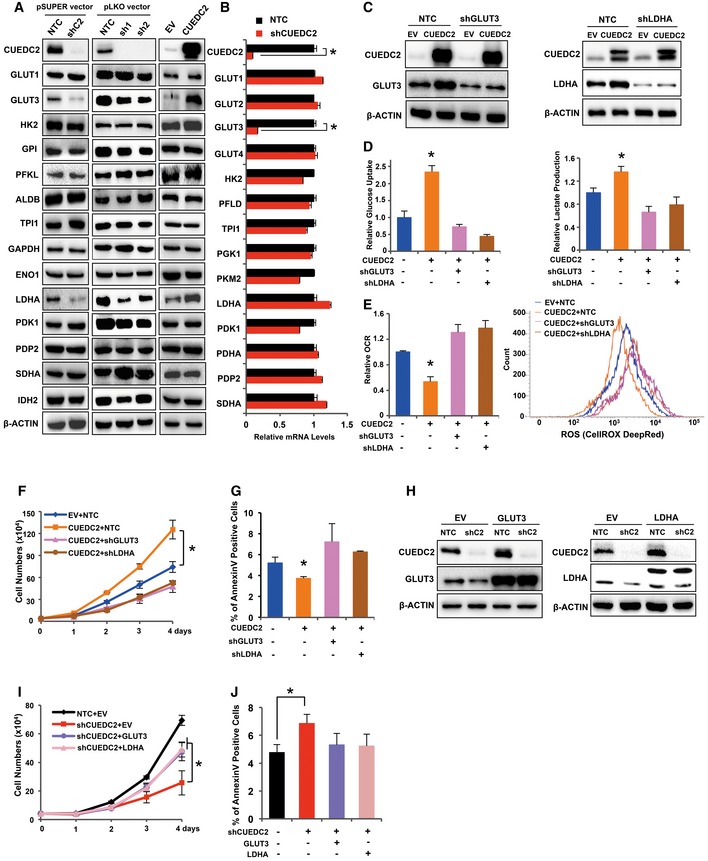
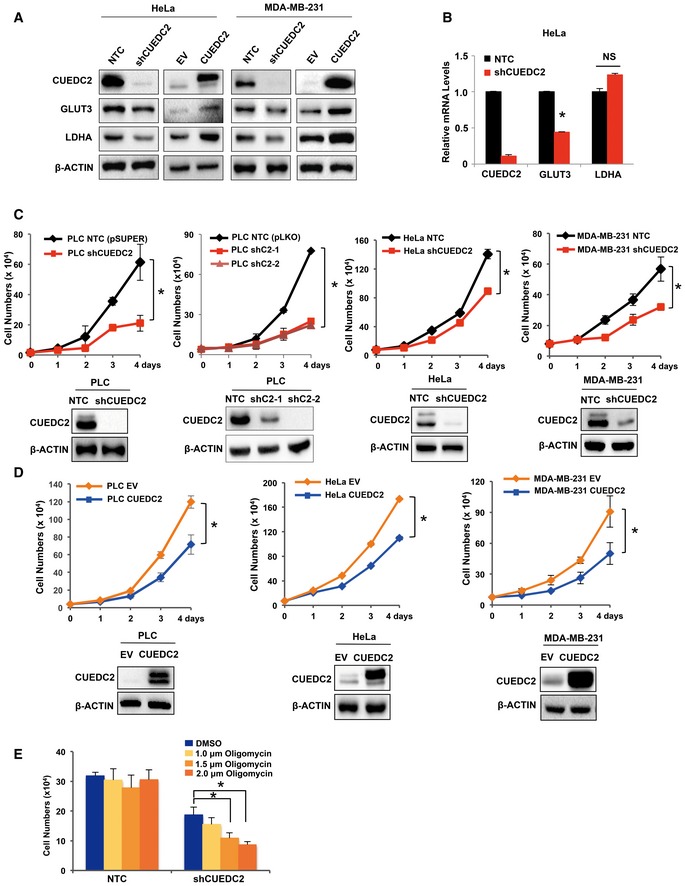
To investigate how CUEDC2 regulates glucose metabolism in cancer cells, a panel of metabolic proteins and enzymes involved in glycolysis pathway and TCA cycle were studied by Western blot and qRT–PCR in PLC cells with altered CUEDC2 expression. Consistent with metabolic profiling data shown in Fig 1, Western blot revealed that overexpression of CUEDC2 remarkably enhanced, while shCUEDC2s significantly decreased, the protein levels of GLUT3 and LDHA in PLC cells (Fig 2A). qRT–PCR analysis showed that shCUEDC2 significantly suppressed GLUT3 mRNA expression, but not that of LDHA (Fig 2B). Similar results were observed in HeLa and MDA‐MB‐231 cells (Fig EV2A and B), suggesting that GLUT3 and LDHA might be involved in CUEDC2‐regulated glycolysis or Warburg effect.
Figure 2. GLUT3 and LDHA are essential for CUEDC2‐mediated Warburg effect and cancer cell survival.
-
A, BProtein (A) and mRNA (B) expression of the genes in the glucose metabolic pathway were determined by Western blot and qRT–PCR, respectively, in PLC cells expressing shCUEDC2s (in pSUPER or pLKO vectors) or overexpressing CUEDC2.
-
CKnockdown efficiency of shGLUT3 or shLDHA was determined in CUEDC2‐overexpressing PLC cells by Western blot.
-
D, ECellular glucose uptake and lactate production (D), O2 consumption rate and ROS levels (E) were measured in PLC cells overexpressing CUEDC2 with further knockdown of GLUT3 or LDHA by shRNAs.
-
F, GGrowth curve (F) and cell apoptosis (G) were examined in PLC cells with stable CUEDC2 overexpression and GLUT3 or LDHA knockdown.
-
HKnockdown efficiency of shCUEDC2 and overexpression of HA‐GLUT3 or FLAG‐LDHA in PLC cells were detected by Western blot.
-
I, JGrowth curve (I) and cell apoptosis (J) were determined in PLC cells stably expressing shCUEDC2 with further overexpression of HA‐GLUT3 or FLAG‐LDHA.
Figure EV2. CUEDC2 facilitates cancer cell growth, at least partially by enhancing Warburg effect.
-
A, BProtein (A) and mRNA (B) levels of GLUT3 and LDHA were determined by Western blot and qRT–PCR, respectively, in HeLa cells and MDA‐MB‐231 cells.
-
C, DCell growth was determined by trypan blue counting in shCUEDC2s expressing (C) or HA‐CUEDC2 overexpressing (D) PLC, HeLa, and MDA‐MB‐231 cells.
-
EThe same numbers of PLC cells stably expressing NTC or shCUEDC2 were cultured for 60 h followed by treatment with or without indicated concentrations of oligomycin for 8 h. Cell numbers were determined by trypan blue counting.
To test whether CUEDC2 promotes Warburg effect via regulating GLUT3 and/or LDHA, we introduced lentivirus expressing shGLUT3 or shLDHA into PLC cells with forced expression of CUEDC2 (Fig 2C). As a result, knockdown of GLUT3 or LDHA abolished the enhanced glucose uptake and lactate production by CUEDC2 overexpression in PLC cells (Fig 2D). Moreover, shGLUT3 or shLDHA eliminated the effects of CUEDC2 overexpression on the cellular oxygen consumption and ROS levels in PLC cells (Fig 2E), suggesting that GLUT3 and LDHA were involved in CUEDC2‐mediated glucose metabolism.
Consistent with previous reports 17, 18, 22, we observed that CUEDC2 silencing impaired while CUEDC2 overexpression enhanced the growth of various cancer cells including PLC, HeLa, and MDA‐MB‐231 cells (Fig EV2C and D). Interestingly, when cells were treated with oligomycin, an inhibitor of respiration/OXPHOS, the growth of CUEDC2 knocking down PLC cells was significantly inhibited while the control NTC cells were hardly affected by oligomycin (Fig EV2E), indicating that cancer cells with high level of CUEDC2 favor aerobic glycolysis for growth. Further analysis revealed that knocking down GLUT3 or LDHA abrogated the growth advantage induced by CUEDC2 overexpression in PLC cells (Fig 2F). Consistent with the changes in cellular ROS levels, overexpression of CUEDC2 reduced the apoptotic cell population, which was abolished by shGLUT3 or shLDHA in PLC cells (Fig 2G). On the other hand, forced expression of GLUT3 or LDHA could partially recover the retarded cell growth induced by shCUEDC2 (Fig 2H and I). Moreover, forced expression of GLUT3 or LDHA decreased the apoptotic cell population induced by shCUEDC2 in PLC cells (Fig 2J). Collectively, these findings indicated that GLUT3 and LDHA were involved in CUEDC2‐regulated aerobic glycolysis and cell survival in cancer cells.
CUEDC2 regulates GLUT3 expression and aerobic glycolysis through GR
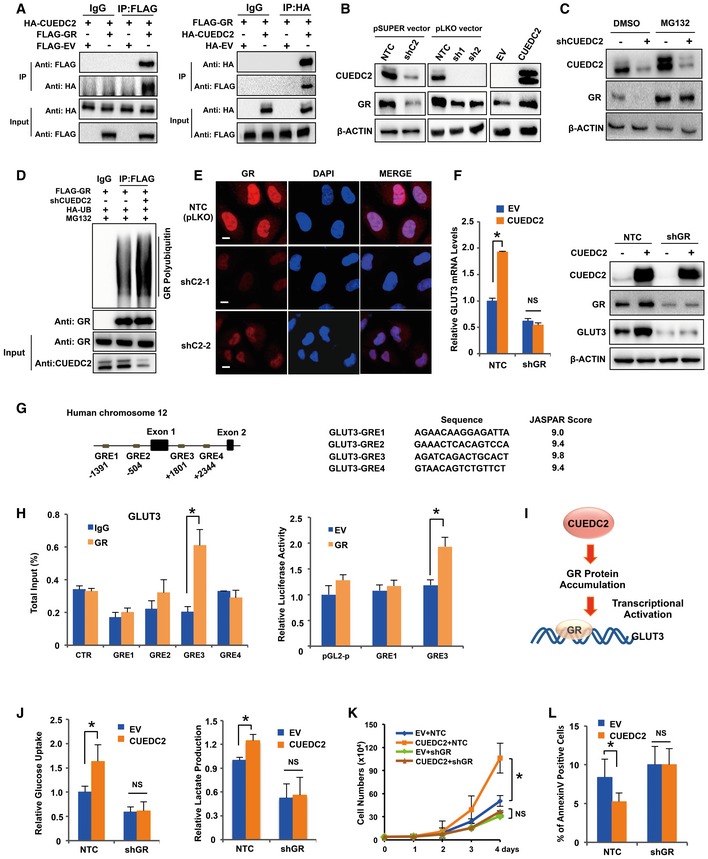
Since no evidence has ever proved that CUEDC2 could directly regulate gene expression on mRNA levels, we set out to search for CUEDC2‐interacted proteins with mass spectrum analysis to identify the potential effectors underlying the regulation of GLUT3 by CUEDC2. While we did not observe direct interaction between CUEDC2 and GLUT3 from the mass spectrum analysis (Appendix Table S1), glucocorticoid receptor (GR), a transcription factor whose activation regulates genes that control the development, metabolism, and immune response at transcriptional levels 23, 24, 25, attracted our attention. Further co‐immunoprecipitation experiments in PLC and HEK293T cells confirmed that GR did interact with CUEDC2 (Figs 3A and EV3A). Forced overexpression of CUEDC2 increased while shCUEDC2 remarkably reduced GR protein expression in PLC cells (Fig 3B) as well as in HeLa and MDA‐MB‐231 cells (Fig EV3B). However, qRT–PCR analysis showed no effect of CUEDC2 on GR mRNA expression (Fig EV3C), indicating that CUEDC2 regulates GR at post‐translational levels. When cells were treated with proteasome inhibitor MG132, shCUEDC2 showed no effect on the expression of GR protein in PLC cells (Fig 3C), suggesting that CUEDC2 regulated GR protein stability. Consistently, knockdown of CUEDC2 led to increased polyubiquitination of GR in the presence of MG132 (Fig 3D), further demonstrating that CUEDC2 stabilizes GR protein by inhibiting its proteasome degradation. Since signaling of GR requires its nuclear translocation, we then analyzed the subcellular localization of GR in CUEDC2 knocking down PLC cells using immunofluorescence microscopy. Consistent with our Western blot results, CUEDC2 knockdown led to significant reduction in the nucleic GR protein level in PLC cells (Fig 3E).
Figure 3. CUEDC2 regulates GLUT3 expression and aerobic glycolysis through GR .
-
ALysates from PLC cells overexpressing HA‐CUEDC2 and FLAG‐GR were used for immunoprecipitation with control IgG, anti‐FLAG (left panel) or anti‐HA (right panel), followed by blotting with anti‐HA or anti‐FLAG.
-
BProtein levels of CUEDC2 and GR were detected by Western blot in PLC cells stably expressing shCUEDC2s in pSUPER or pLKO vectors or overexpressing CUEDC2.
-
CGR protein levels were detected by Western blot in PLC cells expressing shCUEDC2 in the presence or absence of proteasome inhibitor MG132 (5 μmol).
-
DHA‐Ub, FLAG‐GR, and shCUEDC2 cotransfected HEK293T cells were treated with proteasome inhibitor MG132 (5 μmol) for 6 h before lysis. Equal amount of proteins were used for immunoprecipitation with anti‐FLAG antibody, followed by blotting with anti‐HA or anti‐GR.
-
ECellular localization of GR in CUEDC2 knockdown cells and NTC cells was analyzed by immunofluorescence staining with GR antibody. The nucleus was stained by DAPI. Scale bars, 10 μm.
-
FmRNA and protein levels of GLUT3 were determined by qRT–PCR and Western blot, respectively, in PLC cells stably expressing HA‐CUEDC2 with further knockdown of GR by shRNAs.
-
GA diagram shows the sites and sequences of potential glucocorticoid responsive elements (GREs) in GLUT3 gene.
-
HChIP (left panel) and luciferase assays (right panel) were performed to identify GREs in GLUT3 gene.
-
IA diagram shows CUEDC2 enhances GLUT3 mRNA transcription by accumulating its transcriptional factor GR protein.
-
J–LCellular glucose uptake and lactate production (J), cell growth curve (K), and apoptosis (L) were determined in PLC cells stably overexpressing CUEDC2 with further knockdown of GR by shRNAs.
Figure EV3. CUEDC2 regulates GLUT3 via GR .
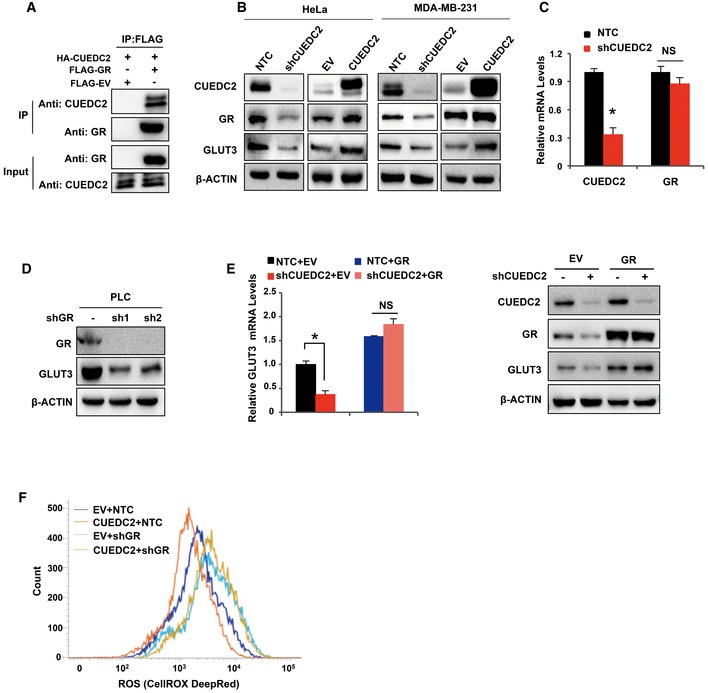
- Immunoprecipitation (IP) assay was performed with anti‐FLAG antibody in 293T cells cotransfected with HA‐CUEDC2, FLAG‐GR, or FLAG‐EV, followed by blotting with anti‐CUEDC2 or anti‐GR.
- Protein levels of GR and GLUT3 were determined by Western blot in HeLa cells and MDA‐MB‐231 cells expressing shCUEDC2 or overexpressing HA‐CUEDC2.
- mRNA levels of CUEDC2 and GR were detected by qRT–PCR in PLC cells stably expressing shCUEDC2.
- The protein level of GLUT3 in PLC cells stably expressing shGRs was analyzed by Western blot.
- mRNA and protein levels of GLUT3 were determined by qRT–PCR and Western blot in PLC cells stably expressing shCUEDC2 with further overexpression of EV or HA‐GR.
- Cellular ROS levels were detected by flow cytometry using CellROX DeepRed staining in PLC cells stably expressing CUEDC2 with further knockdown of GR by shRNAs.
Since GR is a transcription factor, we next sought to examine whether GR was involved in CUEDC2‐mediated transcriptional regulation of GLUT3 and aerobic glycolysis in cancer cells. Knocking down GR by shRNAs reduced GLUT3 levels (Fig EV3D) and, significantly, shGRs attenuated CUEDC2‐induced increase in GLUT3 at both mRNA and protein levels in PLC cells (Fig 3F), while forced expression of GR rescued both mRNA and protein levels of GLUT3 in CUEDC2‐knocking down cells (Fig EV3E), demonstrating that GR was involved in CUEDC2‐regulated GLUT3 expression. To investigate whether GLUT3 was a direct target of the transcriptional factor GR, we first performed bioinformatic analysis for GR binding sites (glucocorticoid responsive elements, GREs) in GLUT3 gene using JASPAR date base, which showed that GLUT3 gene possesses several potential GR binding sites (GREs) (Fig 3G). Next, chromatin immunoprecipitation (ChIP) assay verified that GR directly binds to the GRE3 that is close to the transcriptional starting site of GLUT3 in PLC cells (Fig 3H, left panel). Consistently, dual‐luciferase reporter assay revealed that overexpression of GR significantly enhanced the luciferase activity of the reporter containing GRE3 element (Fig 3H, right panel), confirming that GRE3 was the direct binding site of GR on GLUT3 gene. Taken together, these data demonstrate that CUEDC2 promotes GLUT3 expression by stabilizing GR, which binds to GLUT3 and activates its transcription in cancer cells (Fig 3I).
Further metabolic analysis revealed that knockdown of GR abolished CUEDC2‐induced changes in glucose uptake, lactate production in PLC cells, and cellular ROS levels (Figs 3J and EV3F). Moreover, cell growth analysis demonstrated that knockdown of GR substantially diminished CUEDC2‐induced cell growth advantage in PLC cells (Fig 3K). In agreement with the ROS data, expression of GR‐specific shRNAs abrogated the effect of CUEDC2 on cell apoptosis (Fig 3L). Collectively, these data demonstrate that GR is involved in CUEDC2‐mediated regulation of GLUT3 expression, glucose metabolism, as well as cell survival in cancer cells.
CUEDC2 enhances LDHA protein expression by protecting it from proteasomal degradation via 14‐3‐3ζ
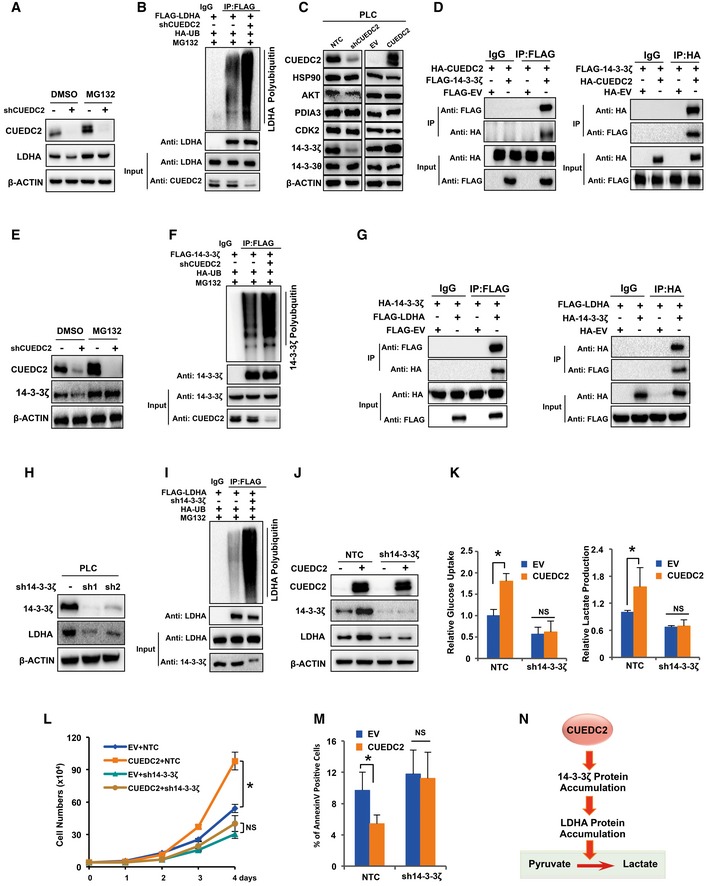
Next, we sought to determine how CUEDC2 upregulated LDHA protein without affecting its mRNA expression (Fig 2A and B). Our Western blot analysis showed that, in the presence of MG132, shCUEDC2 failed to decrease LDHA protein in PLC cells (Fig 4A). Further, ubiquitination analysis revealed that, in the presence of MG132, knockdown of CUEDC2 by shRNAs led to enhanced polyubiquitination of LDHA in HEK293T cells (Fig 4B), suggesting that CUEDC2 stabilizes LDHA protein by protecting it from proteasome degradation. However, our Co‐IP assays showed no interaction between CUEDC2 and LDHA (Fig EV4A).
Figure 4. CUEDC2 enhances LDHA protein expression by protecting it from proteasomal degradation via 14‐3‐3ζ.
-
ALDHA protein levels were detected by Western blot in PLC cells expressing shCUEDC2 in the presence or absence of proteasome inhibitor MG132 (5 μmol).
-
BHA‐Ub, FLAG‐LDHA, and shCUEDC2 cotransfected HEK293T cells were treated with MG132 (5 μmol) before lysis. Equal amount of proteins were used for immunoprecipitation with anti‐FLAG antibody, followed by blotting with anti‐HA or anti‐LDHA.
-
CThe expression of proteins which are predicted to bind to LDHA by bioinformatic analysis was examined by Western blot in PLC cells stably expressing shCUEDC2 or overexpressing CUEDC2.
-
DLysates from PLC cells overexpressing HA‐CUEDC2 and FLAG‐14‐3‐3ζ were used for immunoprecipitation with control IgG, anti‐FLAG (left panel), or anti‐HA (right panel), followed by blotting with anti‐HA or anti‐FLAG.
-
E14‐3‐3ζ protein levels were detected by Western blot in PLC cells expressing shCUEDC2 in the presence or absence of MG132 (5 μmol).
-
FHA‐Ub, FLAG‐14‐3‐3ζ, and shCUEDC2 cotransfected HEK293T cells were treated with MG132 (5 μmol) for 6 h before lysis. Equal amount of proteins were used for immunoprecipitation with anti‐FLAG antibody, followed by blotting with anti‐HA or anti‐14‐3‐3ζ.
-
GLysates from PLC cells overexpressing FLAG‐LDHA and HA‐14‐3‐3ζ were used for immunoprecipitation with control IgG, anti‐FLAG (left panel), or anti‐HA (right panel), followed by blotting with anti‐HA or anti‐FLAG.
-
HLDHA protein levels were analyzed by Western blot in PLC cells with silenced expression of 14‐3‐3ζ by shRNAs.
-
IHA‐Ub, FLAG‐LDHA, and sh14‐3‐3ζ cotransfected HEK293T cells were treated with MG132 (5 μmol) before lysis. Equal amount of proteins were used for immunoprecipitation with anti‐FLAG antibody, followed by blotting with anti‐HA or anti‐LDHA.
-
JLDHA protein levels were detected by Western blot in PLC cells with forced expression of CUEDC2 and sh14‐3‐3ζ.
-
K–MCellular glucose uptake and lactate production (K), cell growth curve (L), and apoptosis (M) were determined in PLC cells stably overexpressing CUEDC2 with further knockdown of 14‐3‐3ζ by shRNAs.
-
NA diagram shows CUEDC2 accumulated 14‐3‐3ζ protein which further interacts with and stabilizes LDHA protein.
Figure EV4. CUEDC2 regulates LDHA via 14‐3‐3ζ.
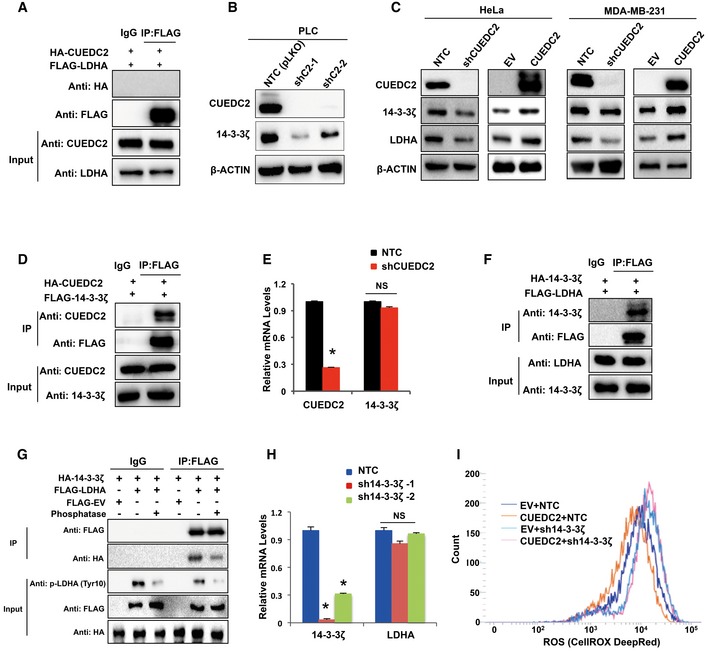
- Immunoprecipitation (IP) assay was performed with anti‐FLAG antibody in HEK293T cells cotransfected with HA‐CUEDC2 and FLAG‐LDHA, followed by blotting with anti‐HA and anti‐FLAG.
- Protein levels of 14‐3‐3ζ were determined by Western blot in PLC cells expressing shCUEDC2s.
- Protein levels of 14‐3‐3ζ and LDHA were determined by Western blot in HeLa cells and MDA‐MB‐231 cells expressing shCUEDC2 or overexpressing HA‐CUEDC2.
- Immunoprecipitation (IP) assay was performed using anti‐FLAG antibody in HEK293T cells cotransfected with HA‐CUEDC2 and FLAG‐14‐3‐3ζ, followed by blotting with anti‐CUEDC2 and anti‐FLAG.
- mRNA levels of CUEDC2 and 14‐3‐3ζ were detected by qRT–PCR in PLC cells stably expressing shCUEDC2.
- Immunoprecipitation (IP) assay was performed using anti‐FLAG antibody in HEK293T cells cotransfected with HA‐14‐3‐3ζ and FLAG‐LDHA, followed by blotting with anti‐14‐3‐3ζ and anti‐FLAG.
- Cell lysates from PLC cells cotransfected with HA‐14‐3‐3ζ and FLAG‐LDHA were treated with or without PP2A, followed by immunoprecipitation with anti‐FLAG or IgG. The immunoprecipitates were blotted with anti‐HA or anti‐FLAG.
- mRNA levels of 14‐3‐3ζ and LDHA were detected by qRT–PCR in PLC cells stably expressing sh14‐3‐3ζ.
- Cellular ROS levels were detected by flow cytometry using CellROX DeepRed staining in PLC cells stably expressing CUEDC2 with further knockdown of 14‐3‐3ζ by shRNAs.
To find out the candidates that could directly regulate LDHA degradation downstream of CUEDC2, we searched for the proteins that might interact with LDHA by a bioinformatics screening. As a result, several candidates were picked up, including HSP90, AKT, PDIA3, CDK2, and two members of 14‐3‐3 family. Then, the targets were narrowed down by testing experimentally whether the candidate proteins were regulated by CUEDC2, and as a result, a multifunctional protein 14‐3‐3ζ was focused. Western blot analysis revealed that 14‐3‐3ζ protein was suppressed by shCUEDC2 and elevated by CUEDC2 overexpression in PLC, HeLa and MDA‐MB‐231 cells (Figs 4C and EV4B and C). Co‐IP assays also verified the interaction between CUEDC2 and 14‐3‐3ζ (Figs 4D and EV4D). As qRT–PCR data showed no effect of CUEDC2 on 14‐3‐3ζ mRNA expression (Fig EV4E), we next used proteasome inhibitor MG132 to test whether protein degradation mechanism was involved. As a result, shCUEDC2 could not decrease 14‐3‐3ζ protein when PLC cells were treated with MG132 (Fig 4E), indicating that CUEDC2 regulated 14‐3‐3ζ protein stability via proteasome pathway. Ubiquitination analysis further revealed that, in the presence of MG132, knocking down CUEDC2 by shRNAs remarkably enhanced polyubiquitinated 14‐3‐3ζ (Fig 4F), confirming that CUEDC2 enhanced 14‐3‐3ζ protein accumulation by protecting it from proteasome degradation. Moreover, we found that 14‐3‐3ζ interacted directly with LDHA (Figs 4G and EV4F). As 14‐3‐3 proteins have been reported to bind to both motifs contain a phosphorylated serine or threonine residue and non‐phosphorylated ligands, we tested whether the binding between 14‐3‐3ζ and LDHA depends on the phosphorylation status of LDHA. The Co‐IP assay showed that the binding of LDHA to 14‐3‐3ζ was attenuated after protein phosphatase treatment (Fig EV4G), suggesting that the association between 14‐3‐3ζ and LDHA potentially depends on the phosphorylation of LDHA, at least partially. Further study found that the protein level of LDHA was notably decreased and its ubiquitination was significantly increased when 14‐3‐3ζ was knocked down by shRNAs (Fig 4H and I), suggesting that the binding of 14‐3‐3ζ to LDHA protects LDHA from proteasome degradation. Of note, we also investigated the mRNA levels of LDHA in PLC cells stably knocking down 14‐3‐3ζ and found that 14‐3‐3ζ had no significant effect on LDHA transcriptional level (Fig EV4H). More intriguingly, knockdown of 14‐3‐3ζ by shRNAs attenuated the effect of CUEDC2 overexpression on LDHA protein levels (Fig 4J), suggesting that 14‐3‐3ζ was the missing link in regulation of LDHA by CUEDC2.
Next, we knocked down 14‐3‐3ζ in CUEDC2 overexpressing PLC cells and analyzed the glucose uptake, lactate production, cell growth, and apoptosis. As a result, knocking down 14‐3‐3ζ abolished the enhanced glucose uptake and lactate production by CUEDC2 overexpression in PLC cells (Fig 4K). Knocking down 14‐3‐3ζ also blunted the inhibitory effect of CUEDC2 on cellular ROS levels in PLC cells (Fig EV4I). Moreover, similar to GR knockdown, 14‐3‐3ζ shRNAs diminished the growth advantage induced by CUEDC2 overexpression and increased apoptotic cell population (Fig 4L and M), demonstrating that 14‐3‐3ζ was involved in CUEDC2‐regulated glycolysis and cancer cell survival. Thus, we uncovered here a pathway by which CUEDC2 induced the activation of LDHA and aerobic glycolysis in human cancer cells via protecting the stability of 14‐3‐3ζ protein (Fig 4N).
GLUT3 and LDHA are critical for CUEDC2‐regulated tumor progression
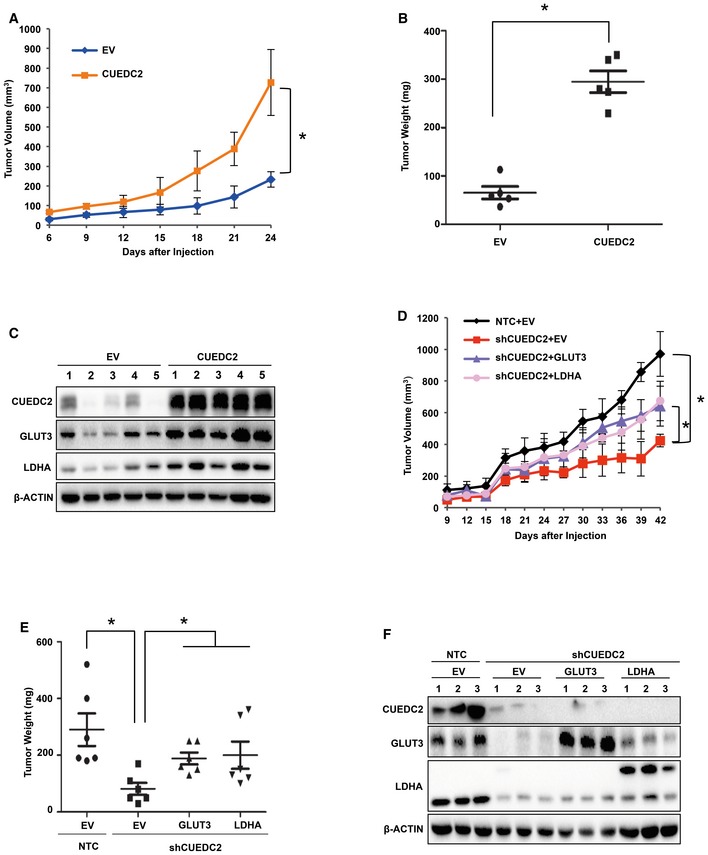
To further assess the function of CUEDC2 in tumor growth in vivo, we manipulated CUEDC2 expression in PLC cells and subcutaneously injected these cells into nude mice. PLC cells with forced overexpression of CUEDC2 developed significantly larger tumors (Fig 5A and B). Western blot analysis using the lysates of the tumor tissues revealed that, consistent with our in vitro data, CUEDC2 significantly enhanced the expression of GLUT3 and LDHA in xenograft tumors (Fig 5C).
Figure 5. GLUT3 and LDHA are critical for CUEDC2‐regulated tumor progression.
-
A–CEqual numbers of PLC cells stably expressing EV or CUEDC2 were injected subcutaneously into nude mice (n = 5 for each group). Tumor growth was monitored starting from 6 days after inoculation (A). Tumors were extracted and compared at the end of experiment (B). Protein levels of CUEDC2, GLUT3, and LDHA were determined by Western blot using the lysates from tumor tissues (C).
-
D–FGLUT3 or LDHA was overexpressed in PLC cells stably expressing shCUEDC2. Equal numbers of cells were injected subcutaneously into nude mice (n = 6 for each group). Tumor growth was monitored starting from 9 days after inoculation (D). Tumors were extracted and compared at the end of experiment (E). Protein levels of CUEDC2, GLUT3, and LDHA were determined by Western blot using the tumor tissue lysates (F).
To clarify whether GLUT3 or LDHA is involved in CUEDC2‐regulated tumor formation, we stably overexpressed GLUT3 or LDHA in CUEDC2 knocking down PLC cells for xenograft experiments. The results showed that knocking down CUEDC2 in PLC cells dramatically retarded tumor growth, which was recovered in part by forced overexpression of GLUT3 or LDHA (Fig 5D and E), suggesting that both GLUT3 and LDHA are involved in CUEDC2‐mediated tumor growth in vivo. Western blot analysis using the lysates of the tumor tissues confirmed the knockdown efficiency of shCUEDC2 and the overexpression of GLUT3 or LDHA in xenograft tumors (Fig 5F). Taken together, these data prove that both GLUT3 and LDHA are critical for CUEDC2‐regulated tumor growth in vivo.
Aberrant expression of GLUT3 and LDHA correlates with that of CUEDC2 in human hepatocellular carcinoma
As xenograft results demonstrated that GLUT3 and LDHA are critical for oncogenic role of CUEDC2 (Fig 5), we next sought to determine the physiological relevance of CUEDC2‐regulated GLUT3 and LDHA pathway in human malignancies. To this aim, we employed tissue microarray and immunohistochemical analysis (IHC) to examine the expression of CUEDC2, GLUT3, and LDHA in samples of human hepatocellular carcinoma (HCC). Our data showed that the expressions of CUEDC2, GLUT3, and LDHA were elevated in HCC samples, while they had only negative or focal marginal expression in normal hepatic tissues (Fig 6A). Moreover, statistical analysis using a cohort of 213 clinic pathologically characterized HCC samples revealed that the aberrant CUEDC2 expression was positively correlated with that of GLUT3 (64%, 42/66) and LDHA (68%, 45/66) (Fig 6B). Expression levels of CUEDC2, GR/GLUT3, and 14‐3‐3ζ/LDHA were further analyzed in 14 pairs of HCC lesions and adjacent non‐cancerous tissues. The results showed that CUEDC2, GR/GLUT3, and 14‐3‐3ζ/LDHA were highly expressed in HCC lesions compared to the adjacent non‐cancerous tissues; more importantly, their expression patterns showed high correlation (Fig 6C). These data indicate a potential role for CUEDC2 in regulating the expression of GR/GLUT3 and 14‐3‐3ζ/LDHA in human hepatocellular carcinoma and reveal yet another oncogenic function of CUEDC2 via promoting Warburg effect during the development of human cancers.
Figure 6. Aberrant expression of GLUT3 and LDHA correlates with that of CUEDC2 in human hepatocellular carcinoma.
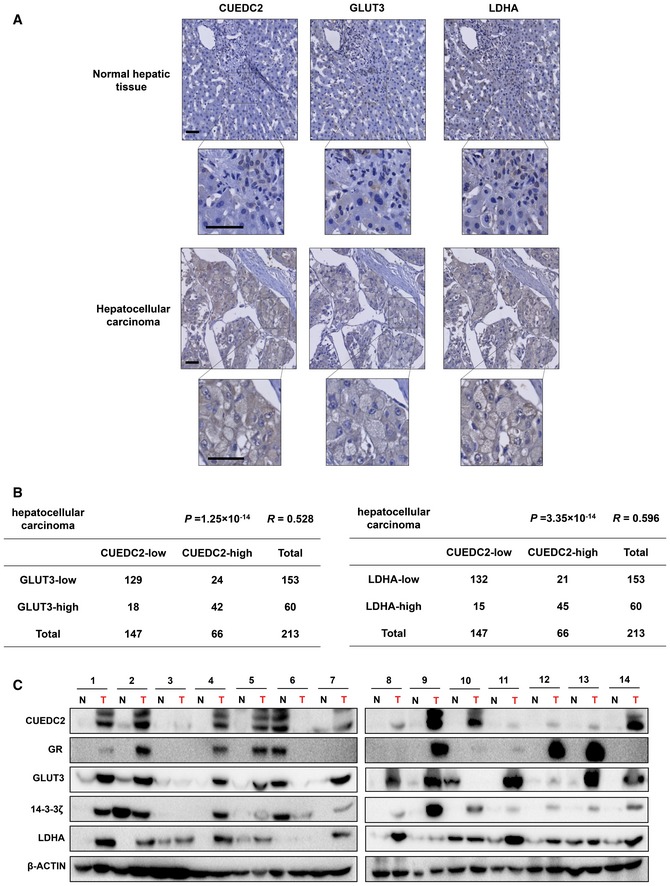
- Normal liver tissues and hepatocellular carcinoma specimens were subjected to immunohistochemical (IHC) staining of CUEDC2, GLUT3, and LDHA. The representative images of IHC staining from the same pair of tissues are shown. Brown staining indicates positive immunoreactivity. Sections were counterstained with hematoxylin. The region in each box was enlarged. Scale bars, 50 μm.
- Correlation between CUEDC2 and GLUT3 or CUEDC2 and LDHA expression levels in human hepatocellular carcinoma tissues was analyzed. n = 213. Statistical significance was determined by the chi‐square test; R: correlation coefficient.
- Protein levels of CUEDC2, GR, GLUT3, 14‐3‐3ζ, and LDHA in the paired human HCC tissues (T) and tumor‐adjacent non‐cancerous liver tissues (N) from 14 patients were analyzed by Western blot. β‐Actin served as loading control.
Source data are available online for this figure.
Discussion
Increased aerobic glycolysis, or Warburg effect, is regarded as an emerging hallmark for cancers 1. While there is no doubt that insights into this characteristic alteration in cancer cells will hold promise for potential cancer therapy, the underlying molecular mechanisms remain largely unclear. In this regard, the present study revealed an unexpected function of CUEDC2 in promoting aerobic glycolysis in cancer cells, aside from the previously reported roles of CUEDC2 in cell cycle, inflammation, macrophage function, and resistance to endocrine cancer therapies 14, 19. The initial observation that CUEDC2 expression was activated under nutrition stress conditions and that metabolomic analysis using GC‐MS demonstrated CUEDC2 increased glycolytic flux led us to explore the role of this oncogenic protein in facilitating Warburg effect. As expected, we verified the correlation between CUEDC2 expression level and glucose uptake, lactate production, or oxygen consumption rate in different types of cancer cells. Furthermore, knocking down CUEDC2 in cancer cells impaired the aerobic glycolytic phenotype, while cells with forced expression of CUEDC2 favored Warburg effect, indicating that CUEDC2 does generally facilitate glycolysis in cancer cells. Considering the aberrant expression of CUEDC2 in various cancer cells 17, 18, 22 (Fig 6A and C) and the emerging importance of aerobic glycolysis for cancer development, our findings are potentially significant for designing new strategies for cancer therapy.
Importantly, we further establish GLUT3 and LDHA as the effecters in CUEDC2‐mediated glycolytic regulation in cancer cells. To maintain the survival and rapid proliferation, cancer cells normally elevate expression of glycolysis‐related proteins and enzymes. Recently, several oncogenic proteins and tumor suppressors were found to regulate multiple enzymes that facilitate glycolytic metabolism. For instance, Kawauchi et al 26 reported that activation of transcription factor NF‐κB by loss of p53 resulted in upregulation of GLUT3 and an increase in the rate of aerobic glycolysis. GLUT3 was also identified as a YAP‐regulated gene involved in glucose metabolism in breast cancer cells 27. As alterations of numerous oncogenic proteins or tumor suppressors contribute to cancer initiation and development, it stands to reason that cancer metabolism is regulated by complicated network constituted by different means under various contexts instead of a straightforward single pathway operation. Indeed, while we demonstrated that CUEDC2 regulated GLUT3, we did not observe direct interplay between these two proteins. Glucocorticoid receptor (GR) in enterocytes was recently reported to be essential for GC (glucocorticoid)‐induced glucose transport, which consequently contributed to induction of hyperglycemia in vivo 28. A study using placenta of a diabetic rat indicated that there might be a relationship between GR and GLUT1 expressions at the cellular level 29. Thus, it is very intriguingly for us to show for the first time that GR played a pivotal role in CUEDC2‐mediated GLUT3 transcription in cancer cells. Moreover, we provided direct evidence that GR regulated the transcription of GLUT3 by binding to its proximal promoter region. Furthermore, GR was essential for CUEDC2 facilitated aerobic glycolysis and tumor cell proliferation (Fig 3). Mechanically, the interaction between CUEDC2 and GR was found to be necessary to protect GR from proteasome degradation (Fig 3C and D). CUEDC2, known as an E3 ligase, has been demonstrated to promote PR and ER protein degradation via the proteasome pathway 15, 18; meanwhile, CUEDC2 was also observed to bind to and stabilize SOCS330. These reports suggested that CUEDC2 might function both to promote protein degradation and to protect protein stability, pending on different cases. In this study, our data demonstrated that CUEDC2 bound to GR to prevent its degradation, leading to subsequent GLUT3 activation.
Notably, although LDHA was reported to be activated at transcriptional level by the well‐known oncogenic proteins HIF‐1 and cMyc 6, 8, 9, 31, 32, little is known regarding how LDHA is regulated on protein level. Since our data showed that CUEDC2 protected LDHA from proteasome degradation without direct interaction with LDHA, we crossly compared the lists of candidate proteins binding to LDHA and the CUEDC2‐interacted ones, leading to the discovery of 14‐3‐3ζ as an effecter of CUEDC2 in regulation of LDHA protein stability. 14‐3‐3 family proteins, constituted of seven conserved members in eukaryotic cells, are well known for promoting cell survival by binding to a multitude of functionally diverse signaling proteins, including kinases, phosphatases, and transmembrane receptors 33, 34, 35, 36. Our further results proved that 14‐3‐3ζ was the direct mediator of LDHA activation and metabolic reprogramming triggered by CUEDC2 in cancer cells. Of note, while a recent study reported that 14‐3‐3ζ regulated LDHA transcription in breast cancer cells 37, we could not confirm significant effect of 14‐3‐3ζ on LDHA mRNA levels. Instead, we provided ample evidence to demonstrate that 14‐3‐3ζ associated with LDHA to protect it from proteasome degradation, as the protein level of LDHA was notably decreased and its ubiquitination was significantly increased when 14‐3‐3ζ was knocked down by shRNAs (Fig 4H and I). Thus, while numerous previous reports documented the pathways regulating LDHA at transcriptional level, we identified a new post‐translational mechanism regulating LDHA protein that is controlled by CUEDC2/14‐3‐3ζ axis (Fig 4N).
It is very intriguing that our tissue microarray results revealed high correlation between the aberrant expression of CUEDC2 with that of GLUT3 and LDHA in human HCC samples (Fig 6A and B), suggesting a significant relevance of CUEDC2‐mediated aerobic glycolysis in the development of human malignancies. Indeed, by revealing an unexpected role of CUEDC2 as critical regulator of aerobic glycolysis required for cancer cell survival and growth, our results add insights to understanding the mechanisms of aerobic glycolysis and provide additional link between cell metabolism and cancer progression. The novel findings from the present study, together with the significant discoveries from previous studies, placed CUEDC2 at the crossroad of cellular metabolism and tumorigenesis (Fig 7). Further studies along this line will likely lead to potential new strategy for cancer therapy.
Figure 7. Working model: CUEDC2 regulates GLUT3 and LDHA to facilitate Warburg effect and tumorigenesis.
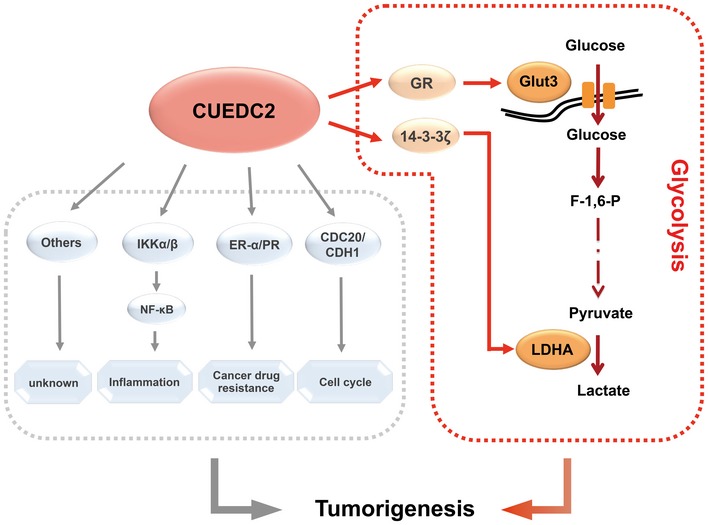
CUEDC2 facilitates Warburg effect by upregulating two key glycolytic molecules GLUT3 and LDHA via interacting with glucocorticoid receptor (GR) or 14‐3‐3ζ proteins, respectively. This observation, together with previous findings that CUEDC2 regulates cell cycle, inflammation and cancer drug resistance, places CUEDC2 at the crossroad of metabolism alteration and cancer progression.
Materials and Methods
Cell lines and cell culture
PLC, HeLa, MDA‐MB‐231, HEK293T, and HEK293 (ATCC) cell lines used in this study were maintained in Dulbecco's modified Eagle's medium (Gibco) supplemented with 10% fetal bovine serum (FBS) and 1% penicillin–streptomycin. All cells were cultured in a humidified incubator at 37°C and 5% CO2.
Plasmid construction and establishment of stably transfected cell lines
The coding sequence of CUEDC2, GLUT3, LDHA, GR, or 14‐3‐3ζ was cloned into the lentiviral plasmid pSin‐EF2α‐Puro (Addgene, #16580). shCUEDC2 in pSUPER‐Puro vector was used in our previous publication and the target sequence is 5′‐CCAAGATGAGGCAACTGGC‐3′. Other shRNAs used in this study were in pLKO vector (Sigma‐Aldrich). Sequences of shRNAs used in this study were listed below. shCUEDC2s in pLKO vector: 5′‐CAAGAAGCTGATCCGATAC‐3′; 5′‐GAAGTCCTTCATCCTGCAG‐3′; shGRs: 5′‐CCTGGATGTTTCTTATGGC‐3′; 5′‐CGGTGGCAATGTGAAATTG‐3′; sh14‐3‐3ζs: 5′‐GCAGAGAGCAAAGTCTTCT‐3′; 5′‐GCTCGAGAATACAGAGAGA‐3′; shLDHA: 5′‐GATCTGTGATTAAAGCAGT‐3′; shGLUT3: 5′‐CTTGGTCTTTGTAGCCTTC‐3′. Stable cells were established as previously reported 11. Briefly, plasmid in pSin‐EF2α‐Puro (Addgene), pLKO, or pSUPER viral vector was cotransfected with virus packaging plasmids into HEK293T cells using Lipofectamine 2000 (Invitrogen). Viral supernatant was collected and added into culture medium of PLC, HeLa, or MDA‐MB‐231 cells in the presence of 8 μg/ml polybrene (Sigma‐Aldrich). The infected cells were selected by puromycin or G418 to establish stable cells.
Metabolism measurements
Experiments for real‐time measuring ECAR and OCR were performed using a Seahorse Bioscience XFp extracellular flux analyzer (Seahorse Bioscience). Intracellular glucose and extracellular lactate were measured using the glucose or lactate assay kit (BioVision), respectively, following the manufacturer's instructions. All values were normalized to protein concentration. For basal oxygen consumption rate measurement, 500 million trypsinized cells were suspended in culture medium in a 0.5 ml volume and measured by an Oxytherm unit (Strathkelvin Instrument Ltd.).
Gas chromatography‐mass spectrometry (GC‐MS) analysis of metabolites
PLC cells overexpressing empty vector (EV) or CUEDC2 were incubated in the culture medium without glucose and FBS for 7 h, followed by supplement with 10% FBS and 25 mM of 13C‐labeled glucose (Cambridge isotope laboratory) and continued culture for 36 h. Metabolites were extracted from cells as previously described 38. Briefly, cells were rinsed by cold PBS and lysed in cold 50% acetonitrile, with three rapid cycles of freeze–thawing between liquid nitrogen and 37°C water bath. Then, the lysates were centrifuged and the supernatant was dried in termovap nitrogen sample concentrator and resuspended in 80% CH3OH/H2O with ribitol (0.2 mg/ml), followed by sonication and centrifugation. The supernatant was dried again and then derivatized for GC‐MS analysis. Data were collected on an Agilent 6890N GC × GC‐TOF‐MS, a two‐dimensional gas chromatography time‐of‐flight mass spectrometry coupled with a Pegasus HT time‐of‐flight mass spectrometer (Leco Corporation, St Joseph, MI, USA).
Intracellular ROS measurement
Trypsinized cells were stained with 2 μM of CellROX DeepRed (Life Technologies) in PBS containing 5% FBS at 37°C for 30 min. Intracellular ROS production was analyzed by FACSVerse flow cytometer (BD Bioscience). Gain and amplifier settings were held constant during the experiment.
Real‐time PCR analysis
Total RNA was prepared using TRIzol agent (Invitrogen), and one microgram of total RNA was used to synthesize cDNA using SuperScript III Reverse Transcriptase (Invitrogen). qRT–PCR was performed using iQ SYBR Green Supermix by the iCycler Real‐time System (Bio‐Rad). Annealing temperature of each primer pair was optimized by temperature gradient PCR. The relative expression of individual transcript was normalized to 18S. Primer sequences are listed in Appendix Table S2.
Western blot analysis
Equal amount of proteins were separated with SDS–PAGE, transferred onto nitrocellulose membranes (GE healthcare), and blocked with 5% milk. Primary antibodies against the following proteins were used CUEDC2 (from our group), GLUT1 (21829‐1‐AP), GLUT3 (20403‐1‐AP), HK2 (22029‐1‐AP), GPI‐1 (15171‐1‐AP), PFKL (15652‐1‐AP), ALDB (18065‐1‐AP), TPI‐1 (10713‐1‐AP), GAPDH (10494‐1‐AP), ENO1 (11204‐1‐AP), LDHA (21799‐1‐AP), PDK1 (10026‐1‐AP), SDHA (14865‐1‐AP), IDH2 (15932‐1‐AP), GR (24050‐1‐AP), and 14‐3‐3ζ (14881‐1‐AP) (from Proteintech). HRP‐conjugated anti‐rabbit (170‐6515, Bio‐Rad) or anti‐mouse (170‐6516, Bio‐Rad) secondary antibodies were used, and membranes were developed using the Western ECL Substrate (Bio‐Rad).
Immunoprecipitation assay
Cells were lysed in lysis buffer (20 mM Tris–HCl pH 8.0, 150 mM NaCl, 2 mM EDTA, 1% NP‐40, 1 mM DTT, 1× protease inhibitor cocktails). After sitting on ice for 1–2 h, the lysates were centrifuged at 4°C. For phosphatase treatment, the cell lysate was then incubated with or without PP2A (Calbiochem, D00168287) overnight at 4°C. Proteins in supernatant were quantified, and equal amount of proteins in supernatant were incubated with anti‐FLAG M2 or anti‐HA for 4 h, followed by incubation with protein A/G‐Sepharose beads for 1 h at 4°C. After incubation, beads were washed three times with lysis buffer, followed by further washing with ice‐cold PBS and boiling in 2× loading buffer. Protein samples were resolved by SDS–PAGE.
Ubiquitination assay
HEK293T cells were cotransfected with pSin‐HA‐ubiquitin and pSin‐FLAG‐LDHA, pSin‐FLAG‐GR or pSin‐FLAG‐14‐3‐3ζ in the presence or absence of shCUEDC2 or sh14‐3‐3ζ as indicated. After incubating for 42 h, proteasome inhibitor MG132 was added in culture medium for additional 6 h, followed by PBS wash and protein lysis. Equal amount of protein lysates were immunoprecipitated with anti‐FLAG M2 antibody (Sigma‐Aldrich) and subjected to SDS–PAGE, followed by blotting with anti‐HA antibody (Proteintech).
Immunofluorescence microscopy
For immunofluorescent (IF) staining, cells were fixed with 4% paraformaldehyde, blocked with PBS containing 5% BSA, and incubated with anti‐GR (1:100, 24050‐1‐AP, Proteintech). Anti‐rabbit secondary antibody conjugated with Texas Red was used. The nuclear was stained by DAPI (Sigma). The fluorescent images were captured using Zeiss 710 laser scanning confocal microscopy (Zeiss).
ChIP assay
PLC cells were cross‐linked with 1% formaldehyde for 10 min at room temperature followed by addition of 125 mM glycine to inactivate formaldehyde. Cell were collected and sonicated. Chromatin extracts containing DNA fragments with an average size of 200–500 bp were immunoprecipitated with IgG or anti‐FLAG (Sigma‐Aldrich) overnight at 4°C, followed by sequential washing with low‐salt buffer, high‐salt buffer, LiCl buffer, and TE buffer. Samples were eluted with TE buffer in the presence of protease K, and the reverse cross‐linking was performed by incubating the samples overnight at 65°C, after which DNA was purified using PCR Purification Kit, followed by quantitative PCR analysis. Primer sequences used in ChIP assay are listed in Appendix Table S2.
Transfection and luciferase assay
Renilla reporter pRL‐TK and pGL2‐promoter empty vector or pGL2‐promoter‐GREs were cotransfected with or without pSin‐FLAG‐GR vector into HEK293 cells. Forty‐eight hours after transfection, cells were lysed and luciferase activity was assessed using the dual‐luciferase reporter assay system (Promega). All experiments were repeated at least three times. Primer sequences used for subcloning GRE sequences into luciferase reporter plasmids are listed in Appendix Table S2.
Animal experiments
All animal studies were conducted with approval from the Animal Research Ethics Committee of the University of Science and Technology of China. Male BALb/c nude mice were purchased from SJA Laboratory Animal Company of China, which were randomly assigned to experimental groups. For xenograft experiments, equal numbers of the established PLC stable cells were injected subcutaneously into nude mice. 6 or 9 days after injection, tumor volumes were measured every 3 days with a caliper and calculated using the equation: volume = length × width2 × 0.52.
Tissue microarray and immunohistochemical analysis
After screening hematoxylin and eosin‐stained slides for optimal tumor content, tissue microarray slides were constructed (Shanghai Biochip Company, Ltd.). Two cores were taken from each formalin‐fixed and paraffin‐embedded (FFPE) HCC samples by using punch cores that measured 0.8 mm in greatest dimension from the center of tumor foci. Samples were deparaffinized and rehydrated. After retrieving antigens by applying Unmask Solution (Vector Laboratories) in a steamer for 30 min, the sections were treated with 1% hydrogen peroxide in methanol for 30 min to block endogenous peroxidase activity. After 1 h pre‐incubation in 10% goat serum to prevent non‐specific staining, the samples were incubated with an antibody to CUEDC2 (from our group, 1:200 dilution), GLUT3 (20403‐1‐AP, Proteintech, 1:150 dilution), or LDHA (21799‐1‐AP, Proteintech, 1:50 dilution) at 4°C overnight. The sections were incubated with SignalStain Boost Detection Reagent for 30 min at room temperature. Color was developed with the SignalStain DAB Chromogen diluted solution (all reagents were obtained from Beijing ZSGB‐Bio Company, Ltd.). Nuclei were lightly counterstained with hematoxylin. Quality assessment was performed on each batch of slides by including negative control (the primary antibody was replaced by PBS) to preclude non‐specific signal. Samples known to express high levels of CUEDC2 protein were used as positive control. The widely accepted German semi‐quantitative scoring system in considering the staining intensity and area extent was used. Each specimen was assigned a score according to the intensity of cytoplasmic staining (no staining = 0; weak staining = 1, moderate staining = 2, strong staining = 3) and the extent of stained cells (0% = 0, 1–24% = 1, 25–49% = 2, 50–74% = 3, 75–100% = 4). The final immunoreactive score was determined by multiplying the intensity score with the extent of score of stained cells, ranging from 0 (the minimum score) to 12 (the maximum score). We defined 0 score as negative, 1–6 score as weak positive expression, and ≥8 score as strong positive expression, respectively. Correlations between CUEDC2 and GLUT3, CUEDC2, and LDHA protein levels in human hepatocellular carcinoma were analyzed. Statistical significance was determined by the chi‐square test; R: correlation coefficient. Human hepatocellular carcinoma tissues and paired adjacent tissues for Western blot analysis were obtained from Yat‐sen University Cancer Center (Guangzhou, China).
Statistical analysis
The data are presented as mean ± SD. Student's t‐test was used to calculate P‐values. Statistical significance is displayed as *P < 0.05.
Author contributions
PG and AL conceived and supervised this study. XZho, ST, PG, AL, HZ, and XP designed the experiments. XZho, ST, XZha, XD, FD, JY, ZL, LSu, Lin Wang, XHe, GW, XHu, Lihua Wang performed and analyzed the experiments. LSo collected clinical HCC samples. PG, HZ, XZho, and ZL wrote the paper. All the authors read and approved the manuscript.
Conflict of interest
The authors declare that they have no conflict of interest.
Supporting information
Appendix
Expanded View Figures PDF
Source Data for Expanded View
Review Process File
Source Data for Figure 2
Source Data for Figure 3
Source Data for Figure 4
Source Data for Figure 5
Source Data for Figure 6
Acknowledgements
This work is supported in part by the National Basic Key Research Program of China (2014CB910600), the National Natural Science Foundation of China (81530076, 81525022, 31371429, 31571472 and 81372148), Chinese Academy of Sciences (XDA01010404), the Fundamental Research Funds for the Central Universities, the Development Foundation of Hefei Center for Physical Science and Technology, and CAS Key Laboratory of Innate Immunity and Chronic Disease.
EMBO Reports (2017) 18: 809–825
Contributor Information
Ailing Li, Email: liailing@hotmail.com.
Ping Gao, Email: pgao2@ustc.edu.cn.
References
- 1. Hanahan D, Weinberg RA (2011) Hallmarks of cancer: the next generation. Cell 144: 646–674 [DOI] [PubMed] [Google Scholar]
- 2. Compan V, Pierredon S, Vanderperre B, Krznar P, Marchiq I, Zamboni N, Pouyssegur J, Martinou JC (2015) Monitoring mitochondrial pyruvate carrier activity in real time using a bret‐based biosensor: investigation of the Warburg effect. Mol Cell 59: 491–501 [DOI] [PubMed] [Google Scholar]
- 3. Lin L, Huang H, Liao W, Ma H, Liu J, Wang L, Huang N, Liao Y, Liao W (2015) MACC1 supports human gastric cancer growth under metabolic stress by enhancing the Warburg effect. Oncogene 34: 2700–2710 [DOI] [PubMed] [Google Scholar]
- 4. Iansante V, Choy PM, Fung SW, Liu Y, Chai JG, Dyson J, Del Rio A, D'Santos C, Williams R, Chokshi S et al (2015) PARP14 promotes the Warburg effect in hepatocellular carcinoma by inhibiting JNK1‐dependent PKM2 phosphorylation and activation. Nat Commun 6: 7882 [DOI] [PMC free article] [PubMed] [Google Scholar]
- 5. Makanji Y, Tagler D, Pahnke J, Shea LD, Woodruff TK (2014) Hypoxia‐mediated carbohydrate metabolism and transport promote early‐stage murine follicle growth and survival. Am J Physiol Endocrinol Metab 306: E893–E903 [DOI] [PMC free article] [PubMed] [Google Scholar]
- 6. Semenza GL, Roth PH, Fang HM, Wang GL (1994) Transcriptional regulation of genes encoding glycolytic enzymes by hypoxia‐inducible factor 1. J Biol Chem 269: 23757–23763 [PubMed] [Google Scholar]
- 7. Kim J‐W, Tchernyshyov I, Semenza GL, Dang CV (2006) HIF‐1‐mediated expression of pyruvate dehydrogenase kinase: a metabolic switch required for cellular adaptation to hypoxia. Cell Metab 3: 177–185 [DOI] [PubMed] [Google Scholar]
- 8. Osthus RC, Shim H, Kim S, Li Q, Reddy R, Mukherjee M, Xu Y, Wonsey D, Lee LA, Dang CV (2000) Deregulation of glucose transporter 1 and glycolytic gene expression by c‐Myc. J Biol Chem 275: 21797–21800 [DOI] [PubMed] [Google Scholar]
- 9. Shim H, Dolde C, Lewis BC, Wu CS, Dang G, Jungmann RA, Dalla‐Favera R, Dang CV (1997) c‐Myc transactivation of LDH‐A: implications for tumor metabolism and growth. Proc Natl Acad Sci 94: 6658–6663 [DOI] [PMC free article] [PubMed] [Google Scholar]
- 10. Pavlova NN, Thompson CB (2016) The emerging hallmarks of cancer metabolism. Cell Metab 23: 27–47 [DOI] [PMC free article] [PubMed] [Google Scholar]
- 11. Ma X, Li C, Sun L, Huang D, Li T, He X, Wu G, Yang Z, Zhong X, Song L et al (2014) Lin28/let‐7 axis regulates aerobic glycolysis and cancer progression via PDK1. Nat Commun 5: 5212 [DOI] [PubMed] [Google Scholar]
- 12. Donaldson KM, Yin H, Gekakis N, Supek F, Joazeiro CAP (2003) Ubiquitin signals protein trafficking via interaction with a novel ubiquitin binding domain in the membrane fusion regulator, Vps9p. Curr Biol 13: 258–262 [DOI] [PubMed] [Google Scholar]
- 13. Shih SC, Prag G, Francis SA, Sutanto MA, Hurley JH, Hicke L (2003) A ubiquitin‐binding motif required for intramolecular monoubiquitylation, the CUE domain. EMBO J 22: 1273–1281 [DOI] [PMC free article] [PubMed] [Google Scholar]
- 14. Man J, Zhang X (2011) CUEDC2: an emerging key player in inflammation and tumorigenesis. Protein Cell 2: 699–703 [DOI] [PMC free article] [PubMed] [Google Scholar]
- 15. Zhang P, Zhao J, Li H, Man J, He K, Zhou T, Pan X, Li A, Gong W, Jin B et al (2007) CUE domain containing 2 regulates degradation of progesterone receptor by ubiquitin–proteasome. EMBO J 26: 1831–1842 [DOI] [PMC free article] [PubMed] [Google Scholar]
- 16. Li H, Liu H, Wang C, Zhang J, Man J, Gao Y, Zhang P, Li W, Zhao J, Pan X et al (2008) Deactivation of the kinase IKK by CUEDC2 through recruitment of the phosphatase PP1. Nat Immunol 9: 533–541 [DOI] [PubMed] [Google Scholar]
- 17. Gao Y, Li T, Chang Y, Wang Y, Zhang W, Li W, He K, Mu R, Zhen C, Man J et al (2011) Cdk1‐phosphorylated CUEDC2 promotes spindle checkpoint inactivation and chromosomal instability. Nat Cell Biol 13: 924–933 [DOI] [PubMed] [Google Scholar]
- 18. Pan X, Zhou T, Tai Y, Wang C, Zhao J, Cao Y, Chen Y, Zhang P, Yu M, Zhen C et al (2011) Elevated expression of CUEDC2 protein confers endocrine resistance in breast cancer. Nat Med 17: 708–714 [DOI] [PubMed] [Google Scholar]
- 19. Chen Y, Wang S, Mu R, Luo X, Liu Z, Liang B, Zhuo H, Hao X, Wang Q, Fang D et al (2014) Dysregulation of the miR‐324‐5p‐CUEDC2 axis leads to macrophage dysfunction and is associated with colon cancer. Cell Rep 7: 1982–1993 [DOI] [PubMed] [Google Scholar]
- 20. Huang D, Li T, Li X, Zhang L, Sun L, He X, Zhong X, Jia D, Song L, Semenza GL et al (2014) HIF‐1‐mediated suppression of Acyl‐CoA dehydrogenases and fatty acid oxidation is critical for cancer progression. Cell Rep 8: 1930–1942 [DOI] [PubMed] [Google Scholar]
- 21. Sun L, Song L, Wan Q, Wu G, Li X, Wang Y, Wang J, Liu Z, Zhong X, He X et al (2015) cMyc‐mediated activation of serine biosynthesis pathway is critical for cancer progression under nutrient deprivation conditions. Cell Res 25: 429–444 [DOI] [PMC free article] [PubMed] [Google Scholar]
- 22. Zhang W, Zhou J, Zhou T, Li A, Wang N, Xu J, Chang Y, Man J, Pan X, Li T et al (2013) Phosphorylation‐triggered CUEDC2 degradation promotes UV‐induced G1 arrest through APC/CCdh1 regulation. Proc Natl Acad Sci 110: 11017–11022 [DOI] [PMC free article] [PubMed] [Google Scholar]
- 23. Kach J, Conzen SD, Szmulewitz RZ (2015) Targeting the glucocorticoid receptor in breast and prostate cancers. Sci Transl Med 7: 305ps319 [DOI] [PMC free article] [PubMed] [Google Scholar]
- 24. Whirledge SD, Oakley RH, Myers PH, Lydon JP, DeMayo F, Cidlowski JA (2015) Uterine glucocorticoid receptors are critical for fertility in mice through control of embryo implantation and decidualization. Proc Natl Acad Sci 112: 15166–15171 [DOI] [PMC free article] [PubMed] [Google Scholar]
- 25. Kadmiel M, Cidlowski JA (2013) Glucocorticoid receptor signaling in health and disease. Trends Pharmacol Sci 34: 518–530 [DOI] [PMC free article] [PubMed] [Google Scholar]
- 26. Kawauchi K, Araki K, Tobiume K, Tanaka N (2008) p53 regulates glucose metabolism through an IKK‐NF‐[kappa]B pathway and inhibits cell transformation. Nat Cell Biol 10: 611–618 [DOI] [PubMed] [Google Scholar]
- 27. Wang W, Xiao Z, Li X, Aziz KE, Gan B, Johnson RL, Chen J (2015) AMPK modulates Hippo pathway activity to regulate energy homeostasis. Nat Cell Biol 17: 490–499 [DOI] [PMC free article] [PubMed] [Google Scholar]
- 28. Reichardt SD, Foller M, Rexhepaj R, Pathare G, Minnich K, Tuckermann JP, Lang F, Reichardt HM (2012) Glucocorticoids enhance intestinal glucose uptake via the dimerized glucocorticoid receptor in enterocytes. Endocrinology 153: 1783–1794 [DOI] [PubMed] [Google Scholar]
- 29. Korgun ET, Sati L, Kipmen‐Korgun D, Ozen A, Unek G, Ustunel I, Demir R (2011) Expression of glucocorticoid receptor and glucose transporter‐1 during placental development in the diabetic rat. Folia Histochem Cytobiol 49: 325–334 [DOI] [PubMed] [Google Scholar]
- 30. Zhang W, Wang L, Wang Q, Luo X, Fang D, Chen Y, Pan X, Man J, Xia Q, Jin B et al (2012) CUEDC2 (CUE domain‐containing 2) and SOCS3 (suppressors of cytokine signaling 3) cooperate to negatively regulate Janus kinase 1/signal transducers and activators of transcription 3 signaling. J Biol Chem 287: 382–392 [DOI] [PMC free article] [PubMed] [Google Scholar]
- 31. Semenza GL, Jiang B, Leung SW, Passantino R, Concordet JP, Maire P, Giallongo A (1996) Hypoxia response elements in the aldolase A, Enolase 1, and lactate dehydrogenase A gene promoters contain essential binding sites for hypoxia‐inducible factor 1. J Biol Chem 271: 32529–32537 [DOI] [PubMed] [Google Scholar]
- 32. Le A, Cooper CR, Gouw AM, Dinavahi R, Maitra A, Deck LM, Royer RE, Vander Jagt DL, Semenza GL, Dang CV (2010) Inhibition of lactate dehydrogenase A induces oxidative stress and inhibits tumor progression. Proc Natl Acad Sci USA 107: 2037–2042 [DOI] [PMC free article] [PubMed] [Google Scholar]
- 33. Pozuelo Rubio M, Geraghty KM, Wong BH, Wood NT, Campbell DG, Morrice N, Mackintosh C (2004) 14‐3‐3‐affinity purification of over 200 human phosphoproteins reveals new links to regulation of cellular metabolism, proliferation and trafficking. Biochem J 379(Pt 2): 395–408 [DOI] [PMC free article] [PubMed] [Google Scholar]
- 34. Zhu G, Fan Z, Ding M, Zhang H, Mu L, Ding Y, Zhang Y, Jia B, Chen L, Chang Z et al (2015) An EGFR/PI3K/AKT axis promotes accumulation of the Rac1‐GEF Tiam1 that is critical in EGFR‐driven tumorigenesis. Oncogene 34: 5971–5982 [DOI] [PubMed] [Google Scholar]
- 35. Gomez‐Suarez M, Gutierrez‐Martinez IZ, Hernandez‐Trejo JA, Hernandez‐Ruiz M, Suarez‐Perez D, Candelario A, Kamekura R, Medina‐Contreras O, Schnoor M, Ortiz‐Navarrete V et al (2016) 14‐3‐3 Proteins regulate Akt Thr308 phosphorylation in intestinal epithelial cells. Cell Death Differ 23: 1060–1072 [DOI] [PMC free article] [PubMed] [Google Scholar]
- 36. Gao X, Dan S, Xie Y, Qin H, Tang D, Liu X, He Q, Liu L (2015) 14‐3‐3ζ reduces DNA damage by interacting with and stabilizing proliferating cell nuclear antigen. J Cell Biochem 116: 158–169 [DOI] [PubMed] [Google Scholar]
- 37. Chang C‐C, Zhang C, Zhang Q, Sahin O, Wang H, Xu J, Xiao Y, Zhang J, Rehman SK, Li P et al (2016) Upregulation of lactate dehydrogenase a by 14‐3‐3zeta leads to increased glycolysis critical for breast cancer initiation and progression. Oncotarget 7: 35270–35283 [DOI] [PMC free article] [PubMed] [Google Scholar]
- 38. Zhu H, Shyh‐Chang N, Segre AV, Shinoda G, Shah SP, Einhorn WS, Takeuchi A, Engreitz JM, Hagan JP, Kharas MG et al (2011) The Lin28/let‐7 axis regulates glucose metabolism. Cell 147: 81–94 [DOI] [PMC free article] [PubMed] [Google Scholar]
Associated Data
This section collects any data citations, data availability statements, or supplementary materials included in this article.
Supplementary Materials
Appendix
Expanded View Figures PDF
Source Data for Expanded View
Review Process File
Source Data for Figure 2
Source Data for Figure 3
Source Data for Figure 4
Source Data for Figure 5
Source Data for Figure 6