

ABSTRACT
Despite increasing evidence that subchondral bone contributes to osteoarthritis (OA) pathogenesis, little is known about local changes in bone structure compared to cartilage degeneration. This study linked structural adaptation of subchondral bone with histological OA grade. Twenty‐five osteochondral samples of macroscopically different degeneration were prepared from tibiae of 14 patients. Samples were scanned with micro‐computed tomography (μCT) and both conventional structural parameters and novel 3D parameters based on local patterns were analyzed from the subchondral plate and trabecular bone. Subsequently, samples were processed for histology and evaluated for OARSI grade. Each bone parameter and OARSI grade was compared to assess structural adaptation of bone with OA severity. In addition, thicknesses of cartilage, calcified cartilage, and subchondral plate were analyzed from histological sections and compared with subchondral bone plate thickness from μCT. With increasing OARSI grade, the subchondral plate became thicker along with decreased specific bone surface, while there was no change in tissue mineral density. Histological analysis showed that subchondral plate thickness from μCT also includes calcified cartilage. Entropy of local patterns increased with OA severity, reflecting higher tissue heterogeneity. In the trabecular compartment, bone volume fraction and both trabecular thickness and number increased with OARSI grade while trabecular separation and structure model index decreased. Also, elevation of local patterns became longitudinal in the subchondral plate and axial transverse in trabecular bone with increasing OARSI grade. This study demonstrates the possibility of radiological assessment of OA severity by structural analysis of bone. © 2016 The Authors. Journal of Orthopaedic Research Published by Wiley Periodicals, Inc. J Orthop Res 35:785–792, 2017.
Keywords: osteoarthritis, bone sclerosis, OARSI grading, micro‐computed tomography, histomorphometry
In osteoarthritis (OA), subchondral bone becomes sclerotic and undergoes structural changes such as the formation of osteophytes and bone cysts.1 It has been suggested that first tissue‐level changes in OA would occur in the subchondral bone before any signs of degeneration in the overlying articular cartilage,2, 3 and thus contribute to the pathogenesis of OA.4, 5, 6, 7 In respective of increasing evidence of subchondral bone modifications with OA, these changes are generally not assessed until late OA stages with clinical diagnostics and histopathology.
Recently, it has been suggested that different OA phenotypes (post‐traumatic, metabolic, ageing, genetic, pain) should be considered when studying OA and developing potential treatment or intervention.8 Most of the animal models studied are post‐traumatic and have shown a loss of bone in the trabecular compartment9, 10, 11, 12, 13, 14 and the subchondral plate,12, 13, 14, 15 whereas a thickening of the plate after trauma has also been reported.9 The loss of the subchondral plate has been associated with increased thickness of calcified cartilage.14 Most relevant models for ageing OA can be found, for instance, in Dunkin‐Hartley guinea pigs and primates. These species typically have a thicker subchondral plate16, 17, 18 with increased density and reduced porosity as well as increased trabecular bone volume fraction, anisotropy, plate‐like shape, and transverse orientation. These skeletal changes are thought to precede cartilage degeneration.18
In human (aging), OA a clinical hallmark is increased bone mineral density.19, 20 Histologically, it has been shown that in OA bone formation and volume are increased in subchondral trabecular bone with little resorption,21 whereas presence of resorption pits and microtrabeculae in human OA samples have also been reported.22 Changes in trabecular bone microstructure seem to follow a general pattern in various skeletal site: Tibia,23, 24, 25, 26, 27 femoral head,28 and neck.29 These changes include increase in trabecular bone volume fraction, thickness and reduced separation, whereas the overall trabeculae shape becomes rather plate‐like.23, 24, 25, 26, 27, 28, 29 Moreover, altered trabecular orientation and increased anisotropy have often been reported,29 though this effect has not always been obvious.25, 28 This controversy promotes the need for evaluating variations of local patterns in skeletal structures using alternative methods to better understand the bone changes in OA.25, 28, 30
In previous studies, the subchondral plate in OA has been reported to be thicker and more porous.22, 31 To our knowledge, there is no study reporting the actual relationship between histological disease severity and subchondral bone plate modifications analyzed volumetrically using human sample material. Moreover, calcified cartilage has been shown to increase its thickness with OA process32 but it becomes virtually absent in late OA.22, 32 Despite increasing evidence that the subchondral bone would contribute to the pathogenesis of OA,4, 5, 6, 7 most diagnostic methods are still focused mainly on cartilage degeneration and erosion, and skeletal changes are acknowledged only at late stages. Therefore, we hypothesized that subchondral bone changes occur in parallel with cartilage degeneration. To test this hypothesis, subchondral bone changes in both trabecular bone and subchondral plate were evaluated as a function of disease severity, evaluated by OARSI grading system.33Subchondral bone changes were analyzed by two methods: (1) traditional morphological analyses in whole tissue volume, and (2) analyses of local bone patterns using a volumetric local binary patterns (LBP)‐based analysis, which is a promising method to study distribution, orientation, continuity, and complexity of local structures.
MATERIALS AND METHODS
Human Osteochondral Samples
Tibial plateaus were collected from 14 late OA‐patients (age 76 ± 9 years: 2 males and 12 females) treated with total knee arthroplasty at Oulu University Hospital, Finland. Sample collection and the study protocol was approved by the Ethical Committee of the Northern Ostrobothnia Hospital District, Oulu, Finland (191/2000). Altogether, 25 osteochondral samples were prepared from tibial plateaus from areas visually classified into three categories in terms of macroscopical degeneration of the articular cartilage: (1) intact cartilage (N = 11), (2) moderate cartilage erosion (N = 7), and (3) partly or fully exposed subchondral bone (N = 7). Cylindrical samples with a diameter of 6 mm were prepared from all macroscopic visual grades.
Imaging and Evaluation of Structural Parameters
Samples were stored in phosphate‐buffered saline (PBS) for micro‐computed tomography (μCT) imaging. Osteochondral cylinders were scanned with a μCT device at isotropic 27.8 μm voxel size (Skyscan 1172, Bruker microCT, Kontich, Belgium). Images were reconstructed and analyzed with manufacturer provided software. The subchondral plate was manually segmented from the trabecular bone. Both trabecular and cortical plate compartments were analyzed separately. One sample did not have any trabecular bone and could not be included in the analyses. Images were pre‐thresholded to 60 and remaining pixels were binarized with adaptive thresholding using the mean of minimum and maximum values within a 5 pixel radius window. After binarization, images were subjected to morphological analyses and the outcome variables are described in ref.34
The Volumetric Local Binary Patterns Method
In this study, a new alternative method, known as LBP35 was used for analysis of local bone changes as a function of histological OA grade. Briefly, in the LBP method, the neighborhood of a center pixel is evaluated for occurrences of equal or higher gray level values than in the center pixel. For each center pixel, a specific local pattern is then determined based on the locations of these occurrences which are called markers. The LBP method was applied to every pixel with at least one neighbor with a higher value than a fixed threshold in order to capture only information about the bone and avoid non‐relevant data from empty space.
LBP‐based analysis was performed with a custom‐made algorithm (MATLAB version R2013b, MathWorks, Natick, MA). The LBP method used here is an improved version of the one reported in the literature.36 While the previous analysis was performed in 2D, the method used here was developed to perform 3D volumetric analyses. For this purpose, instead of fitting 8 neighbors on a circle within the studied slice, a total of 26 neighbors were fitted on a sphere (Fig. S1) within multiple slices, the studied pixel being the center of the sphere. The gray‐level value of the neighbors was calculated by interpolation of the voxels values surrounding them. Histograms of patterns distribution were obtained from the analysis and the entropy of the local patterns was evaluated as well as the amount of different local patterns obtained. The histograms were converted to obtain the occurrences of each specific pattern as a percentage of all the patterns recognized within a VOI. The entropy of local patterns was calculated as follows:
| (1) |
where Pi contains the count of a specific local pattern i occurring in the image. If an image contains only one local pattern, the entropy of the patterns within the image is zero. The entropy here describes the randomness of local patterns in the volume of interest.
The elevation angle of each pattern was calculated using principal component analysis. The elevation is the angle along the distal‐proximal axis, representing the alignment of patterns toward the cartilage surface. The patterns without consistent orientation were ignored in the analysis, the following cases were considered as such: Not enough markers (<3), too many markers (>24), or when markers were located a further distance from the “centroid” than non‐markers. As the μCT imaging acquisition protocol did not allow maintaining the same reference orientation on the other plans, the azimuth angle was ignored in the analysis.
Both the entropy and the homogeneity of the elevation were calculated to describe spatial distribution of the elevation angles and to provide an indication on continuity of the structures. An angle‐level co‐occurrence matrix (ALCM) was first calculated with volumetric rotational invariance to assess the spatial distribution of the elevation angle. The homogeneity of the elevation was then calculated from the ALCM as such:
| (2) |
where each element (i,j) in the ALCM is the sum of the occurrences that a voxel with elevation i has a voxel with elevation j in its vicinity (one voxel‐size radius). Eventually, a high value of homogeneity of the elevation corresponds to data with consecutive voxels with similar elevation angles.
Histopathology
After μCT imaging, cylinders were formalin‐fixed and decalcified in EDTA. Paraffin‐embedded blocks were sectioned to 5 μm and stained with Safranin O and Masson's trichrome. OARSI grading33 was conducted with Safranin O stained sections. Each sample was graded from three sections by three independent evaluators (MF, OA, VT). The average grade from three evaluators was used as the final OARSI grade for further analyses. Samples with Masson's trichrome staining were scanned with a microscope slide scanner (Pannoramic 250F, 3DHISTECH, Budapest, Hungary) and images were exported to Fiji, where cartilage, subchondral plate, and calcified cartilage were manually segmented and their thicknesses were measured using a BoneJ plug‐in (Fig. 1A–D).37
Figure 1.
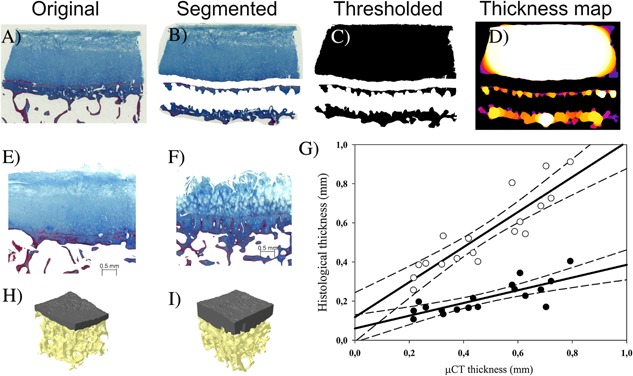
Analysis of joint tissue morphologies was performed from Masson's trichrome stained sections. From original images (A) cartilage, calcified cartilage and subchondral bone were manually segmented (B) followed by thresholding and procedure to remove closed pores to fill cell lacunae (C). These images were then subjected for thickness analyses (D). Regression analysis between μCT and histological thicknesses (G) shows best correlation to total thickness of mineralized structures (open circles), instead of subchondral bone alone (black circles). Finally, a comparison between reconstructed 3D models of analyzed bones, with OARSI grade of 1.6 (H) and other with OARSI grade of 4.1 (I) with respective histological images (E and F). In 3D models, subchondral plate is colored as gray and trabecular bone as yellow.
Statistical Analysis
Statistical analyses were performed using SPSS software (version 20.0; SPSS, Chicago, IL). To test precision manual segmentation was repeated for one sample 10 times and coefficient of variations (CV%) were calculated for morphometric parameters. Exploratory data analysis was performed by plotting structural parameters against OARSI grade and visualizing each TKR patient with specific markers. Although there is a large variation within a patient, possible effect of pseudoreplicates was removed by equally weighting samples from the same donor (N = 13 trabecular bone, N = 14 subchondral bone plate) for correlation analysis. Pearson's linear correlation coefficients were calculated between the OARSI grade and the parameters derived from both traditional structural analysis and the LBP method. To evaluate which structures were included in the μCT‐based plate thickness, these values were correlated against the histologically measured calcified cartilage, subchondral plate thickness, and their sum.
RESULTS
All knees had large internal variation in OARSI grades depending on the site. The OARSI grades varied from 0.9 to 6.3 (mean ± SD = 3.5 ± 1.7). High precision was noted for both histological and μCT‐derived morphological parameters as indicated by CV% ranges 0.81–3.19% and 0.21–3.80%, respectively (Tables S1 and S2). Results from histological sections (Fig. S2) showed a thicker subchondral bone plate with higher OARSI grade (R = 0.67, p = 0.025). On other hand, cartilage thickness showed only moderate negative correlation (R = −0.57, p = 0.065) and there was no correlation with calcified cartilage thickness (R = −0.12, p = 0.720) when linked to OARSI grade. However, the total thickness of mineralized structures, calculated as the sum of subchondral plate and calcified cartilage thicknesses, showed even stronger correlation to OARSI grade (R = 0.83, p = 0.002). The subchondral bone plate thickness measured from histology was linearly correlated to the one derived from μCT (Fig. 1, R = 0.88, p < 0.001), the latter one being twice as thick. However, if the total thickness of mineralized structures from histological sections were compared against μCT‐derived plate thickness, μCT gave slightly smaller values, and the correlation (R = 0.98, p < 0.001) was stronger.
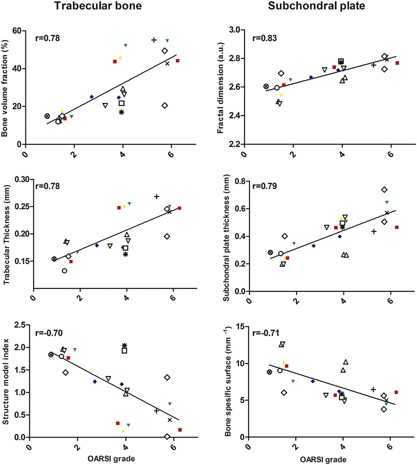
The majority of the structural and texture bone parameters showed strong correlations with OARSI grades (Table 1 and Fig. 2). The subchondral plate thickness and fractal dimension correlated positively with OARSI grade (R = 0.79 and R = 0.83, respectively) with decreasing bone specific surface (R = −0.71). The trabecular bone volume fraction increased with OARSI grade (R = 0.78) with decreasing bone specific surface (R = −0.79). Also the trabecular number (R = 0.80) and thickness (R = 0.78) increased, while their separation decreased (R = −0.74) leading to increased connectivity of trabecular network as indicated by increasing connectivity density (R = 0.73) and decreasing trabecular pattern factor (R = −0.78) with disease severity. Furthermore, trabeculae shape became more plate‐like as indicated by a negative correlation between structure model index and OARSI grade (R = −0.70). Conventional morphological analysis showed only moderately lower anisotropy (R = −0.47) with OARSI grade.
Table 1.
Pearson Correlation Coefficients Between Subchondral Plate/Trabecular Bone Structural Parameters and OARSI Grade
| Subchondral Plate Parameter | Correlation With OARSI Grade |
|---|---|
| Thickness (mm) | 0.79** |
| Specific bone surface (1/mm) | −0.71* (p = 0.006) |
| Fractal dimension (a.u.) | 0.83** |
| Trabecular Bone | Correlation With OARSI Grade |
| Bone volume fraction (%) | 0.78* (p = 0.002) |
| Specific bone surface (1/mm) | −0.79** |
| Trabecular number (1/mm) | 0.80** |
| Trabecular thickness (mm) | 0.78* (p = 0.002) |
| Trabecular separation (mm) | −0.74* (p = 0.004) |
| Connectivity (a.u.) | 0.17 (p = 0.58) |
| Connectivity density (1/mm3) | 0.73* (p = 0.005) |
| Structure model index (a.u.) | −0.70* (p = 0.008) |
| Trabecular pattern factor (1/mm) | −0.78* (p = 0.002) |
| Degree of anisotropy (a.u.) | −0.47 (p = 0.11) |
| Fractal dimension (a.u.) | 0.83** |
a.u., arbitrary unit. *p < 0.05; **p < 0.001
Figure 2.
Right: Subchondral bone plate fractal dimension, thickness, and specific bone surface presented as a function OARSI grade. Left: Trabecular bone volume fraction, number, and entropy of local patterns as a function OARSI grade. Samples from each donor are plotted with different markers demonstrating larger variation of OARSI grades and μCT derived parameters within each tibia.
The novel 3D LPB analysis showed (Table 2) that in both the subchondral plate and trabecular bone compartments, a higher OARSI grade corresponded to a higher number of different patterns (R = 0.89 and R = 0.69, respectively) and an increase in the entropy of patterns (R = 0.80 and R = 0.83, respectively). Samples with high OARSI grades presented a stronger proportion of patterns oriented longitudinally in subchondral plate and transversally in trabecular bone (Fig. 3) than samples with lower OARSI grades. The homogeneity of angle elevation was also negatively correlated with OARSI grade in subchondral plate (R = −0.80) as well as trabecular bone (R = −0.79) while elevation entropy increased (R = 0.79 and R = 0.69, respectively) with OARSI grade. These results indicate discontinuity in the orientations within consecutive patterns, suggesting sharper angles in the architectures and eventually higher complexity of the structures in general.
Table 2.
Pearson Correlation Coefficients Between Subchondral Plate/Trabecular Bone LBP Parameters and OARSI Grade
| Subchondral Plate | Correlation With OARSI Grade |
|---|---|
| LBP: Average number of markers (a.u.) | 0.73* (p = 0.005) |
| LBP: Number of different patterns (a.u.) | 0.89*** |
| LBP: Patterns entropy (a.u.) | 0.80** |
| LBP: Elevation entropy (a.u.) | 0.79** |
| LPB: Homogeneity of elevation (a.u.) | −0.80** |
| LPB: Average elevation (°) | 0.82*** |
| Trabecular Bone | Correlation With OARSI Grade |
| LBP: Average number of markers (a.u.) | 0.86*** |
| LBP: Number of different patterns (a.u.) | 0.69* (p = 0.01) |
| LBP: Patterns entropy (a.u.) | 0.83*** |
| LBP: Elevation entropy (a.u.) | 0.69* (p = 0.009) |
| LPB: Homogeneity of elevation (a.u.) | −0.79* (p = 0.002) |
| LPB: Average elevation (°) | −0.53 (p = 0.06) |
LBP, local binary pattern analysis; a.u., arbitrary unit; *p < 0.05; **p < 0.001; ***p < 0.0001
Figure 3.
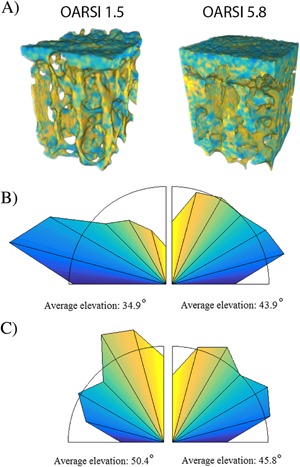
Visualization of color coded elevation angles from 3D local binary patterns (LBP) analysis from samples with OARSI grades of 1.5 and 5.8 (A). Normalized distribution of elevation angles shows that with increasing OARSI grade patterns are rather oriented longitudinal (yellow) in subchondral plate (B) and transverse (blue) in trabecular bone (C).
DISCUSSION
It is known that subchondral bone becomes more sclerotic in OA,2 but there is little evidence where the earliest microstructural changes in OA actually start—within cartilage or subchondral bone. Although this long standing question remains to be further elucidated, our results indicate that subchondral bone modifications are strongly coupled to articular cartilage degeneration already at the lowest OARSI grades. Morphometric parameters of subchondral plate and trabecular bone were evaluated separately due to the specific structure and functions leading to possibly different adaptation to OA in these compartments.38 Our results indicate that OA‐related alterations are present in both.
Our results showed higher trabecular bone volume fraction with OA due to higher trabecular number and thickness and lower trabecular separation. In this study, one of the calculated morphological parameters was SMI. This metric gives an estimation of the shape of the trabecular structures, from plate to rod‐like. Here, we observed a negative correlation between SMI and OARSI grade, corresponding to a plate‐like appearance of trabeculae in advanced OA. This finding was expected based on previous morphometric guinea pig model of spontaneous OA17, 18 and human studies.23, 24, 25, 26, 27, 28, 29 As an adaptation to OA, trabecular bone may increase its stiffness and strength39, 40, 41 by changing its structure to resist higher loading due to cartilage loss.
For both the subchondral plate and trabecular bone, the specific bone surface decreased with OA. This parameter corresponds to the ratio of bone surface by volume, suggesting that the bone surfaces become more uniform in trabecular bone and smoother in subchondral plate with increasing OARSI grade. In a recent study,14 a large variation in subchondral plate thickness was observed within healthy and OA knees, with a tendency for the plate to become thicker with disease progression. As expected, the subchondral bone plate became thicker with higher OARSI grades and this relationship was surprisingly linear. To further validate this observation, thickness of calcified cartilage and subchondral plate from the Masson's trichrome stained histological sections were measured. These results revealed that μCT‐derived subchondral plate thickness also includes calcified cartilage. We further tested if histological subchondral plate or calcified cartilage thickness correlate with OARSI grade. Parallel to μCT subchondral plate thickness, histological subchondral plate showed positive but weaker correlation to OARSI grade, while there was no linear correlation to the calcified cartilage thickness. This lack of correlation could be expected as there is denudation of cartilaginous structures at OARSI grades >5. It could be that the earliest change in OA is the advancing tidemark, which makes the actual hyaline cartilage thinner and allows thickening and stiffening of subchondral plate, thereby increasing stress in the cartilage to pathological level. In OA, increased osteoclastic resorption in subchondral bone can extend over the calcified cartilage,42 increasing the porosity of the subchondral plate43 and its hydraulic conductance.32 Also in post‐traumatic OA models, accelerated bone remodeling has been observed as indicated by an increased number of osteoclasts and osteoid in subchondral bone, increasing its permeability (angiogenesis).14 Nevertheless, our results showed the best correlation between thickness of mineralized structures and OARSI only when subchondral plate and calcified cartilage where accounted for. However, the role of tidemark in OA pathogenesis is still unclear and should be further considered in future studies.44
These results highlight the potential of evaluating OA severity from mineralized structures. In longitudinal in vivo studies, this could be achieved either by following changes in calcified cartilage using ultrashort echo time magnetic resonance imaging45 or evaluating subchondral plate and trabecular bone properties from high resolution clinical CT. The latter may become even more of an attractive option when combined with novel image processing tools such as 3D LBP.
In this study, the feasibility of applying a novel 3D LBP image analysis method related to local bone patterns in μCT scans was evaluated. By using 3D LBP‐based method, it was possible to derive information on distribution, orientation, and complexity of patterns. The primary advantage of LBP is its low sensitivity for monotonic grayscale variations.46 This is important because LBP may be ideally suited for clinical CT or extremity CT images where beam hardening and partial volume effect can reduce the variation in gray‐levels to an extent that individual structures cannot be accurately segmented using global or even adaptive thresholds.
To date, the LBP method has been applied solely in 2D to analyze local bone structures in OA.36, 47 As noted earlier, entropy of local patterns is a measure of the randomness of the different bone patterns appearing in the region or volume of interest. Recently, it has been shown that the entropy of local patterns was related to OA severity assessed via K‐L grading scale,47 which parallels our findings. Also LBP‐derived structural local bone properties identified in this study are in accordance with previous fractal‐based studies showing significant differences between controls and patients with OA.48
The current study showed that the elevation of patterns with increasing disease severity indicated that the subchondral bone plate and trabecular bone have different characteristics, which is expected since these compartments have different morphology, physiology and mechanical properties.4 The higher complexity and discontinuity of the local consecutive patterns (in terms of orientations) in both compartments is directly related to altered bone structure as more connections between the bony structures are created with advancing OA.29 In the subchondral bone plate, the appearance of non‐uniform patterns could indicate altered porosity and tissue heterogeneity. In trabecular bone, the degree of anisotropy was lower with higher OARSI grades as previously suggested.25, 28, 29 The novel 3D LBP method clearly demonstrated higher entropy and a rather transverse orientation (Fig. 3). This altered orientation fits well with the early proposal by Radin and Rose about adaptation of subchondral bone to shear stress.49
This study highlights the importance of subchondral bone changes in human OA. Most importantly, these results indicate that changes in articular cartilage and subchondral bone are likely to be coupled, at least in this sample set. Therefore, based on this data, the cartilage‐driven initiation of OA cannot be supported. However, it should be mentioned that according to current understanding, OA is not just a single disease but instead a group of diseases with different phenotypes.50 It may be that the current samples represents an ageing phenotype, where both cartilage and bone changes occur with relatively the same speed. On the other hand, post‐traumatic OA, for example, could be a phenotype starting from the articular cartilage defect, leading to subsequent subchondral bone changes. However, at this stage, this can be only speculated and more research is needed to understand the etiopathology of OA and its different phenotypes.
A major strength of this exploratory study pertains in comprehensive analysis of bone and cartilage using histological methods as well as μCT analyses with both conventional and novel LBP‐based methods. Furthermore, as this study focused on smaller volumes directly under histologically graded area, the link between bone morphometric parameters and OARSI grade was highly linear. A major limitation, however, remains concerning the tissue samples from late‐OA patients scheduled for knee surgery. Given their nature, it cannot be known for sure whether the samples with low OARSI grades are truly representative of early OA bone and cartilage. To fully confirm this, a larger size of human samples from both symptomatic and asymptomatic donors is required.
In summary, results obtained from volumetric standard bone parameters, as well as parameters from local analysis of bone patterns, were complementary. The high correlation between the OARSI grade and the subchondral plate thickness and the trabecular bone volume fraction indicate that bone sclerosis and cartilage degeneration are coupled. Furthermore, the novel LBP‐based method is a potential tool for evaluating both quantitative and qualitative changes from low‐resolution clinical images. Altogether, this study demonstrated the possibility to diagnose severity of OA using bone structural analysis, which eventually could be assessed in clinical settings.
AUTHORS’ CONTRIBUTIONS
MF, JT, MTN, PL, SS contributed to study design. MAJF, OA, VT, JR, SK, MV, PL contributed to data collection. MAJF, JT, SK, KP contributed to data analysis. MAJF, JT, KP, PL, SS contributed to data interpretation. MAJF, JT contributed to manuscript preparation. All authors contributed to revising and approval of manuscript content. MF takes responsibility for the integrity of the work.
Supporting information
Additional supporting information may be found in the online version of this article.
Figure S1. Demonstration of the LBP‐based method.
Figure S2. Correlation between OARSI grade and histologically defines thicknesses of different osteochondral tissues: In upper row thicknesses of cartilage and calcified cartilage on left and right respectively.
Table S1. Coefficient of variations for subchondral plate and trabecular bone structural parameters.
Table S2. Pearson correlation coefficients between cartilage, calcified cartilage and subchondral plate thickness from histological images, and OARSI grade and coefficient of variations for thicknesses analyzed from histological images
ACKNOWLEDGMENTS
The authors would like to thank Mrs. Eija Rahunen and Ms. Krista Rahunen for the excellent technical assistance with histology and Dr. Risto Bloigu for advising with the statistical analysis. This study has been financial supported by the Academy of Finland (grants no. 260321, 268378 and 273571); Sigrid Juselius Foundation; European Research Council under the European Union's Seventh Framework Programme (FP/2007‐2013) / ERC Grant Agreement no. 336267; and the strategic funding of the University of Oulu. The funding bodies had no involvement in the study design, implementation, or writing of the manuscript.
Petri Lehenkari and Simo Saarakkala contributed equally to this work.
REFERENCES
- 1. Buckwalter JA, Mankin HJ. 1998. Articular cartilage: degeneration and osteoarthritis, repair, regeneration, and transplantation. Instr Course Lect 47:487–504. [PubMed] [Google Scholar]
- 2. Burr DB, Gallant MA. 2012. Bone remodelling in osteoarthritis. Nat Rev Rheumatol 8:665–673. [DOI] [PubMed] [Google Scholar]
- 3. Radin EL, Paul IL, Tolkoff MJ. 1970. Subchondral bone changes in patients with early degenerative joint disease. Arthritis Rheum 13:400–405. [DOI] [PubMed] [Google Scholar]
- 4. Burr DB. 2004. Anatomy and physiology of the mineralized tissues: role in the pathogenesis of osteoarthrosis. Osteoarthritis Cartilage 12(Suppl A):S20–S30. [DOI] [PubMed] [Google Scholar]
- 5. Goldring MB, Goldring SR. 2010. Articular cartilage and subchondral bone in the pathogenesis of osteoarthritis. Ann N Y Acad Sci 1192:230–237. [DOI] [PubMed] [Google Scholar]
- 6. Castaneda S, Roman‐Blas JA, Largo R, et al. 2012. Subchondral bone as a key target for osteoarthritis treatment. Biochem Pharmacol 83:315–323. [DOI] [PubMed] [Google Scholar]
- 7. Li G, Yin J, Gao J, et al. 2013. Subchondral bone in osteoarthritis: insight into risk factors and microstructural changes. Arthritis Res Ther 15:223. [DOI] [PMC free article] [PubMed] [Google Scholar]
- 8. Karsdal MA, Christiansen C, Ladel C, et al. 2014. Osteoarthritis—a case for personalized health care? Osteoarthritis Cartilage 22:7–16. [DOI] [PubMed] [Google Scholar]
- 9. Dedrick DK, Goldstein SA, Brandt KD, et al. 1993. A longitudinal study of subchondral plate and trabecular bone in cruciate‐deficient dogs with osteoarthritis followed up for 54 months. Arthritis Rheum 36:1460–1467. [DOI] [PubMed] [Google Scholar]
- 10. Boyd SK, Matyas JR, Wohl GR, et al. 2000. Early regional adaptation of periarticular bone mineral density after anterior cruciate ligament injury. J Appl Physiol (1985) 89:2359–2364. [DOI] [PubMed] [Google Scholar]
- 11. Behets C, Williams JM, Chappard D, et al. 2004. Effects of calcitonin on subchondral trabecular bone changes and on osteoarthritic cartilage lesions after acute anterior cruciate ligament deficiency. J Bone Miner Res 19:1821–1826. [DOI] [PubMed] [Google Scholar]
- 12. Intema F, Hazewinkel HA, Gouwens D, et al. 2010. In early OA, thinning of the subchondral plate is directly related to cartilage damage: results from a canine ACLT‐meniscectomy model. Osteoarthritis Cartilage 18:691–698. [DOI] [PubMed] [Google Scholar]
- 13. Intema F, Sniekers YH, Weinans H, et al. 2010. Similarities and discrepancies in subchondral bone structure in two differently induced canine models of osteoarthritis. J Bone Miner Res 25:1650–1657. [DOI] [PubMed] [Google Scholar]
- 14. Zhen G, Wen C, Jia X, et al. 2013. Inhibition of TGF‐beta signaling in mesenchymal stem cells of subchondral bone attenuates osteoarthritis. Nat Med 19:704–712. [DOI] [PMC free article] [PubMed] [Google Scholar]
- 15. Florea C, Malo MK, Rautiainen J, et al. 2015. Alterations in subchondral bone plate, trabecular bone and articular cartilage properties of rabbit femoral condyles at 4 weeks after anterior cruciate ligament transection. Osteoarthritis Cartilage 23:414–422. [DOI] [PubMed] [Google Scholar]
- 16. Carlson CS, Loeser RF, Purser CB, et al. 1996. Osteoarthritis in cynomolgus macaques. III: effects of age, gender, and subchondral bone thickness on the severity of disease. J Bone Miner Res 11:1209–1217. [DOI] [PubMed] [Google Scholar]
- 17. Ding M, Danielsen CC, Hvid I. 2006. Age‐related three‐dimensional microarchitectural adaptations of subchondral bone tissues in guinea pig primary osteoarthrosis. Calcif Tissue Int 78:113–122. [DOI] [PubMed] [Google Scholar]
- 18. Wang T, Wen CY, Yan CH, et al. 2013. Spatial and temporal changes of subchondral bone proceed to microscopic articular cartilage degeneration in guinea pigs with spontaneous osteoarthritis. Osteoarthritis Cartilage 21:574–581. [DOI] [PubMed] [Google Scholar]
- 19. Burger H, van Daele PL, Odding E, et al. 1996. Association of radiographically evident osteoarthritis with higher bone mineral density and increased bone loss with age. the rotterdam study. Arthritis Rheum 39:81–86. [DOI] [PubMed] [Google Scholar]
- 20. Johnston JD, Kontulainen SA, Masri BA, et al. 2010. A comparison of conventional maximum intensity projection with a new depth‐specific topographic mapping technique in the CT analysis of proximal tibial subchondral bone density. Skeletal Radiol 39:867–876. [DOI] [PubMed] [Google Scholar]
- 21. Matsui H, Shimizu M, Tsuji H. 1997. Cartilage and subchondral bone interaction in osteoarthrosis of human knee joint: a histological and histomorphometric study. Microsc Res Tech 37:333–342. [DOI] [PubMed] [Google Scholar]
- 22. Li B, Marshall D, Roe M, et al. 1999. The electron microscope appearance of the subchondral bone plate in the human femoral head in osteoarthritis and osteoporosis. J Anat 195(Pt 1):101–110. [DOI] [PMC free article] [PubMed] [Google Scholar]
- 23. Bobinac D, Spanjol J, Zoricic S, et al. 2003. Changes in articular cartilage and subchondral bone histomorphometry in osteoarthritic knee joints in humans. Bone 32:284–290. [DOI] [PubMed] [Google Scholar]
- 24. Kamibayashi L, Wyss UP, Cooke TD, et al. 1995. Trabecular microstructure in the medial condyle of the proximal tibia of patients with knee osteoarthritis. Bone 17:27–35. [DOI] [PubMed] [Google Scholar]
- 25. Ding M, Odgaard A, Hvid I. 2003. Changes in the three‐dimensional microstructure of human tibial cancellous bone in early osteoarthritis. J Bone Joint Surg Br 85:906–912. [PubMed] [Google Scholar]
- 26. Cox LG, van Donkelaar CC, van Rietbergen B, et al. 2013. Alterations to the subchondral bone architecture during osteoarthritis: bone adaptation vs endochondral bone formation. Osteoarthritis Cartilage 21:331–338. [DOI] [PubMed] [Google Scholar]
- 27. Chou CH, Lee CH, Lu LS, et al. 2013. Direct assessment of articular cartilage and underlying subchondral bone reveals a progressive gene expression change in human osteoarthritic knees. Osteoarthritis Cartilage 21:450–461. [DOI] [PMC free article] [PubMed] [Google Scholar]
- 28. Chappard C, Peyrin F, Bonnassie A, et al. 2006. Subchondral bone micro‐architectural alterations in osteoarthritis: a synchrotron micro‐computed tomography study. Osteoarthritis Cartilage 14:215–223. [DOI] [PubMed] [Google Scholar]
- 29. Djuric M, Zagorac S, Milovanovic P, et al. 2013. Enhanced trabecular micro‐architecture of the femoral neck in hip osteoarthritis vs. healthy controls: a micro‐computer tomography study in postmenopausal women. Int Orthop 37:21–26. [DOI] [PMC free article] [PubMed] [Google Scholar]
- 30. Fazzalari NL, Parkinson IH. 1997. Fractal properties of subchondral cancellous bone in severe osteoarthritis of the hip. J Bone Miner Res 12:632–640. [DOI] [PubMed] [Google Scholar]
- 31. Grynpas MD, Alpert B, Katz I, et al. 1991. Subchondral bone in osteoarthritis. Calcif Tissue Int 49:20–26. [DOI] [PubMed] [Google Scholar]
- 32. Hwang J, Bae WC, Shieu W, et al. 2008. Increased hydraulic conductance of human articular cartilage and subchondral bone plate with progression of osteoarthritis. Arthritis Rheum 58:3831–3842. [DOI] [PMC free article] [PubMed] [Google Scholar]
- 33. Pritzker KP, Gay S, Jimenez SA, et al. 2006. Osteoarthritis cartilage histopathology: grading and staging. Osteoarthritis Cartilage 14:13–29. [DOI] [PubMed] [Google Scholar]
- 34. Bouxsein ML, Boyd SK, Christiansen BA, et al. 2010. Guidelines for assessment of bone microstructure in rodents using micro‐computed tomography. J Bone Miner Res 25:1468–1486. [DOI] [PubMed] [Google Scholar]
- 35. Pietikäinen M, Hadid A, Zhao G, et al. 2011. Computer vision using local binary patterns. London, UK: Springer‐Verlag London. [Google Scholar]
- 36. Thevenot J, Chen J, Finniä M, et al. 2015. Local binary patterns to evaluate trabecular bone structure from micro‐CT data: application to studies of human osteoarthritis. ECCV Workshops Part II, LNCS 8926:63–79. [Google Scholar]
- 37. Doube M, Klosowski MM, Arganda‐Carreras I, et al. 2010. BoneJ: free and extensible bone image analysis in ImageJ. Bone 47:1076–1079. [DOI] [PMC free article] [PubMed] [Google Scholar]
- 38. Madry H, van Dijk CN, Mueller‐Gerbl M. 2010. The basic science of the subchondral bone. Knee Surg Sports Traumatol Arthrosc 18:419–433. [DOI] [PubMed] [Google Scholar]
- 39. Mittra E, Rubin C, Qin YX. 2005. Interrelationship of trabecular mechanical and microstructural properties in sheep trabecular bone. J Biomech 38:1229–1237. [DOI] [PubMed] [Google Scholar]
- 40. Teo JC, Si‐Hoe KM, Keh JE, et al. 2006. Relationship between CT intensity, micro‐architecture and mechanical properties of porcine vertebral cancellous bone. Clin Biomech (Bristol, Avon) 21:235–244. [DOI] [PubMed] [Google Scholar]
- 41. Li ZC, Dai LY, Jiang LS, et al. 2012. Difference in subchondral cancellous bone between postmenopausal women with hip osteoarthritis and osteoporotic fracture: implication for fatigue microdamage, bone microarchitecture, and biomechanical properties. Arthritis Rheum 64:3955–3962. [DOI] [PubMed] [Google Scholar]
- 42. Botter SM, van Osch GJ, Waarsing JH, et al. 2008. Cartilage damage pattern in relation to subchondral plate thickness in a collagenase‐induced model of osteoarthritis. Osteoarthritis Cartilage 16:506–514. [DOI] [PubMed] [Google Scholar]
- 43. Botter SM, van Osch GJ, Clockaerts S, et al. 2011. Osteoarthritis induction leads to early and temporal subchondral plate porosity in the tibial plateau of mice: an in vivo microfocal computed tomography study. Arthritis Rheum 63:2690–2699. [DOI] [PubMed] [Google Scholar]
- 44. Simkin PA. 2012. Consider the tidemark. J Rheumatol 39:890–892. [DOI] [PubMed] [Google Scholar]
- 45. Bae WC, Dwek JR, Znamirowski R, et al. 2010. Ultrashort echo time MR imaging of osteochondral junction of the knee at 3T: identification of anatomic structures contributing to signal intensity. Radiology 254:837–845. [DOI] [PMC free article] [PubMed] [Google Scholar]
- 46. Ojala T, Pietikäinen M, Harwood D. 1996. A comparative study of texture measures with classification based on featured distributions. Pattern Recognit 29:51–59. [Google Scholar]
- 47. Hirvasniemi J, Thevenot J, Immonen V, et al. 2014. Quantification of differences in bone texture from plain radiographs in knees with and without osteoarthritis. Osteoarthritis Cartilage 22(Supplement(0)):S268–S269. [DOI] [PMC free article] [PubMed] [Google Scholar]
- 48. Wolski M, Podsiadlo P, Stachowiak GW, et al. 2010. Differences in trabecular bone texture between knees with and without radiographic osteoarthritis detected by directional fractal signature method. Osteoarthritis Cartilage 18:684–690. [DOI] [PubMed] [Google Scholar]
- 49. Radin EL, Rose RM. 1986. Role of subchondral bone in the initiation and progression of cartilage damage. Clin Orthop Relat Res 213:34–40. [PubMed] [Google Scholar]
- 50. Bijlsma JW, Berenbaum F, Lafeber FP. 2011. Osteoarthritis: an update with relevance for clinical practice. Lancet 377:2115–2126. [DOI] [PubMed] [Google Scholar]
Associated Data
This section collects any data citations, data availability statements, or supplementary materials included in this article.
Supplementary Materials
Additional supporting information may be found in the online version of this article.
Figure S1. Demonstration of the LBP‐based method.
Figure S2. Correlation between OARSI grade and histologically defines thicknesses of different osteochondral tissues: In upper row thicknesses of cartilage and calcified cartilage on left and right respectively.
Table S1. Coefficient of variations for subchondral plate and trabecular bone structural parameters.
Table S2. Pearson correlation coefficients between cartilage, calcified cartilage and subchondral plate thickness from histological images, and OARSI grade and coefficient of variations for thicknesses analyzed from histological images