Abstract
High field MRI is beneficial for chemical exchange saturation transfer (CEST) in terms of high SNR, CNR, and chemical shift dispersion. These advantages may, however, be counter‐balanced by the increased transmit field inhomogeneity normally associated with high field MRI. The relatively high sensitivity of the CEST contrast to B 1 inhomogeneity necessitates the development of correction methods, which is essential for the clinical translation of CEST. In this work, two B 1 correction algorithms for the most studied CEST effects, amide‐CEST and nuclear Overhauser enhancement (NOE), were analyzed. Both methods rely on fitting the multi‐pool Bloch‐McConnell equations to the densely sampled CEST spectra. In the first method, the correction is achieved by using a linear B 1 correction of the calculated amide and NOE CEST effects. The second method uses the Bloch‐McConnell fit parameters and the desired B 1 amplitude to recalculate the CEST spectra, followed by the calculation of B 1‐corrected amide and NOE CEST effects. Both algorithms were systematically studied in Bloch‐McConnell equations and in human data, and compared with the earlier proposed ideal interpolation‐based B 1 correction method. In the low B 1 regime of 0.15–0.50 μT (average power), a simple linear model was sufficient to mitigate B 1 inhomogeneity effects on a par with the interpolation B 1 correction, as demonstrated by a reduced correlation of the CEST contrast with B 1 in both the simulations and the experiments.
Keywords: B1 correction, Bloch‐McConnell equations, relaxation‐compensated amide‐CEST, relaxation‐compensated NOE CEST, transmit field inhomogeneity
1. INTRODUCTION
Chemical exchange saturation transfer (CEST) is a magnetization transfer (MT)‐based contrast allowing the low concentration metabolite pools bearing exchangeable protons to be detected indirectly through the abundant exchange‐mediating water proton pool.1, 2, 3, 4 The water signal attenuation, originating from the saturation transfer of the irradiated protons of interest by chemical exchange to the water protons, is detected via the CEST spectrum (also known as a Z‐spectrum).
The CEST technique in high field MRI (HF‐MRI) has generated much interest in the imaging of metabolites.5, 6, 7, 8, 9 Two of the most studied CEST effects are amide‐CEST10, 11, 12 and the relayed nuclear Overhauser enhancement (NOE).13, 14 Amide‐CEST, which is believed to originate from the cytosolic amide metabolites, has found its application in glioma grading,15, 16, 17 cancer therapy monitoring,18, 19 and differentiation between necrosis and tumor regrowth.20 NOE originates from aliphatic and olefinic protons of the cellular mobile macromolecule effect and has been reported to be linked to tissue cellularity21 and cellular membrane fluidity.22
The CEST contrast is unique in providing quantitative metabolite‐specific information. To accurately resolve physiological spatial variations in the CEST contrast it is crucial to minimize contrast variations due to system imperfections. While CEST at HF‐MRI benefits from high SNR, CNR, and chemical shift dispersion, it suffers from the consequent increased transmit field inhomogeneity. The relatively high sensitivity of the CEST contrast to B 1 inhomogeneity necessitates the development of correction methods, which is essential for the clinical translation of CEST. Previously, Windschuh et al. proposed an interpolation‐based approach to correct Z‐spectra and CEST contrast for B 1 inhomogeneity.23 In this approach, the densely sampled Z‐spectra are acquired at at least two different B 1 levels, and B 1 correction of Z‐spectra and isolated CEST contrast is achieved by spline interpolation of the multiple B 1 data to a B 1 of interest. However, this approach may not be possible in a clinical setting, where the scan time is very limited.
In this work, two methods that require only one CEST dataset at a particular B 1 level and a relative B 1 map as a reference are compared. Both methods rely on fitting the multi‐pool Bloch‐McConnell equations24 to the densely sampled Z‐spectra using a B 1 map as a reference. In the first method, an assumption is made about a linear relationship of CEST effects with B 1. The B 1 correction is achieved by using a linear B 1 correction of the calculated amide and NOE CEST effects. The second method is based on an assumption that the Bloch‐McConnell estimated fit parameters other than B 1 are independent of the actual B 1. The estimated fit parameters and the desired B 1 amplitude are used to recalculate the Z‐spectra followed by the calculation of B 1‐corrected amide and NOE CEST effects. Both approaches were first evaluated in simulated data and subsequently tested in data from healthy human brain.
2. METHODS
2.1. Generation of simulated CEST spectra
Four‐pool (water, amide‐CEST, NOE and MT) Bloch‐McConnell equations were solved numerically25 assuming the following white matter (WM) pool parameters26: (i) water (T 1/T 2 = 1.2 s/40 ms); (ii) amide‐CEST (T 1/T 2 = 1 s/10 ms, exchange rate 50 Hz, pool size ratio 0.13%, chemical shift 3.5 ppm); (iii) NOE (T 1/T 2 = 1 s/0.3 ms, pool size ratio 6%, exchange rate 10 Hz, chemical shift −3.5 ppm); and (iv) MT (T 1/T 2 = 1 s/10 μs, pool size ratio 11%, exchange rate 50 Hz, chemical shift −2.4 ppm). Even though the NOE effect (−3.5 ppm) was shown to be composed of multiple fine structures,13 we chose to approximate it with the single offset due to the use of short pulses with high bandwidth in this work. Due to large insensitivity of simulations to T 1 values of other than water pools, the T 1 of amide‐CEST, NOE and MT was fixed to 1 s, as suggested previously.27 The sequence parameters used in the simulations are the same as in the data acquisition (see later), except for the B 1 level extended up to 1.8 μT (average power). The simulations were based on the assumption that there are only four pools in the system and that the only interactions are with water.
2.2. Data acquisition
In this report, we made a retrospective analysis of the data in Reference 23. In vivo experiments were performed on a 7 T MR whole‐body system (Magnetom; Siemens, Erlangen, Germany) using a Tx/Rx head coil (Tx, one channel; Rx, 24 channels). The CEST protocol was as follows28: saturation consisted of a train of 120, 15 ms Gaussian pulses interleaved with a GR‐spoiler, duty cycle 60%; for readout a single‐shot 2D gradient echo sequence (GRE) was used with GRAPPA acceleration factor 2, T R/T E/FA = 7.4 ms/3.6 ms/10°, matrix 128 × 128, slice thickness 5 mm. Total scan time was 4 min 7 s. Z‐spectra were sampled at 66 frequency offsets distributed unevenly between ±500 ppm (500 ppm offset was used for normalization). The CEST sequence was performed at eight different B 1 levels: 0.14, 0.29, 0.43, 0.50, 0.58, 0.65, 0.72, and 0.80 μT. B 1 level refers to the nominally set, average power of the saturation pulse throughout the paper. B 0 inhomogeneity was corrected using the WASSR method.29 A 2D flip‐angle map was based on a single‐shot GRE sequence: a rectangular preparation pulse (2 ms) with nominal flip angle 90°, T E/T R = 2.42 ms/5000 ms. The transmitter voltage and thus the nominal B 1 values were calibrated on the basis of this flip angle map. A relative map of irradiation amplitude (rB 1(x, y)) was produced by the normalization of this flip‐angle map by the nominal flip angle. The actual irradiation amplitude B 1 in each pixel (x, y) was assigned employing the relative B 1 map rB 1(x, y) by B1(x, y) = rB1(x, y)B1 , nom, where B 1,nom is the nominal B 1 value as chosen in the protocol settings. A T 1‐weighted anatomical image was used to produce white matter (WM) and grey matter (GM) masks in FSL (FMRIB v6.0, UK).
2.3. Fitting Bloch‐McConnell equations to the data
The four (water, amide‐CEST, NOE and MT) and six (water, amide‐CEST, NOE, MT, amine‐CEST23 and NOE*22) pool Bloch‐McConnell equations were used to fit the simulated and the in vivo Z‐spectra, respectively. The data was fitted at a single B 1 level at any given time. Since the saturation duration in the employed sequence is less than water T 1, the saturation duration was taken into account in data fitting.25 The choice of six pools to fit the in vivo Z‐spectra was based on the results of fitting a few test Z‐spectra by incrementing the number of pools and monitoring the goodness‐of‐fit statistics. Increasing the number of pools from four to six reduced the sum of squared errors by 50% (F‐test, p < 0.01). The fitting was done employing a non‐linear least squares constrained optimization algorithm (lsqcurvefit function in MATLAB) and using the pool parameters26, 30, 31, 32, 33 in Table 1. The goodness of fit was examined using Curve Fitting Toolbox™ in MATLAB with the following metrics: (i) the sum of squared errors; (ii) R‐square; (iii) adjusted R‐square; and (iv) root mean squared error.
Table 1.
The parameters used for fitting the Bloch‐McConnell equations to CEST spectra
| Water | Amide‐CEST | NOE (Pool 1) | MT | Amine‐CEST | NOE* (Pool 2) | ||
|---|---|---|---|---|---|---|---|
| T 1 (s) | X 0 | 1.5 | 1 | 1 | 1 | 1 | 1 |
| LB | 1.0 | — | — | — | — | — | |
| UB | 2.5 | — | — | — | — | — | |
| T 2 | X 0 | 50 ms | 10 ms | 0.5 ms | 20 μs | 10 ms | 0.5 ms |
| LB | 20 ms | 0.2 ms | 0.1 ms | 10 μs | 0.2 ms | 0.1 ms | |
| UB | 70 ms | 15 ms | 10 ms | 80 μs | 15 ms | 10 ms | |
| Δω (ppm) | X 0 | 0 | 3.5 | −3.5 | −2.4 | 2.0 | −1.6 |
| LB | −0.1 | 3.0 | −4.0 | −4.0 | 1.5 | −1.8 | |
| UB | 0.1 | 4.0 | −3.0 | −2.0 | 2.5 | −1.4 | |
| M 0 (%) | X 0 | — | 0.1 | 4.5 | 9 | 0.01 | 1 |
| LB | — | 0 | 0 | 0 | 0 | 0 | |
| UB | — | 0.2 | 13.5 | 27 | 0.10 | 10 | |
| k (Hz) | X 0 | — | 50 | 10 | 50 | 1 000 | 10 |
| LB | — | 0 | 0 | 0 | 0 | 0 | |
| UB | — | 600 | 50 | 150 | 10 000 | 50 | |
X 0, LB and UB represent the initial guess and lower and upper bounds, respectively.
The only parameters fixed in the fit were the actual B 1 (Equation (1)) and T 1 (set to unity) for all pools except water.
| (1) |
To correct for the effects of the traditional MT and direct water saturation, the amide‐CEST effect size (contribution to the Z‐spectrum) was quantified by the pool difference method using the inverse metrics34, 35:
| (2) |
where MTRRex,amide is the effect size of the cytosolic amides, M z(Δω, M b) is the signal in the Z‐spectrum at Δω (Δω = 3.5 ppm for amide‐CEST), M 0 is the equilibrium magnetization at the normalization offset Δω = 500 ppm and M b is the amplitude of the amide compartment (M b = 0 and M b = 1 for the system without and with amide‐CEST pool, respectively). (M b = 0) − (M b = 1) gives the amide‐CEST pool, hence the name “pool difference method”. The pool difference method used in this work was based on the inverse metrics approach and hence the reciprocals in Equation (2).
A similar equation applies to the NOE pool (MTRRex,NOE) at Δω = −3.5 ppm. The apparent exchange dependent relaxation (AREX or relaxation compensated MTRRex)34, 35, 36, 37 was not calculated, since the B 1 dependence remains the same for MTRRex and AREX. The strength of a linear relationship between paired data was determined by the Pearson correlation coefficient (R).
2.4. Bloch‐McConnell equation B 1 correction
The workflow of the Bloch‐McConnell equation (BE) B 1 correction algorithm is illustrated in the flowchart (Figure 1). First, the densely sampled Z‐spectra are acquired. Second, multi‐pool BEs are fitted to the spectra to determine T 1 (spin–lattice relaxation time), T 2 (spin–spin relaxation time), Δω (chemical shift with respect to water), M 0 (pool size), and R ex (exchange rate). The only parameters fixed during the fitting process are B 1(actual), since this parameter is known from a B 1 map used as a reference (Equation (1)), and T 1 (fixed to unity) for all pools other than water. Then, the Z‐spectra are recalculated at a nominal B 1 level (B 1 = 100%) using the previously fitted BE parameters. Finally, the B 1‐corrected effect size of amide and NOE is isolated using Equation (2).
Figure 1.
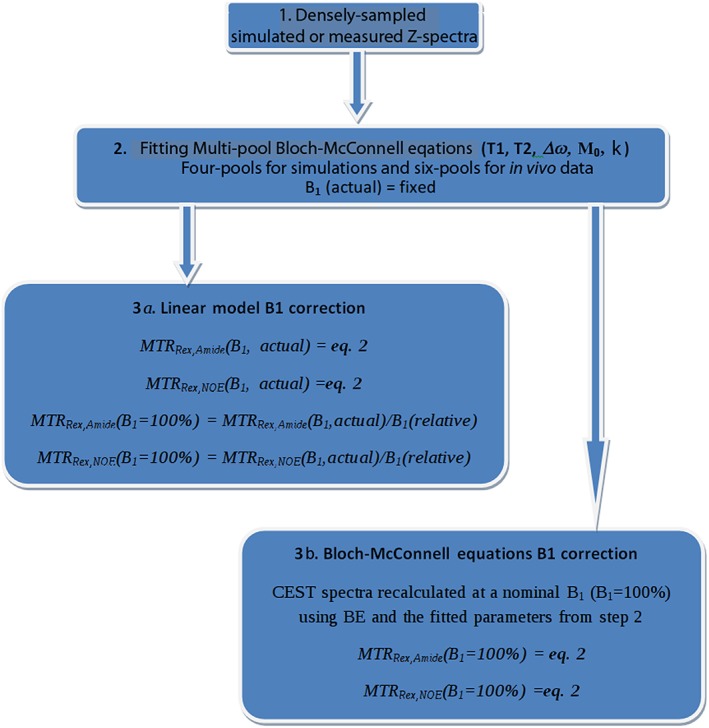
A flowchart representing the steps for implementing a linear model and BE B 1 correction algorithms.
2.5. Linear model B 1 correction
The first and the second steps of the linear B 1 correction algorithm are identical to those of the BE B 1 correction algorithm (Figure 1). In the third step, the effect size of amide and NOE is isolated using Equation (2) and a linear B 1 correction is achieved by division of the isolated effects by the relative B 1.
2.6. Comparison with interpolation‐based B 1 correction
Both B 1 correction algorithms analyzed in this work were compared with the ideal interpolation‐based B 1 correction approach.23
The contrast maps of amide and NOE were generated at all B 1 levels as described in the flowchart (Figure 1, Steps 1 and 2) and using Equation (2) to extract the effect sizes. The B 1‐corrected maps of both amide and NOE effects were produced by voxel‐wise spline interpolation of the corresponding MTRRex maps at all B 1 levels to a B 1 of 0.43 μT using the eight‐point contrast B 1 correction as explained in Reference 23.
3. RESULTS
3.1. Numerical simulations
In Figure 2, the BEs were used to simulate the B 1 dependence of amide‐CEST (MTRRex,amide) and NOE (MTRRex,NOE) effect size. In the low B 1 regime (0.1–0.5 μT), the B 1 dependence of the effects is largely linear: R = 0.99 (p < 0.005) for both MTRRex,amide and MTRRex,NOE. There are noticeable rotation effects for MTRRex,amide at a B 1 above 0.8 μT.38, 39, 40
Figure 2.
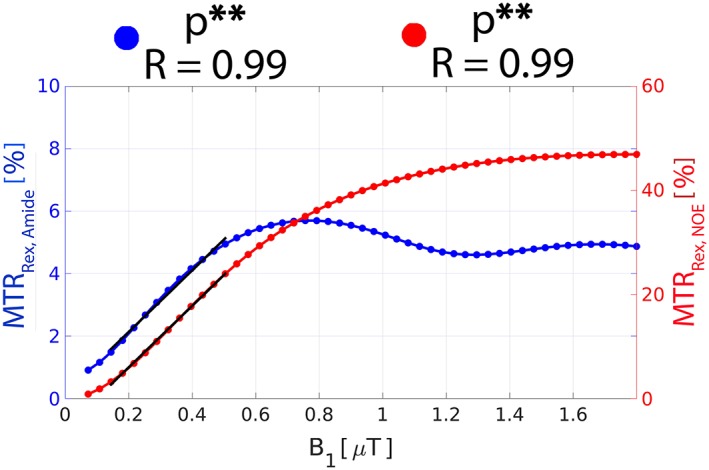
The Bloch‐McConnell equation simulated B 1 dependence of the effect size of MTRRex,amide and MTRRex,NOE in WM. The straight black lines represent the linear regression relation between the corresponding metrics and B 1 in the B 1 range 0.1–0.5 μT. The Pearson correlation coefficient (R) and the corresponding p‐value are provided. **Statistical significance at the level p < 0.005.
The concept of the BE B 1 correction is shown in Figure 3, where a series of Z‐spectra was simulated in the B 1 range 0.1–0.5 μT and subsequently fitted using BEs (Figure 3A). The BE fit parameters from Figure 3A were used to recalculate all of the spectra at a B 1 of 0.43 μT (Figure 3B). The overlap of the BE B 1‐corrected Z‐spectra suggest that BEs may correct the effects of B 1 inhomogeneity. Assuming a nominal B 1 of 0.43 μT, the B 1 range 0.1–0.5 μT used in the simulations (Figure 3A) is expected in the in vivo experiments because of B 1 inhomogeneity (typically 60–120%). The effects of amide‐CEST (MTRRex,amide) and NOE (MTRRex,NOE) isolated from these Z‐spectra are termed uncorrected, i.e. without correction for the B 1 inhomogeneity. In Figure 4, the uncorrected effect size of MTRRex,amide (Figure 4A, blue) and MTRRex,NOE (Figure 4B, blue) is plotted versus B 1, and compared with those yielded by the linear (red) and the BE B 1 correction (black) algorithms. As expected, both MTRRex,amide and MTRRex,NOE uncorrected effects have a strong positive B 1 correlation (R = 0.99 for both effects). The BE B 1 correction over‐ and underestimated MTRRex,amide effect size at low and high B 1, respectively (R = −0.88, black), whereas the linear B 1 correction showed a relatively stable effect size across the whole B 1 range simulated (R = 0.09, red). For MTRRex,NOE, the BE B 1 correction also over‐ and underestimated the effect size at low and high B 1, respectively (R = 0.99, black), whereas the linear B 1 correction reduced the effect of B 1 inhomogeneity (R = 0.95, red). In addition, the BE B 1 correction reversed the sign of the Pearson correlation coefficient due to the over‐ and under‐compensation at low and high B 1, respectively.
Figure 3.
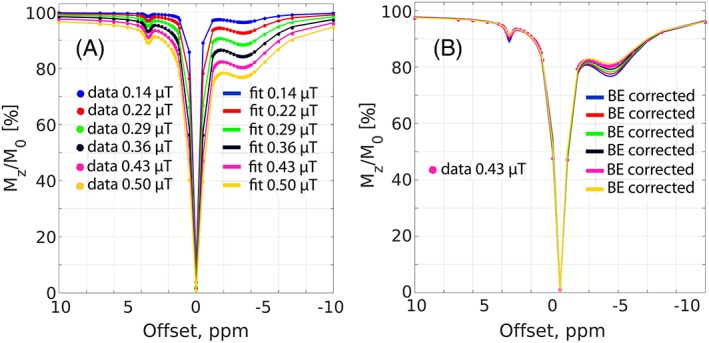
A, The four‐pool Bloch‐McConnell equation simulated spectra (colored markers) at various B 1 levels and their corresponding four‐pool Bloch‐McConnell fits (colored solid lines). B, Same as A for the colored markers, but the colored solid lines represent BE‐corrected spectra recalculated at a B 1 of 0.43 μT (assumed to be nominal B 1 level) using the corresponding fitting parameters from A. A Gaussian noise of 1% (of the signal at 500 ppm) was added to the simulated data.
Figure 4.

A, The comparison of uncorrected (isolated from Figure 3A), the linear model B 1‐corrected (isolated from Figure 3A with the subsequent linear B 1 correction), and the BE B 1‐corrected (isolated from Figure 3B) MTRRex,amide effect size as a function of B 1. B, The same as A but for MTRRex,NOE effect size. For the linear B 1 correction, a B 1 of 0.43 μT was assumed to be nominal B 1 (100%). All other B 1 levels were translated to percentages accordingly. The straight colored lines represent the linear regression relation between the corresponding metrics and B 1. The Pearson correlation coefficient (R) is shown in each subfigure.
3.2. Experimental results
The experimentally derived B 1 dependence of MTRRex,amide and MTRRex,NOE is plotted in Figure 5. As predicted in the simulations (Figure 2), both effects are linear with B 1 in the range 0.1–0.5 μT (R = 0.97 and R = 0.98 for MTRRex,amide and MTRRex,NOE, respectively), after which the effects start to level off. A nominal B 1 level of 0.43 μT was chosen to compare the performance of the linear model and the BE B 1 correction algorithms, because it is still in the linear B 1 regime and yields a good effect size of both of MTRRex,amide and MTRRex,NOE. At this power level, the effect size of amide and NOE is reduced by 15% and 10%, respectively, relative to their corresponding maxima. In Figure 6, the correction of transmit field inhomogeneity effects by BEs is demonstrated using the experimental in vivo data. The CEST spectra from white matter (Figure 6A) at four power levels, 0.14 μT, 0.29 μT, 0.43 μT, and 0.50 μT, were fitted with BEs (Figure 6B) and subsequently recalculated at a B 1 of 0.43 μT (Figure 6C), resulting in the overlap of BE B 1‐corrected spectra.
Figure 5.
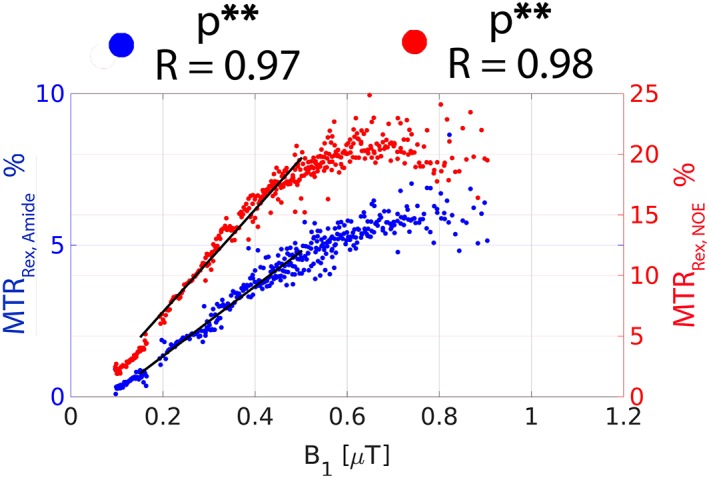
The experimentally derived plots of MTRRex,amide and MTRRex,NOE as a function of the actual B 1 values in WM. The traces were obtained by segmenting the relative B 1 map (Figure 7A) into the different regions between 50% and 150% in steps of 1% and calculating the corresponding MTRRex,amide and MTRRex,NOE contrast resulting from all available CEST datasets. The straight black lines represent the linear regression relation between the corresponding metrics and B 1 in the B 1 range 0.1–0.5 μT. The Pearson correlation coefficient (R) and the corresponding p‐value are provided. **Statistical significance at the level p < 0.005.
Figure 6.
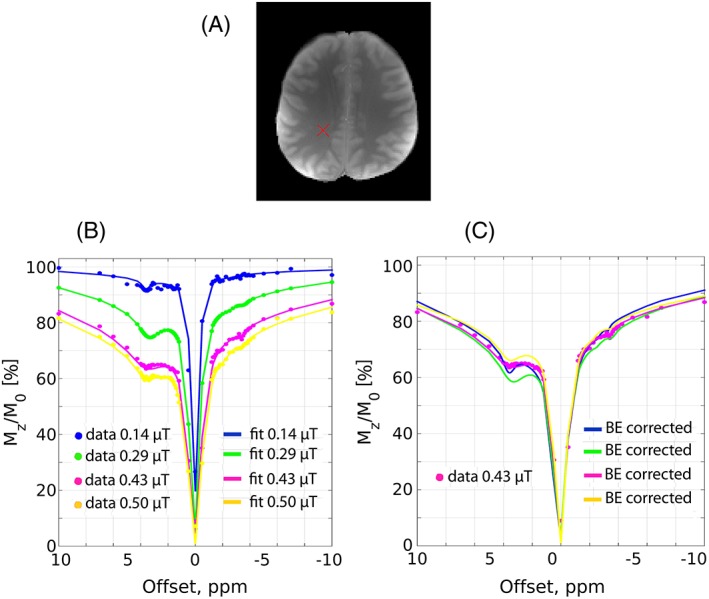
A, A CEST image of the healthy human brain with the cross marking the origin of the CEST spectra shown in B and C. B, The in vivo CEST spectra (colored markers) at various B 1 levels and their corresponding six‐pool Bloch‐McConnell fits (colored solid lines). C, Same as B for the colored markers, but the colored solid lines represent BE‐corrected spectra recalculated at a B 1 of 0.43 μT (assumed to be nominal B 1 level) using the corresponding fitting parameters from B.
As expected from the simulations (Figure 2) and the experiments (Figure 5), the visual inspection reveals a strong correlation of uncorrected maps of MTRRex,amide and MTRRex,NOE (Figure 7B) with the relative B 1 map (Figure 7A): a high signal in the center and low at the sides. The linear B 1 correction appears to alleviate the issue of B 1 inhomogeneity effectively and create a homogeneous contrast for both MTRRex,amide and MTRRex,NOE, whereas the BE B 1 correction results in the over‐ and under‐correction of B 1 inhomogeneity effects at low and high power, respectively. Interestingly, both the linear model and the interpolation produced contrast maps of similar quality for both MTRRex,amide and MTRRex,NOE.
Figure 7.
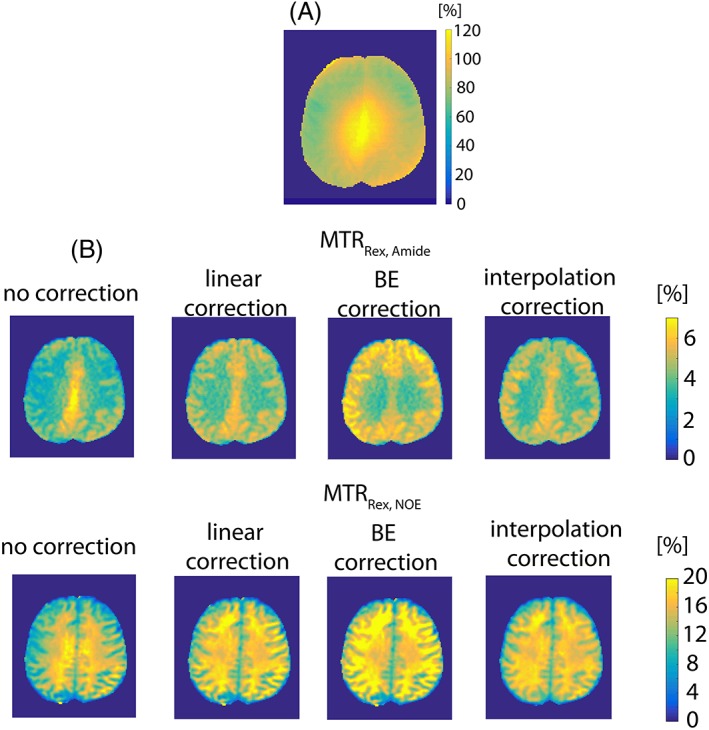
A, A relative B 1 map. B, Comparison of the experimentally derived uncorrected, the linear model B 1‐corrected, the BE B 1‐corrected and the interpolation‐based B 1‐corrected contrast for MTRRex,amide (top row) and MTRRex,NOE (bottom row).
A graphical representation of the contrast distribution is another way to compare the performance of the linear model and the BE B 1‐correction approaches. When compared with the uncorrected contrast, the linear B 1 correction effectively reduced the data dispersion (reflected in the box and whiskers above each distribution) for both MTRRex,amide (Figure 8A,B) and MTRRex,NOE (Figure 8C,D). Both the linear and the interpolation B 1 corrections seem to produce similar contrast distributions. The BE B 1 correction algorithm clearly over‐corrected data, resulting in a very broad distribution, which can also be seen by visual inspection of the images in Figure 7B.
Figure 8.
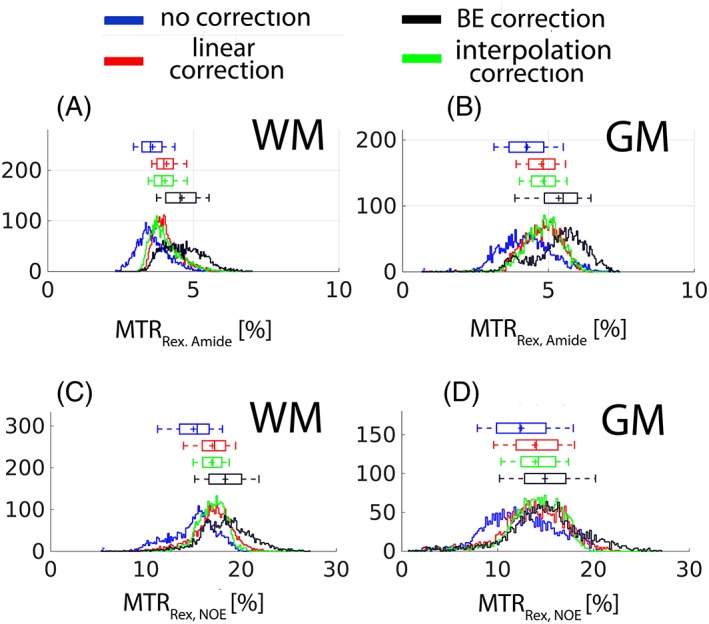
The histograms of the images shown in Figure 7B. A,B, WM and GM, respectively, for MTRRex,amide. C,D, WM and GM, respectively, for MTRRex,NOE. The box and whiskers above each histogram contain values of 25–75% and 9–91%, respectively.
As expected, a strong correlation of the uncorrected contrast MTRRex,amide (Figure 9A,B) and MTRRex,NOE (Figure 9C,D) with B 1 is evident in Figure 9. For example, the correlation coefficient (R) of the uncorrected MTRRex,amide (Figure 9A) and MTRRex,NOE (Figure 9C) was found to be 0.65 in WM. The linear B 1 model virtually nullified the correlation by reducing the correlation coefficients to −0.04 (Figure 9A) and 0.01 (Figure 9C) for MTRRex,amide and MTRRex,NOE, respectively. In line with the simulations in Figure 4 and the experimental results shown in Figure 7B, Figure 8 and Figure 9, the BE B 1 correction algorithm resulted in over‐ and under‐correction at low and high B 1, respectively.
Figure 9.
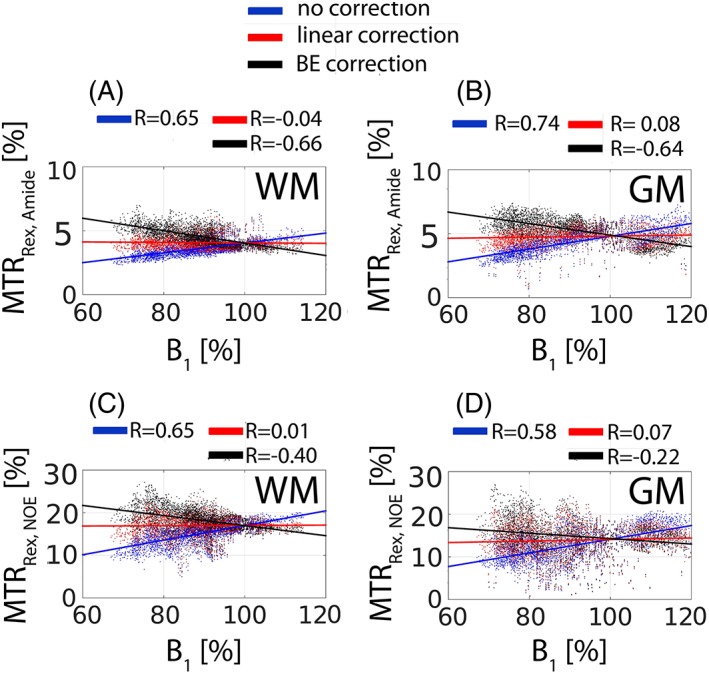
The voxel‐wise correlation of the image contrast (Figure 7B) with the relative B 1 map (Figure 7A). A,B, WM and GM, respectively, for MTRRex,amide. C,D, WM and GM, respectively, for MTRRex,NOE. The linear colored lines represent the linear regression. The Pearson correlation coefficient (R) is shown in each subfigure.
4. DISCUSSION
In this work, we compared two algorithms for B 1 correction of amide‐CEST (MTRRex,amide) and NOE (MTRRex,NOE) effects at 7 T. Both methods rely on fitting the multi‐pool BEs to densely sampled CEST spectra to extract the effects. The first algorithm is based on a simple linear model B 1 correction of the isolated effects. The second algorithm uses the fit parameters to recalculate the Z‐spectra at a B 1 of interest followed by extraction of the B 1‐corrected effects. Both algorithms were compared in the BE simulated and experimental in vivo data of the brain of a healthy volunteer. In the BE simulated data, a simple linear model appeared to be more effective in mitigating B 1 inhomogeneity effects. In line with the simulations, the linear B 1 correction outperformed the BE B 1 correction algorithm in the experimental data obtained in the healthy human brain. The linear B 1 correction generated homogeneous image contrast for both MTRRex,amide and MTRRex,NOE and resulted in almost zero correlation of the effects with B 1, whereas the BE B 1 correction algorithm greatly overcompensated the areas with low B 1, thereby increasing the contrast dispersion.
4.1. Numerical simulations
The four‐pool BE simulations suggest a linear B 1 dependence of MTRRex,amide (R = 0.99, p < 0.005) and MTRRex,NOE (R = 0.99, p < 0.005) in the low B 1 range 0.1–0.5 μT (Figure 2). This opens up the possibility of a simple linear correction of B 1 inhomogeneity of both effects in this low B 1 regime. The MTRRex,amide rotation effects38, 39, 40 may pose a challenge when making B 1 corrections at higher B 1 levels.
The perfectly fitted simulated spectra (Figure 3A) and the visual inspection of the overlapping BE B 1‐corrected CEST spectra (Figure 3B) suggest that fixing only one B 1 parameter in the BEs and allowing the rest to vary within reasonable constraints is sufficient to fit and correct the CEST spectra for B 1 inhomogeneity in this low B 1 range, 0.1–0.5 μT. However, care must be taken since the similarity between the BE B 1‐corrected spectra does not guarantee that they contain similar CEST features, i.e. MTRRex,amide and MTRRex,NOE, which are of interest and should be isolated from the spectra. Therefore, for the fair comparison of both B 1 correction algorithms, we chose to compare them in terms of the B 1‐corrected MTRRex,amide and MTRRex,NOE effects.
The BEs incorporate the effect of chemical exchange and are known to describe the exchange‐mediated processes precisely.24 However, many parameters are correlated, e.g. T 2 and k, k and M 0,41 which makes it extremely difficult to determine those unambiguously from fitting a single CEST spectrum at one power level. This uncertainty propagates further when recalculating the spectra at a nominal B 1 (B 1 = 100%) and extracting the B 1‐corrected contrast, since R ex has an effect on the contrast B 1 sensitivity.42 The over‐ and under‐correction of MTRRex,amide and MTRRex,NOE‐contrast by the BE B 1 correction algorithm at low and high B 1 levels, respectively (Figure 4A,B, respectively), can be attributed to the parameter correlation. The better performance of the linear B 1 correction can be explained by the absence of an extra step involving the Bloch equation numerical calculations. In addition, a linear relation of MTRRex,amide and MTRRex,NOE with B 1 was predicted in the simulations (Figure 2).
The simulation results should be treated with caution, since an assumption was made on the initial pool parameters. In addition, there is no agreement in the literature on the number of pools and the simulation parameters.26, 30, 31, 32, 33
4.2. Experimental results
Fitting in vivo CEST spectra using BEs is a challenge since the exact number of pools is unknown beforehand. In this work, we chose to use six‐pool BEs to approximate the in vivo complexity. The strong positive linear relationships of MTRRex,amide (R = 0.97, p < 0.005) and MTRRex,NOE (R = 0.98, p < 0.005) with B 1 in the range 0.1–0.5 μT (Figure 5) lead us to hypothesize that a simple linear B 1 correction may be sufficient in vivo in this B 1 range. The fact that both the simulations (Figure 2) and the experiments (Figure 5) showed a linear relation of MTRRex,amide and MTRRex,NOE with B 1 in the low B 1 regime (0.1–0.5 μT) suggests that the simulation parameters chosen in this study were within the acceptable range. The linear correction in vivo in this linear B 1 regime comes at the cost of a small reduction in the extracted effect size compared with that obtained at a B 1 level beyond the linear regime. The data dispersion in contrast of MTRRex,amide and MTRRex,NOE at high B 1 in Figure 5 may be associated with the presence of labile protons with a range of exchange rates as would be expected in vivo as opposed to the constants used in the simulated data. The higher B 1 increases sequence sensitivity to the metabolites bearing labile protons with faster exchange rates. In addition, the results were averaged across small ROIs, which may have different pool parameters. Six pools were sufficient to fit the BEs to the WM (Figure 6A) in vivo CEST spectra (Figure 6B) in the low B 1 regime and the overlap of the BE B 1‐corrected (recalculated to a nominal B 1 of 0.43 μT) CEST spectra (Figure 6C) suggest that multi‐pool BEs may alleviate the issue of transmit field inhomogeneity.
The interpolation B 1 correction method23 can be considered an ideal B 1 correction approach due to its applicability to any in vivo system at any B 1 level. Therefore, all contrast maps generated, uncorrected, linearly and BE B 1 corrected, were compared with those produced by the interpolation (Figure 7B). Only the linearly B 1‐corrected maps of both MTRRex,amide and MTRRex,NOE effects resemble those generated by the interpolation in terms of the image quality and the effect size, which further validates our assumption of a linear B 1 correction in the low B 1 regime (Figure 8 and Figure 9). For more detailed analysis of the interpolation B 1 correction approach, e.g. number of B 1 levels, image quality, etc., the interested reader is referred to the original work by Windschuh et al.23 However, the interpolation method always requires multiple acquisitions with varying B 1 levels; a more elegant approach using only a single acquisition would of course be favorable. The authors also compared the interpolation B 1 correction with the linear correction. For the comparison, the authors assumed a linear dependence of CEST effects up to a B 1 of 0.65 μT. However, a linear model is no longer valid at this high power (Figure 5), and so the authors concluded that at least two B 1 levels were necessary for B 1 correction. Yet, we show that a small compromise in the effect size of amide (15%) and NOE (10%), caused by reduced B 1 level to be in the linear regime, leads to a simple B 1 correction method.
The data dispersion and the contrast over‐ and under‐correction by the BE B 1‐correction algorithm are clearly noticeable when comparing the interpolation and the BE B 1‐corrected maps (Figure 7B), the histogram (Figure 8), and the linear regression analysis (Figure 9). We attribute this to the correlation of the fitted parameters. A total of 22 parameters were fitted to the in vivo data and many of the parameters are highly correlated, i.e. have the same effect on CEST spectra appearance. This great number of degrees of freedom, along with the fact that many of the Bloch‐McConnell estimated fit parameters are not independent of the actual B 1, may cause an unpredictable system behavior when recalculating CEST spectra at a B 1 of 100% using the non‐linear system of BEs to describe a simple linear relationship. The following fit parameters were found to have a significant correlation (R) with B 1: water T 1 (−0.20), water T 2 (0.29), amide T 2 (−0.35), NOE k (−0.22), MT k (−0.37), MT T 2 (−0.31), amine k (−0.19), and NOE* k (−0.20). While the performance of the algorithm may be further improved by measuring and fixing other parameters, e.g. exchange rate and T 2, this would make this method highly inefficient since the clinical scan time is very limited. Fixing water T 1, however, did not improve the performance of the BE B 1‐correction algorithm. In this manuscript, the strong linear correlation between M 0 (concentration) and k (exchange rate), which is difficult to decouple,41 has been exploited to our advantage. For the same effect size (amide or NOE) a low fitted M 0 will be compensated by a high fitted k and vice versa. The B 1 correction algorithms in this work apply to the effect size (a product of M 0 and k), and so the individual parameters are less relevant as long as the BEs fit the original data.
Despite the fact that the linear B 1 correction algorithm was shown only on healthy brain, it is expected to be applicable to pathological tissue as well. Abnormally high water T 1 expected in tumors will scale the CEST effect,34, 35 but the linear B 1 dependence of amide‐CEST and NOE effects at low power levels will not change with water T 1 (Supporting Information SI1, Figure S1). The same is true for different CEST saturation parameters, e.g. saturation duration and duty cycle, as long as the average power, which takes account of the CEST saturation parameters,43 is low (0.1–0.5 μT). A change in water T 1 and CEST saturation parameters may, however, cause a variation in amide‐CEST and NOE signal losses using the linear assumption when compared with measuring the effects at optimal B 1 levels.
In this work, we opted for the use of the multi‐pool BE to extract amide and NOE features from CEST data as it is the only approach that intrinsically incorporates the sequence parameters, e.g. B 1 and other CEST saturation prepulse parameters, and the physiological parameters, e.g. metabolite concentration and pH‐dependent exchange rate of labile protons with water. Yet, we expect the linear B 1 correction to be applicable to the other methods used for amide and NOE isolation such as the three point method44, the Lorentzian difference method,13, 45 and multiple Lorentzian fitting23, 46.
5. LIMITATIONS
The B 1 correction algorithms analyzed in this work are based on the multi‐pool Bloch‐McConnell equation fitting of densely sampled CEST spectra. An assumption is made as to the number of pools in the system, which is unknown a priori. This may require a test fit of the Bloch‐McConnell equations to a sample spectrum with an increasing number of pools. To determine the minimum number of pools necessary to describe the in vivo system of interest, the fit precision should be monitored by checking the sum of the squares of the residuals or any other appropriate measure.
6. CONCLUSIONS
In this work, we compared two approaches to the transmit field inhomogeneity correction of the relaxation compensated amide‐CEST and NOE effects. Both methods were compared in simulated and in vivo brain data obtained in a healthy human volunteer. A simple linear model for B 1 correction outperformed a B 1 correction algorithm based on the Bloch‐McConnell equations at the low power levels (0.1–0.5 μT). This was demonstrated by the improved image quality, reduced data dispersion and virtually nullified correlation of the CEST contrast with B 1.
Supporting information
Sup. Figure S1. The four‐pool Bloch‐McConnell equation simulated B1 dependence of the effect size of (a) MTRRex,Amide and (b) MTRRex,NOE at various water T1 relaxation times.
Sup. Figure S2. The experimentally derived plots of the three‐point method quantified MTRRex,Amide and MTRRex,NOE as a function of the actual B1 values in WM. The traces were obtained by segmenting the relative B1 map into the different regions between 50% and 150% in the steps of 1% and calculating the corresponding MTRRex,Amide and MTRRex,NOE contrast resulting from all available CEST datasets. The straight black lines represent the linear regression relation between the corresponding metrics and B1 in the B1 range 0.1–0.5 μT. The Pearson's correlation coefficient (R) and the corresponding p‐value are provided. ** represents statistical significance at the level p < 0.005.
Sup. Figure S3. The experimentally derived plots of the multiple Lorentzian fitting method quantified MTRRex,Amide and MTRRex,NOE as a function of the actual B1 values in WM. The traces were obtained by segmenting the relative B1 map into the different regions between 50% and 150% in the steps of 1% and calculating the corresponding MTRRex,Amide and MTRRex,NOE contrast resulting from all available CEST datasets. The straight black lines represent the linear regression relation between the corresponding metrics and B1 in the B1 range 0.1–0.5 μT. The Pearson's correlation coefficient (R) and the corresponding p‐value are provided. ** represents statistical significance at the level p < 0.005.
ACKNOWLEDGEMENTS
The financial support of the European Commission under FP7 Marie Curie Actions (FP7‐PEOPLE‐2012‐ITN‐316716) is gratefully acknowledged.
Khlebnikov V, Windschuh J, Siero JCW, et al. On the transmit field inhomogeneity correction of relaxation‐compensated amide and NOE CEST effects at 7 T. NMR in Biomedicine. 2017;30:e3687 https://doi.org/10.1002/nbm.3687
REFERENCES
- 1. Sherry AD, Woods M. Chemical exchange saturation transfer contrast agents for magnetic resonance imaging. Annu Rev Biomed Eng. 2008;10:391–411. [DOI] [PMC free article] [PubMed] [Google Scholar]
- 2. van Zijl PCM, Yadav NN. Chemical exchange saturation transfer (CEST): what is in a name and what isn't? Magn Reson Med. 2011;65(4):927–948. [DOI] [PMC free article] [PubMed] [Google Scholar]
- 3. Zaiss M, Bachert P. Chemical exchange saturation transfer (CEST) and MR Z‐spectroscopy in vivo: a review of theoretical approaches and methods. Phys Med Biol. 2013;58(22):R221–R269. [DOI] [PubMed] [Google Scholar]
- 4. Vinogradov E, Sherry AD, Lenkinski RE. CEST: from basic principles to applications, challenges and opportunities. J Magn Reson. 2013;229:155–172. [DOI] [PMC free article] [PubMed] [Google Scholar]
- 5. Cai K, Haris M, Singh A, et al. Magnetic resonance imaging of glutamate. Nat Med. 2012;18(2):302–306. [DOI] [PMC free article] [PubMed] [Google Scholar]
- 6. Walker‐Samuel S, Ramasawmy R, Torrealdea F, et al. In vivo imaging of glucose uptake and metabolism in tumors. Nat Med. 2013;19(8):1067–1072. [DOI] [PMC free article] [PubMed] [Google Scholar]
- 7. van Zijl PC, Jones CK, Ren J, Malloy CR, Sherry AD. MRI detection of glycogen in vivo by using chemical exchange saturation transfer imaging (glycoCEST). Proc Natl Acad Sci U S A. 2007;104(11):4359–4364. [DOI] [PMC free article] [PubMed] [Google Scholar]
- 8. Haris M, Cai K, Singh A, Hariharan H, Reddy R. In vivo mapping of brain myo‐inositol. Neuroimage. 2011;54(3):2079–2085. [DOI] [PMC free article] [PubMed] [Google Scholar]
- 9. Ling W, Regatte RR, Navon G, Jerschow A. Assessment of glycosaminoglycan concentration in vivo by chemical exchange‐dependent saturation transfer (gagCEST). Proc Natl Acad Sci U S A. 2008;105(7):2266–2270. [DOI] [PMC free article] [PubMed] [Google Scholar]
- 10. Zhou J, Lal B, Wilson DA, Laterra J, van Zijl PC. Amide proton transfer (APT) contrast for imaging of brain tumors. Magn Reson Med. 2003;50(6):1120–1126. [DOI] [PubMed] [Google Scholar]
- 11. Jones CK, Schlosser MJ, van Zijl PCM, Pomper MG, Golay X, Zhou J. Amide proton transfer imaging of human brain tumors at 3 T. Magn Reson Med. 2006;56(3):585–592. [DOI] [PubMed] [Google Scholar]
- 12. Wen Z, Hu S, Huang F, et al. MR imaging of high‐grade brain tumors using endogenous protein and peptide‐based contrast. Neuroimage. 2010;51(2):616–622. [DOI] [PMC free article] [PubMed] [Google Scholar]
- 13. Jones CK, Huang A, Xu J, et al. Nuclear Overhauser enhancement (NOE) imaging in the human brain at 7 T. Neuroimage. 2013;77:114–124. [DOI] [PMC free article] [PubMed] [Google Scholar]
- 14. Xu X, Yadav NN, Zeng H, et al. Magnetization transfer contrast‐suppressed imaging of amide proton transfer and relayed nuclear overhauser enhancement chemical exchange saturation transfer effects in the human brain at 7 T. Magn Reson Med. 2016;75(1):88–96. [DOI] [PMC free article] [PubMed] [Google Scholar]
- 15. Zhou J, Blakeley JO, Hua J, et al. Practical data acquisition method for human brain tumor amide proton transfer (APT) imaging. Magn Reson Med. 2008;60(4):842–849. [DOI] [PMC free article] [PubMed] [Google Scholar]
- 16. Togao O, Yoshiura T, Keupp J, et al. Amide proton transfer imaging of adult diffuse gliomas: correlation with histopathological grades. Neuro Oncol. 2014;16(3):441–448. [DOI] [PMC free article] [PubMed] [Google Scholar]
- 17. Sakata A, Okada T, Yamamoto A, et al. Grading glial tumors with amide proton transfer MR imaging: different analytical approaches. J Neurooncol. 2015;122(2):339–348. [DOI] [PubMed] [Google Scholar]
- 18. Dula AN, Arlinghaus LR, Dortch RD, et al. Amide proton transfer imaging of the breast at 3 T: Establishing reproducibility and possible feasibility assessing chemotherapy response. Magn Reson Med. 2013;70(1):216–224. [DOI] [PMC free article] [PubMed] [Google Scholar]
- 19. Sagiyama K, Mashimo T, Togao O, et al. In vivo chemical exchange saturation transfer imaging allows early detection of a therapeutic response in glioblastoma. Proc Natl Acad Sci U S A. 2014;111(12):4542–4547. [DOI] [PMC free article] [PubMed] [Google Scholar]
- 20. Zhou J, Tryggestad E, Wen Z, et al. Differentiation between glioma and radiation necrosis using molecular magnetic resonance imaging of endogenous proteins and peptides. Nat Med. 2010;17(1):130–134. [DOI] [PMC free article] [PubMed] [Google Scholar]
- 21. Paech D, Burth S, Windschuh J, et al. Nuclear Overhauser enhancement imaging of glioblastoma at 7 Tesla: region specific correlation with apparent diffusion coefficient and histology. PLoS One. 2015;10(3):e0121220 [DOI] [PMC free article] [PubMed] [Google Scholar]
- 22. Zhang XY, Xie J, Xu J, Li H, Gore JC, Zu Z. Assessment of membrane fluidity using nuclear Overhauser enhancement mediated magnetization transfer (NOE‐mediated MT). In ISMRM 2015, Toronto, Canada. 1747.
- 23. Windschuh J, Zaiss M, Meissner JEE, et al. Correction of B1‐inhomogeneities for relaxation‐compensated CEST imaging at 7 T. NMR Biomed. 2015;28(5):529–537. [DOI] [PubMed] [Google Scholar]
- 24. McConnell HM. Reaction rates by nuclear magnetic resonance. J Chem Phys. 1958;28(3):430–431. [Google Scholar]
- 25. Woessner DE, Zhang S, Merritt ME, Sherry AD. Numerical solution of the Bloch equations provides insights into the optimum design of PARACEST agents for MRI. Magn Reson Med. 2005;53(4):790–799. [DOI] [PubMed] [Google Scholar]
- 26. Mougin O, Clemence M, Peters A, Pitiot A, Gowland P. High‐resolution imaging of magnetisation transfer and nuclear Overhauser effect in the human visual cortex at 7 T. NMR Biomed. 2013;26(11):1508–1517. [DOI] [PubMed] [Google Scholar]
- 27. Ramani A, Dalton C, Miller DH, Tofts PS, Barker GJ. Precise estimate of fundamental in‐vivo MT parameters in human brain in clinically feasible times. J Magn Reson Imaging. 2002;20(10):721–731. [DOI] [PubMed] [Google Scholar]
- 28. Schmitt B, Zaiß M, Zhou J, Bachert P. Optimization of pulse train presaturation for CEST imaging in clinical scanners. Magn Reson Med. 2011;65:1620–1629. [DOI] [PubMed] [Google Scholar]
- 29. Kim M, Gillen J, Landman BA, Zhou J, van Zijl PC. Water saturation shift referencing (WASSR) for chemical exchange saturation transfer (CEST) experiments. Magn Reson Med. 2009;61(6):1441–1450. [DOI] [PMC free article] [PubMed] [Google Scholar]
- 30. Zhou J, Payen JFF, Wilson DA, Traystman RJ, van Zijl PC. Using the amide proton signals of intracellular proteins and peptides to detect pH effects in MRI. Nat Med. 2003;9(8):1085–1090. [DOI] [PubMed] [Google Scholar]
- 31. Liu G, Ali MM, Yoo B, Griswold MA, Tkach JA, Pagel MD. PARACEST MRI with improved temporal resolution. Magn Reson Med. 2009;61(2):399–408. [DOI] [PMC free article] [PubMed] [Google Scholar]
- 32. Mougin OE, Coxon RC, Pitiot A, Gowland PA. Magnetization transfer phenomenon in the human brain at 7 T. Neuroimage. 2010;49(1):272–281. [DOI] [PubMed] [Google Scholar]
- 33. Liu D, Zhou J, Xue R, Zuo Z, An J, Wang DJJ. Quantitative characterization of nuclear overhauser enhancement and amide proton transfer effects in the human brain at 7 tesla. Magn Reson Med. 2013;70(4):1070–1081. [DOI] [PMC free article] [PubMed] [Google Scholar]
- 34. Zaiss M, Xu J, Goerke S, et al. Inverse Z‐spectrum analysis for spillover‐, MT‐, and T 1‐corrected steady‐state pulsed CEST‐MRI—application to pH‐weighted MRI of acute stroke. NMR Biomed. 2014;27(3):240–252. [DOI] [PMC free article] [PubMed] [Google Scholar]
- 35. Zaiss M, Windschuh J, Paech D, et al. Relaxation‐compensated CEST‐MRI of the human brain at 7 T: unbiased insight into NOE and amide signal changes in human glioblastoma. Neuroimage. 2015;112:180–188. [DOI] [PubMed] [Google Scholar]
- 36. Khlebnikov V, Polders D, Hendrikse J, et al. Amide proton transfer (APT) imaging of brain tumors at 7 T: the role of tissue water T1‐relaxation properties. Magn Reson Med. 2016. doi: 10.1002/mrm.26232 [DOI] [PubMed] [Google Scholar]
- 37. Khlebnikov V, Siero JC, Wijnen J, et al. Is there any difference in amide and NOE CEST effects between white and gray matter at 7 T? J Magn Reson. 2016;272:82–86. [DOI] [PubMed] [Google Scholar]
- 38. Zu Z, Li K, Janve VA, Does MD, Gochberg DF. Optimizing pulsed‐chemical exchange saturation transfer imaging sequences. Magn Reson Med. 2011;66(4):1100–1108. [DOI] [PMC free article] [PubMed] [Google Scholar]
- 39. Zu Z, Janve VA, Li K, Does MD, Gore JC, Gochberg DF. Multi‐angle ratiometric approach to measure chemical exchange in amide proton transfer imaging. Magn Reson Med. 2012;68(3):711–719. [DOI] [PMC free article] [PubMed] [Google Scholar]
- 40. Zu Z, Janve VA, Xu J, Does MD, Gore JC, Gochberg DF. A new method for detecting exchanging amide protons using chemical exchange rotation transfer. Magn Reson Med. 2013;69(3):637–647. [DOI] [PMC free article] [PubMed] [Google Scholar]
- 41. Desmond KL, Stanisz GJ. Understanding quantitative pulsed CEST in the presence of MT. Magn Reson Med. 2012;67(4):979–990. [DOI] [PubMed] [Google Scholar]
- 42. Xu J, Yadav NN, Bar‐Shir A, et al. Variable delay multi‐pulse train for fast chemical exchange saturation transfer and relayed‐nuclear overhauser enhancement MRI. Magn Reson Med. 2014;71(5):1798–1812. [DOI] [PMC free article] [PubMed] [Google Scholar]
- 43. Zu Z, Li K, Janve VA, Does MD, Gochberg DF. Optimizing pulsed‐chemical exchange saturation transfer imaging sequences. Magn Reson Med. 2011;66(4):1100–1108. [DOI] [PMC free article] [PubMed] [Google Scholar]
- 44. Jin T, Wang P, Zong X, Kim SG. MR imaging of the amide‐proton transfer effect and the pH‐insensitive nuclear overhauser effect at 9.4 T. Magn Reson Med. 2013;69(3):760–770. [DOI] [PMC free article] [PubMed] [Google Scholar]
- 45. Jones CK, Polders D, Hua J, et al. In vivo three‐dimensional whole‐brain pulsed steady‐state chemical exchange saturation transfer at 7 T. Magn Reson Med. 2012;67(6):1579–1589. [DOI] [PMC free article] [PubMed] [Google Scholar]
- 46. Desmond KL, Moosvi F, Stanisz GJ. Mapping of amide, amine, and aliphatic peaks in the CEST spectra of murine xenografts at 7 T. Magn Reson Med. 2014;71:1841–1853. [DOI] [PubMed] [Google Scholar]
Associated Data
This section collects any data citations, data availability statements, or supplementary materials included in this article.
Supplementary Materials
Sup. Figure S1. The four‐pool Bloch‐McConnell equation simulated B1 dependence of the effect size of (a) MTRRex,Amide and (b) MTRRex,NOE at various water T1 relaxation times.
Sup. Figure S2. The experimentally derived plots of the three‐point method quantified MTRRex,Amide and MTRRex,NOE as a function of the actual B1 values in WM. The traces were obtained by segmenting the relative B1 map into the different regions between 50% and 150% in the steps of 1% and calculating the corresponding MTRRex,Amide and MTRRex,NOE contrast resulting from all available CEST datasets. The straight black lines represent the linear regression relation between the corresponding metrics and B1 in the B1 range 0.1–0.5 μT. The Pearson's correlation coefficient (R) and the corresponding p‐value are provided. ** represents statistical significance at the level p < 0.005.
Sup. Figure S3. The experimentally derived plots of the multiple Lorentzian fitting method quantified MTRRex,Amide and MTRRex,NOE as a function of the actual B1 values in WM. The traces were obtained by segmenting the relative B1 map into the different regions between 50% and 150% in the steps of 1% and calculating the corresponding MTRRex,Amide and MTRRex,NOE contrast resulting from all available CEST datasets. The straight black lines represent the linear regression relation between the corresponding metrics and B1 in the B1 range 0.1–0.5 μT. The Pearson's correlation coefficient (R) and the corresponding p‐value are provided. ** represents statistical significance at the level p < 0.005.


