

Abstract
Aims/hypothesis
The ability to measure insulin sensitivity across the phenotypic spectrum of diabetes may contribute to a more accurate characterisation of diabetes type. Our goal was to develop and validate an insulin sensitivity (IS) score using the euglycaemic–hyperinsulinaemic clamp in a subset (n=85) of 12– to 19-year-old youths with diabetes participating in the SEARCH study in Colorado, USA.
Methods
Youths with a diagnosis of type 1 (n=60) or type 2 diabetes (n=25) underwent a 3 h clamp to measure glucose disposal rate (GDR, mg kg−1 min−1). Demographic (age, sex, race), clinical (BMI, waist, Tanner stage) and metabolic characteristics (HbA1c, lipids, blood pressure, urine albumin:creatinine) were used to estimate logeIS score via stepwise linear regression on a model- development set (n=53). Estimated IS score was evaluated for reproducibility on two validation sets: youths with diabetes (n=33) and healthy control youths (n=22).
Results
The best model included waist, triacylglycerol (TG) and HbA1c levels (R2=0.74). Diabetes type did not enter the model and there were no significant interactions between diabetes type and other predictors. Estimated IS score correlated well (r=0.65, p<0.0001; r=0.62, p=0.002) with GDR on the two validation sets. Based on this analysis, we propose the following formula to estimate insulin sensitivity in youths with diabetes: logeIS = 4.64725 – 0.02032 (waist, cm) – 0.09779 (HbA1c, %) – 0.00235 (TG, mg/dl;to convert TG values from mmol/l to mg/dl, divide by 0.0113).
Conclusions/interpretation
Insulin sensitivity can be estimated in adolescents with diabetes using routinely collected measures. This score can be applied to epidemiological studies of youths with diabetes to characterise relationships between dimensions of diabetes type.
Keywords: Development, Diabetes, Insulin sensitivity, Validation, Youth
Introduction
Diabetes in youth is caused by a spectrum of varying degrees of beta cell dysfunction and insulin insensitivity [1]. There is good evidence that one variant of diabetes, type 1A, is mediated by immune processes. On the other hand, insulin insensitivity relative to the body’s capacity to secrete insulin is the hallmark of type 2 diabetes. However, reduced insulin sensitivity (IS) relative to healthy controls has also been documented in adults [2] and adolescents [3] with autoimmune diabetes and has recently been proposed as the common basis for both major diabetes types [4]. The ability to measure insulin sensitivity consistently across the phenotypic spectrum of diabetes is therefore important as it may contribute to a more accurate characterisation of diabetes type.
While it is possible to measure insulin sensitivity rigorously in adolescents with diabetes using euglycaemic–hyperinsulinaemic clamp techniques [3, 5], these are labour- and time-intensive and not useful for large epidemiological studies. At the same time, surrogate estimates of insulin sensitivity, HOMA-insulin resistance (HOMA-IR) or the quantitative insulin sensitivity check index (QUICKI) [6], cannot be used in insulin-treated patients and may be inaccurate in youths with type 1 diabetes, as they assume preserved insulin and C-peptide secretion and normal glucose levels [7]. Therefore, the development of estimates of insulin sensitivity that do not rely on preserved insulin secretion and can be used equally reliably in insulin- and non-insulin-treated patients is fundamental to progress in the study of insulin sensitivity in youths with diabetes.
The SEARCH for Diabetes in Youth study undertook a comprehensive evaluation of childhood diabetes [8]. SEARCH has established incidence and prevalence estimates for youths with diabetes by race/ethnicity, age and diabetes type and well-characterised cohorts of youths with diabetes who can participate in future studies [9]. We are extending this effort by developing and validating a surrogate marker of insulin sensitivity, the IS score, using the euglycaemic- hyperinsulinaemic clamp in a subset of SEARCH participants from Colorado, USA. As an example of potential applications of the IS score in large epidemiological studies, we modelled the relationship between residual insulin secretion, assessed by fasting C-peptide levels, and insulin sensitivity, based on the estimated IS score, in the SEARCH population of youths who completed a study visit (n=2,417).
Methods
Overview of SEARCH for Diabetes in Youth
SEARCH is an ongoing US multicentre study that conducts population-based ascertainment of cases of diabetes in youths less than 20 years of age [9]. Self-reported race and ethnicity are collected through an initial survey using the 2000 US Census questions [10]. Eligible youths are invited to a study visit. Fasting blood samples are drawn for measurement of HbA1c, C-peptide and lipids, and a urine sample is collected [8, 11]. Specimens are shipped within 24 h to the central laboratory (Northwest Lipid Metabolism and Diabetes Research Laboratories, Seattle, WA, USA). Samples are also analysed for glutamic acid decarboxylase- 65 (GAD65) and insulinoma-associated-2 (IA2) diabetes autoantibodies (DA) using standardised protocols developed by the National Institute of Diabetes and Digestive and Kidney Diseases (NIDDK) consortia. The units are termed digestive and kidney units (DK units)/ml. The cutoff values for positivity/negativity are 33 DK units/ml for GAD65 and 5 DK units/ml for IA2 [11]. DA status is classified as positive when either GAD65 or IA2 is positive, and negative when both antibodies have negative titres. A brief physical examination includes height, weight and waist circumference, an evaluation for acanthosis nigricans, measurement of systolic and diastolic blood pressure, and self-assessed Tanner stage [8, 12].
Euglycaemic–hyperinsulinaemic clamp study
Youths aged 12–19 years with a clinical diagnosis of type 1 or type 2 diabetes [13] and who participated in SEARCH in Colorado, USA, were recruited into a euglycaemic–hyperinsulinaemic clamp study. There were 255 eligible youths, 208 with a diagnosis of type 1 and 47 with type 2 diabetes, which reflects the typical distribution of diabetes type in Colorado youths [9]. The recruitment target of 80 participants was estimated to provide 80% power to identify individual factors that explain at least 10% of the variance in glucose disposal rate (GDR) and combinations of factors that explain at least 70% of the variance in GDR. By the completion of the study we were able to recruit a total of 85 participants, 60 with type 1 (30% of those eligible) and 25 with type 2 diabetes (53% of those eligible).
Eligibility criteria included: age 12–19 years, HbA1c <12%, serum creatinine <114 μmol/l and a normal haemoglobin and haematocrit. Participants were ineligible if they were unable to discontinue metformin prior to clamp, if they had recently used medicines known to affect insulin sensitivity or if they had an episode of diabetic ketoacidosis or severe illness within the last 60 days. Participants with diabetes were group-matched by type for age, sex and Tanner stage.
A screening visit was conducted 2 weeks prior to the clamp study [3]. Participants had a screening blood sample taken for HbA1c, haemoglobin and haematocrit and a brief medical history. Participants were instructed not to change their dietary and physical activity patterns during the course of the study and were provided with a 3 day fixed- macronutrient weight-maintenance diet (55% carbohydrates, 30% fat, 15% protein content). Participants were asked to monitor blood glucose levels at least four times a day and were called daily to check on blood glucose. Individuals taking metformin had their medication withdrawn 3 days prior to the admission for the euglycaemic clamp.
Participants were admitted to the Pediatric Clinical Research Center (Aurora, CO, USA) in the afternoon. A physical examination was conducted by a paediatric endocrinologist. All data-collection forms and measurements were based on SEARCH protocols. Long-acting insulin and insulin pumps were disconnected. At 20:00 hours, two intravenous catheters were inserted: one was placed in a vein in the antecubital region for administration of insulin and glucose, and the second was placed on the contralateral hand for blood sampling. Blood glucose was monitored and insulin infusion was regulated according to a standardised protocol to stabilise blood glucose levels at 5.5–8.3 mmol/l overnight and at 4.9–6.1 mmol/l between 06:00 hours and 09:00 hours. A fasting blood sample and a urine sample were obtained immediately before the initiation of the clamp study.
The euglycaemic–hyperinsulinaemic clamp was started at 09:00 hours, with a continuous infusion of regular insulin at a constant rate of 80 mU m−2 min−1 for a total of 180 min. During the clamp, the plasma glucose was maintained at 5.5 mmol/l [14, 15] by concomitant intravenous infusion of 20% dextrose, on the basis of plasma glucose determinations every 5 min from a heated hand vein, using a Yellow Springs Instruments (Mountain View, CA, USA) glucose analyser. GDR (M value) was calculated as the mean glucose infusion required to maintain euglycaemia in mg kg−1 min−1, during the final 30 min of clamp. The study was approved by the relevant institutional review boards and was carried out in accordance with the Declaration of Helsinki revised in 2000. All study participants provided informed consent.
Statistical analysis
Development and validation of IS score
Multiple linear regression was used to develop a surrogate measure of insulin sensitivity. The goal was to develop the most explanatory set of variables, i.e. the model explaining the largest amount of variability in the outcome (GDR) in the combined sample of youths with both clinical phenotypes of diabetes.
We used a model-development set of 53 participants (39 with type 1 and 14 with type 2 diabetes) and a validation sample of 32 participants (21 with type 1 and 11 with type 2 diabetes) to assess the reliability of the model through cross-validation. The splitting proportion was based on recommendations that the relative size of the model-development sample be increased when sample sizes are relatively small [16]. Block randomisation was used to assign individuals to the model-development or validation sample within strata defined by group (type 1, type 2 diabetes), age group (12–15 and 16–19 years) and body mass index percentile (≥85th and <85th). We also included an additional sample of 22 non-diabetic healthy control youths, aged 12–19 years, who were part of a different study using the same clamp protocol, to serve as a secondary validation sample.
Although all values of the GDR were positive, some were close to zero and a linear regression model of explanatory variables predicting the value of GDR led to some negative predictions. Therefore, we used a natural log transformation of GDR in the models, causing the antilogs of the predicted values to be positive. We regressed the logeGDR value on demographic characteristics (age, sex, race/ethnicity) and clinical and metabolic markers (Tanner stage, waist circumference, BMI, lipids [total cholesterol, LDL-C, HDL-C, triacylglycerol {TG}], blood pressure, HbA1c, fasting C-peptide, urine albumin:creatinine ratio) measured during the clamp study and available for the larger SEARCH population. To arrive at a regression-based score that best predicts insulin sensitivity we used stepwise linear regression and relied on the Mallows’ Cp statistic and adjusted R2 to choose the best number of predictors to be included in the final model. The significance level for entry and removal of variables was pre-specified at p=0.05. Indicator variables were created to identify group membership (diabetes type) and interaction terms between the indicator and candidate variables were constructed to explore different regression relationships by diabetes type.
We examined whether our best-fitting model met all the assumptions of linear regression. Both the Shapiro-Wilk test (p=0.53) and Kolmogorov-Smirnov test (p>0.15) indicated that the residuals did not deviate significantly from a normal distribution. A plot of residuals against the predicted values of the outcome variable (logeIS) found no evidence that the variance of the residuals was changing across the range of predicted values. Finally, the best-fitting model was cross-validated by regressing measured GDR vs predicted IS in the two validation sets (youths with diabetes and healthy control youths).
Modelling
the relationship between residual insulin secretion and insulin sensitivity in the entire SEARCH population IS score was used to model the relationship between residual insulin secretion, assessed by fasting C-peptide levels, and insulin sensitivity, estimated according to back- transformed IS values, among 2,417 SEARCH study participants newly diagnosed with diabetes in 2002–2006. The relationship of fasting C-peptide and the IS score was explored via orthogonal regression. This method minimises the orthogonal sum of squared errors and is appropriate when error in the x-axis variable is present and/or the determination of which variable is independent is not possible. A two-piece linear spline modelled the data most appropriately, and the parameters of the final model were arrived at using an automated parameter estimation technique in which 5 million initial parameter estimates were compared. Separate analyses were conducted to determine less constrained relationships in fasting C-peptide by antibody status and IS score via smoothed spline regression (SAS proc transreg; sm60 smoothing option).
Results
A total of 85 adolescents with diabetes participated in the clamp study. Compared with the SEARCH population of patients incident in 2002–2006, participants in the clamp study were older (15.4 vs 11.7 years, p<0.001) and had longer diabetes duration (63.5 vs 10.2 months, p<0.001). Reflecting the racial/ethnic composition of the Colorado population, participants with diabetes in the clamp study were non-Hispanic white (70%), Hispanic (25%) and African-American (5%). Nevertheless, the sample participating in the clamp study was otherwise typical of the larger population of youths with type 1 or type 2 diabetes participating in SEARCH [12, 17, 18].
Characteristics of youths with type 1, type 2 or no diabetes (i.e. healthy controls) who had a clamp measurement are presented in Table 1. As youths with type 1 and type 2 diabetes were group-matched for age, sex and Tanner stage, there were no significant differences in these characteristics by diabetes type. As expected, compared with youths with type 1 diabetes, youths with type 2 diabetes were more likely to have: a minority racial/ethnic background; significantly more obesity-related traits; higher fasting C-peptide levels; and lower GDR.
Table 1.
Demographic and clinical characteristics of youths with and without diabetes who had a clamp measurement
| Characteristic | Type 1 diabetes (n=60) | Type 2 diabetes (n=25) | p value | Controls (n=22) |
|---|---|---|---|---|
| Current age (years) | 15.4 (2.2) | 15.7 (2.4) | 0.66 | 15.0 (2.0) |
| Sex (% male) | 43 | 30 | 0.29 | 50 |
| Race (% NHW) | 85 | 25 | <0.0001 | 68 |
| Tanner stage | 4.3 (0.9) | 4.7 (0.7) | 0.11 | 4.5 (0.7) |
| BMI (kg/m2) | 22.6 (4.7) | 34.3 (6.7) | <0.0001 | 26.7 (6.9) |
| Waist (cm) | 76.0 (11.9) | 107.9 (16.0) | <0.0001 | 86.6 (16.3) |
| HbA1c (%) | 8.6 (1.5) | 7.8 (2.2) | 0.07 | 5.0 (0.3) |
| Fasting glucose (mmol/l) | 7.75 (2.48) | 6.76 (2.07) | 0.13 | 4.60 (0.32) |
| TG (mmol/l)a | 0.85 (0.57) | 1.63 (1.31) | <0.0001 | 1.20 (1.35) |
| LDL-C (mmol/l) | 2.17 (0.66) | 2.38 (0.61) | 0.16 | 2.22 (0.66) |
| HDL-C (mmol/l) | 1.20 (0.25) | 1.11 (0.30) | 0.22 | 1.11 (0.24) |
| SBP (mmHg) | 114.9 (12.2) | 121.4 (11.5) | 0.03 | 115.5 (8.5) |
| FCP (nmol/l)a | 0.033 (0.033) | 1.165 (0.965) | <0.0001 | 0.799 (0.366) |
| ACR (μg/mmol)a | 0.72 (0.9) | 1.28 (3.9) | 0.052 | 2.28 (0.7) |
| Treated with insulin (%) | 100 | 20 | <0.0001 | |
| GDR (mg kg−1 min−1) | 8.5 (3.3) | 4.3 (2.2) | <0.0001 | 11.1 (5.1) |
Data are expressed as percentages for categorical variables; means (standard deviations) for normally distributed variables
Medians (interquartile ranges) for skewed variables, where interquartile range represents the difference between the 75th and 25th percentile distribution p values for comparison of youths with type 1 diabetes vs youths with type 2 diabetes: χ 2 tests for categorical variables; t tests for normally distributed continuous variables; analysis of variance on log-transformed variables (for continuous variables that were not normally distributed) ACR, albumin:creatinine ratio; FCP, fasting C-peptide; NHW, non-Hispanic white; SBP, systolic blood pressure
Table 2 presents the best model and the most practical model resulting from stepwise linear regression analyses for prediction of logeGDR on the model-development sample (n=53). The best model, allowing any of the variables in Table 1 to enter, included waist circumference, TG and HbA1c levels (adjusted model R2=0.74). Of note, most of the variance in logeGDR was explained by waist circumference alone, and removal of TG and HbA1c resulted in a similar model, i.e. the most practical model (R2=0.60). Although GDR was substantially lower in youths with type 2 vs type 1 diabetes (4.3 vs 8.5 mg kg−1 min−1, p<0.0001), diabetes type was no longer significantly associated with GDR once waist circumference was included, and did not enter the final model. In addition, similar models were obtained in analyses stratified according to clinical diabetes type, suggesting that the different proportions of youths with type 1 and type 2 diabetes included in these analyses did not influence the selected model. Finally, there were no significant interactions between clinical diabetes type and other predictors of GDR. Older age (p=0.002) and higher body weight (p<0.0001), BMI (p<0.0001) and total cholesterol (p=0.02) were each associated with reduced GDR, but did not enter the model. As 80% of participants in this sample were Tanner stage 3 or higher, pubertal development was only weakly associated with GDR (p=0.05) and did not enter the model.
Table 2.
Best and most practical models: stepwise linear regression analysis for estimation of logeGDR on the development sample (n=53)
| Model | Beta SE | Partial R2 | Model R2 | C (p) | Model-adjusted R2 | p value |
|---|---|---|---|---|---|---|
| Best | 0.74 | |||||
| Waist | −0.02032 0.00221 | 0.6345 | 0.6345 | 20.46 | <0.0001 | |
| HbA1c | −0.09779 0.02398 | 0.0762 | 0.7107 | 7.98 | 0.0002 | |
| TG | −0.00235 0.00078 | 0.0446 | 0.7553 | 1.51 | 0.0044 | |
| Constant | 4.64725 | <0.0001 | ||||
| Most practical | 0.59 | |||||
| Waist | −0.02155 0.00248 | 0.6345 | 0.6345 | 2.00 | <0.0001 | |
| Constant | 3.7339 |
Based on the best model (Table 2), the estimated IS score can be calculated as follows: logeIS = 4.64725–0.02032 (waist, cm) – 0.09779 (HbA1c, %) – 0.00235 (TG, mg/dl; to convert TG values from mmol/l to mg/dl, divide by 0.0113).
Based on the most practical model (Table 2), the estimated IS score can be calculated as follows: logeIS = 3.7339 – 0.02155(waist, cm)
Figure 1 presents the correlation between observed GDR and predicted IS score using the best model on the two validation samples: youths with diabetes (n=32; Fig. 1a); and healthy youths (n=22; Fig. 1b). For both validation sets, the correlation was good (Pearson correlation coefficient r=0.65, p<0.0001 for youths with diabetes, similar in youths with type 1 and type 2 diabetes; r=0.62, p=0.002 for control youths). In addition, the mean difference between measured and predicted IS was not significant (p>0.05). In sensitivity analyses, type 1- and type 2- specific formulae were derived and then validated in the other diabetes type group and in controls, with very consistent results. As clamped insulin levels (type 1,694.5±215.3 pmol/l; type 2, 743.1±236.1 pmol/l; controls, 722.3±229.2 pmol/l) did not differ between the groups, adjusting the glucose infusion rate for this measure did not change the findings.
Fig. 1.
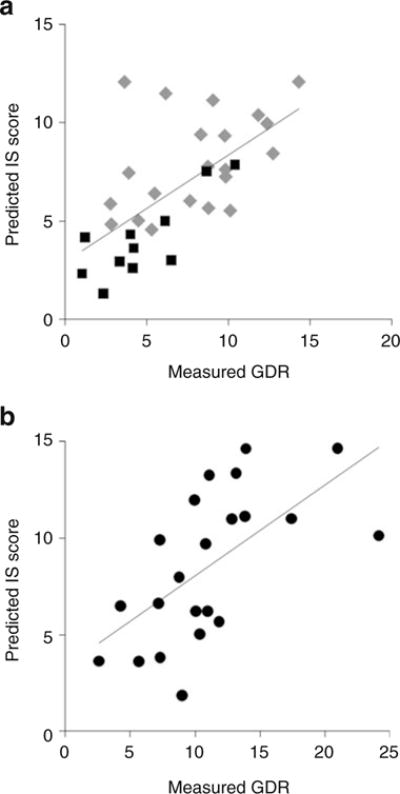
Relationship between measured GDR and estimated IS score in (a) youths with diabetes (n=32), r=0.65, p<0.0001 (grey diamonds, type 1 diabetes; black squares, type 2 diabetes); (b) youths without diabetes (n=22), r=0.62, p=0.002 (black circles)
Figure 2 presents the relationship between fasting C-peptide and predicted IS score using the best model on the entire sample of SEARCH participants (n=2,417). The relationship that best fitted the data was a two-piece linear regression spline with a knot at an IS score of 7.7 and a fasting C-peptide level of 0.14 nmol/l. This spline had a negligible slope (Spearman coefficient r=0.001, p=0.9) for lower fasting C-peptide levels (n=767), with a much steeper negative slope (r=−0.56, p<0.001) for the fasting C-peptide levels above 0.14 nmol/l (n=1,650).
Fig. 2.
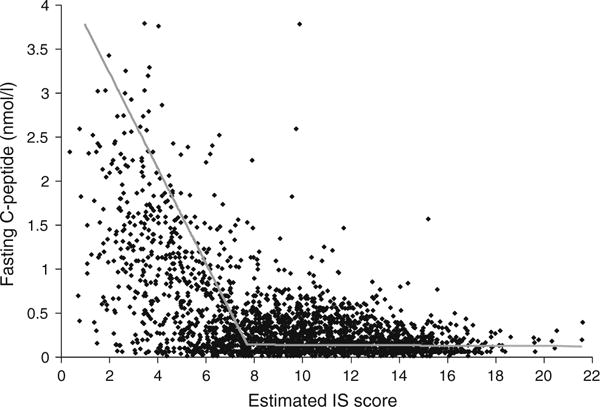
Relationship between fasting C-peptide (FCP, nmol/l) and estimated IS score among all SEARCH participants (n=2,417): two-piece orthogonal regression splines. y1=−0.541x+4.309, y2=−0.00132x+0.151 with a knot at x=7.7 (IS score), y=0.14 (FCP in nmol/l)
There was a difference in the relationship of fasting C- peptide levels to IS score by diabetes antibody status (Fig. 3). Smoothed spline regression curves show the fasting C-peptide averages across the greater part of the insulin sensitivity spectrum, stratified according to DA status. The most noticeable distinction was present at lower IS scores, where C-peptide levels appeared higher in DA- negative vs DA-positive individuals. This was due to the higher prevalence of DA negativity at lower IS scores. For example, in the lowest decile of insulin sensitivity, 75% were antibody negative. However, the inverse association between fasting C-peptide and IS score was present in both DA-positive (r=−0.30, p<0.0001, n=1,114) and DA- negative (r=−0.69, p<0.0001, n=536) participants with fasting C-peptide levels above 0.14 nmol/l. For higher insulin sensitivity values, these differences in fasting C- peptide levels by antibody status decreased to zero, and there was no significant association between residual insulin secretion and insulin sensitivity, regardless of DA status.
Fig. 3.
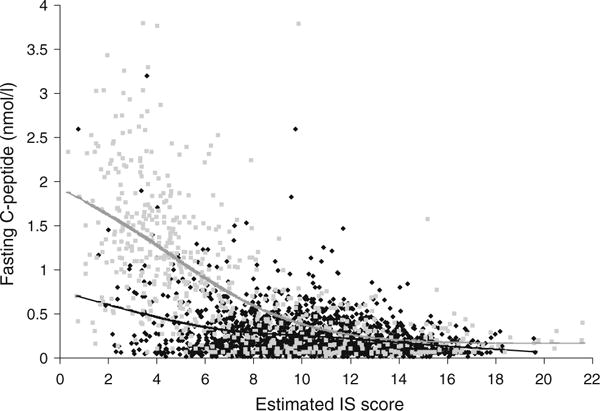
Relationship between fasting C-peptide and insulin sensitivity by DA status among SEARCH participants: smooth spline averages. DA-positive: black (n = 1,780). DA-negative: grey (n=610)
Discussion
Our study provides evidence that insulin sensitivity can be estimated in epidemiological studies of adolescents with diabetes across the entire diabetes spectrum, using an approach based on routinely collected clinical measures including waist circumference, plasma triacylglycerol and HbA1c levels. Using GDR derived from the euglycaemic- hyperinsulinaemic clamp as the accepted best marker of insulin sensitivity, the estimated IS score explained 74% of variance, and yielded an acceptable level of agreement on cross-validation. Moreover, our study provides evidence that assessment of waist circumference may represent a simple practical alternative to estimating insulin sensitivity when fasting laboratory data are not available.
In individuals without diabetes, insulin secretion and sensitivity are linked through a negative feedback loop, whereby beta cells compensate for changes in insulin sensitivity through proportionate inverse changes in insulin secretion [19, 20]. However, this relationship is lost in the presence of progressively or acutely failing beta cells, as is the case in youths with either type 1 or type 2 diabetes. Therefore, the study of insulin sensitivity in youths with diabetes is limited by the inadequacy of current surrogate measures based on glucose and insulin levels [21]. In addition, such indices cannot be used in insulin-treated patients. In an effort to estimate insulin sensitivity non- invasively in adults with childhood-onset type 1 diabetes from Pittsburgh, USA, a regression-based estimated glucose disposal rate score was developed and validated using the hyperinsulinaemic-euglycaemic clamp procedure in 24 adult patients with type 1 diabetes [22]. Using linear regression, the combination of risk factors that yielded the highest adjusted R2 value (0.57, p<0.001) was waist-hip ratio, hypertension and HbA1c [22]. We were not able to explore this score in our population as very few youths had hypertension. The only other such publication was from a study of 202 youths aged 8–18 years with type 1 diabetes in Poland [23]. In this study, clinical factors only explained 34% of the variance in GDR. Consistent with our findings, the prediction equation included waist circumference, triacylglycerols and HbA1c (in addition to Tanner stage and insulin dose). Our study is unique in that it included youths with type 1 and type 2 diabetes, and it controlled for diet and physical activity. In addition, we used a higher insulin dose than the Polish study, which was more likely to adequately suppress hepatic glucose output in pubertal adolescents [24].
In our study, 60% of the variance in GDR was explained by waist circumference alone. As expected, both body weight and BMI were strongly correlated with GDR univariately; however, the model selected waist circumference, a marker of total abdominal fat [25], as a main determinant of insulin sensitivity. This is consistent with data from non-diabetic normal-weight children, where percentage body fat was found to account for 55% of the variance in insulin sensitivity [26]. In a more recent study of multi-ethnic non-diabetic youths, waist circumference was the most significant correlate of insulin sensitivity, independent of race [27]. Elevated triacylglycerol level is a key abnormality in patients in insulin-resistant states, and is independently associated with the development of coronary heart disease [28]. In our model, triacylglycerol levels explained only 4.9% of the remaining variance in estimated insulin sensitivity, possibly marking more specifically the contribution of metabolically active visceral fat [29]. Similarly, HbA1c also had a small, although detectable, effect on estimated insulin sensitivity (8.2% of remaining variance), possibly reflecting the contribution of chronic hyperglycaemia to hepatic glucose output [30]. We found no interaction between clinical diabetes type and waist circumference or triacylglycerol and HbA1c levels on estimated insulin sensitivity, suggesting that the relationship between these predictors and insulin sensitivity is similar across the phenotypic spectrum of diabetes.
When using the IS score to model the relationship between residual insulin secretion and insulin sensitivity in the setting of a large epidemiological study of childhood diabetes, we found no relationship among those lacking substantial insulin secretory capacity (i.e. fasting C-peptide <0.14 nmol/l); however, an inverse relationship was noted among participants with preserved insulin secretion (r=−0.56, p<0.0001). This observation has important implications for the use of fasting C-peptide as a marker of insulin sensitivity for clinical or research purposes. First, it provides evidence that fasting C-peptide levels cannot be used as a surrogate marker of insulin resistance in individuals with severely compromised beta cell function. Second, in individuals with preserved beta cell function, there is an inverse association between fasting C-peptide and estimated insulin sensitivity, without clear evidence of a threshold for insulin resistance. Importantly, these associations seem to be qualitatively similar regardless of DA status, although their magnitude is influenced by the different distribution of fasting C-peptide levels according to DA status: higher fasting C-peptide levels in DA-negative vs DA-positive participants.
There are several limitations to our study. First, the clamp study included a convenience (non-random) sample. However, it included the three most prevalent racial/ethnic groups represented in SEARCH (non-Hispanic white, Hispanic and African-American) and a similar range of diabetes-related characteristics, including obesity, pubertal stage, C-peptide levels and antibody positivity, among others. The size of the sample with clamp measurements is relatively small. However, our study included the largest available sample of youths with type 1 diabetes (n=60) and one of the largest of youths with type 2 diabetes (n=25). Previous studies aimed at developing an index of insulin sensitivity in adults with type 1 diabetes were based on 24 participants [22]. Due to the relative rarity of the condition, other clinical studies including clamp measurements in youths with type 2 diabetes were based on 16–26 participants [31]. Nevertheless, additional validation of the proposed equation in other cohorts of youth with diabetes is warranted. In addition, due to the invasiveness of the clamp measurement, we were not able to include pre-pubertal children. Therefore, the IS score must be used with caution in pre-pubertal children.
An additional limitation is that hepatic glucose production was not measured as use of tracers and longer clamp protocols was not feasible in youths. Therefore, we cannot quantify the contribution of hepatic insulin sensitivity to overall insulin sensitivity measured in this study. Nonetheless, good glucose control and use of a high dose of insulin infusion to suppress hepatic glucose production probably minimised potential differences among study participants resulting from acute effects of hyperglycaemia on insulin sensitivity [24, 32]. Our protocol stopped the use of metformin for 3 days prior to the clamp. As metformin is known to improve insulin sensitivity [33], use of the equation in youths taking metformin may somewhat underestimate their degree of insulin sensitivity, though the primary factors used to predict insulin sensitivity (waist circumference, TG, HbA1c) are not acutely influenced by metformin. Only factors that were measured on the entire SEARCH cohort were considered for the development of the IS score and, thus, it is possible that a better estimate can be developed if additional factors are included. Finally, it is possible that different combinations of factors can be identified to more optimally predict insulin sensitivity in antibody-positive vs antibody-negative, obese vs lean or insulin-treated vs not-insulin-treated youths with diabetes. However, the purpose of this study was to develop an estimate of insulin sensitivity that could be used reliably across the entire phenotypic spectrum of diabetes, rather than only in a selected subgroup of the population. We believe that this equation adequately meets this purpose, and is quite consistent with results from similar studies [22, 23, 26, 27]. Nonetheless, the generalisability of results from a selected subset to the entire population that it is intended to represent will always be an approximation. Because the range of diabetes characteristics included in this study is similar to that in the entire population, we believe that much of the inherent variability across the entire SEARCH population has been represented. Thus, we believe that our approach captures the most relevant physiological relationships that can be useful as markers of insulin sensitivity in larger epidemiological studies.
In conclusion, our study provides evidence that insulin sensitivity can be estimated in adolescents with diabetes using routinely collected clinical measures. The score was used in a large epidemiological study to model the association between residual insulin secretion and insulin sensitivity. The score can be applied to large populations of youths with diabetes to more rigorously characterise relationships between various dimensions of diabetes type.
Acknowledgments
This study was supported by R01 DK059184 (D. Dabelea); K23 RR020038 and JDRF5-2008-291 (K. Nadeau), the Pediatric General Clinical Research Center, the University of Colorado, Denver, CO, USA and the Intramural Research Program of the National Institute of Diabetes and Digestive and Kidney Diseases (C. C. Mason and W. C. Knowler). SEARCH for Diabetes in Youth is funded by the Centers for Disease Control and Prevention (PA number 00097 and DP-05-069), Kaiser Permanente Southern California (U01 DP000246), University of Colorado, Denver, CO, USA (U01 DP000247), Pacific Health Research Institute (U01 DP000245), Children’s Hospital Medical Center (Cincinnati) (U01 DP000248), University of North Carolina at Chapel Hill (U01 DP000254), University of Washington School of Medicine (U01 DP000244) and Wake Forest University School of Medicine (U01 DP000250).
Abbreviations
- DA
Diabetes autoantibodies
- GAD65
Glutamic acid decarboxylase-65
- GDR
Glucose disposal rate
- IA2
Insulinoma-associated-2
- IS
Insulin sensitivity
- TG
Triacylglycerol
Footnotes
Duality of interest The authors declare that there is no duality of interest associated with this manuscript.
Contributor Information
D. Dabelea, Department of Epidemiology, Colorado School of Public Health, University of Colorado Denver, 13001 East 17th Ave, Box B119, Room W3110, Aurora 80045 CO, USA
R. B. D’Agostino, Jr, Department of Biostatistical Sciences, Wake Forest University, School of Medicine, Winston-Salem, NC, USA.
C. C. Mason, Diabetes Epidemiology and Clinical Research Section, National Institute of Diabetes and Digestive and Kidney Diseases, Phoenix, AZ, USA
N. West, Department of Epidemiology, Colorado School of Public Health, University of Colorado Denver, 13001 East 17th Ave, Box B119, Room W3110, Aurora 80045 CO, USA
R. F. Hamman, Department of Epidemiology, Colorado School of Public Health, University of Colorado Denver, 13001 East 17th Ave, Box B119, Room W3110, Aurora 80045 CO, USA
E.J. Mayer-Davis, Department of Nutrition, University of North Carolina, Chapel Hill, NC, USA
D. Maahs, Barbara Davis Center and Department of Pediatrics, University of Colorado Denver, School of Medicine, Aurora, CO, USA
G. Klingensmith, Barbara Davis Center and Department of Pediatrics, University of Colorado Denver, School of Medicine, Aurora, CO, USA
W. C. Knowler, Diabetes Epidemiology and Clinical Research Section, National Institute of Diabetes and Digestive and Kidney Diseases, Phoenix, AZ, USA
K. Nadeau, Barbara Davis Center and Department of Pediatrics, University of Colorado Denver, School of Medicine, Aurora, CO, USA
References
- 1.Gale EA. Declassifying diabetes. Diabetologia. 2006;49:1989–1995. doi: 10.1007/s00125-006-0348-7. [DOI] [PubMed] [Google Scholar]
- 2.Greenbaum CJ. Insulin resistance in type 1 diabetes. Diab Metab Res Rev. 2002;18:192–200. doi: 10.1002/dmrr.291. [DOI] [PubMed] [Google Scholar]
- 3.Nadeau KJ, Regensteiner JG, Bauer TA, et al. Insulin resistance in adolescents with type 1 diabetes and its relationship to cardiovascular function. J Clin Endocrinol Metab. 2009;95:513–521. doi: 10.1210/jc.2009-1756. [DOI] [PMC free article] [PubMed] [Google Scholar]
- 4.Wilkin TJ. The accelerator hypothesis: a review of the evidence for insulin resistance as the basis for type I as well as type II diabetes. Int J Obes Lond. 2009;33:716–726. doi: 10.1038/ijo.2009.97. [DOI] [PubMed] [Google Scholar]
- 5.DeFronzo RA, Gunnarsson R, Bjorkman O, Olsson M, Wahren J. Effects of insulin on peripheral and splanchnic glucose metabolism in noninsulin-dependent (type II) diabetes mellitus. J Clin Invest. 1985;76:149–155. doi: 10.1172/JCI111938. [DOI] [PMC free article] [PubMed] [Google Scholar]
- 6.Yeni-Komshian H, Carantoni M, Abbasi F, Reaven GM. Relationship between several surrogate estimates of insulin resistance and quantification of insulin-mediated glucose disposal in 490 healthy nondiabetic volunteers. Diabetes Care. 2000;23:171–175. doi: 10.2337/diacare.23.2.171. [DOI] [PubMed] [Google Scholar]
- 7.Arslanian SA. Clamp techniques in paediatrics: what have we learned? Horm Res. 2005;64(Suppl 3):16–24. doi: 10.1159/000089313. [DOI] [PubMed] [Google Scholar]
- 8.The SEARCH Study Group. SEARCH for diabetes in youth: a multicenter study of the prevalence, incidence and classification of diabetes mellitus in youth. Controlled Clin Trials. 2004;25:458–471. doi: 10.1016/j.cct.2004.08.002. [DOI] [PubMed] [Google Scholar]
- 9.SEARCH for Diabetes in Youth Writing Group. Dabelea D, Bell RA, D’Agostino RB, Jr, et al. Incidence of diabetes in youth in the United States. JAMA. 2007;297:2716–2724. doi: 10.1001/jama.297.24.2716. [DOI] [PubMed] [Google Scholar]
- 10.Ingram DD, Parker JD, Schenker N, et al. United States Census 2000 population with bridged race categories. Vital Health Stat. 2003;2:21–55. [PubMed] [Google Scholar]
- 11.Bonifacio E, Yu L, Alastair KW, Eisenbarth G, et al. Harmonization of glutamic acid decarboxylase and islet antigen-2 autoantibody assays for National Institute of Diabetes and Digestive and Kidney Diseases Consortia. J Clin Endocrinol Metab. 2010;95:3360–3367. doi: 10.1210/jc.2010-0293. [DOI] [PMC free article] [PubMed] [Google Scholar]
- 12.Bell RA, Mayer-Davis EJ, Beyer JW, et al. Diabetes in nonHispanic white youth: prevalence, incidence, and clinical characteristics: the SEARCH for Diabetes in Youth study. Diabetes Care. 2009;32(Suppl 2):S102–S111. doi: 10.2337/dc09-S202. [DOI] [PMC free article] [PubMed] [Google Scholar]
- 13.The Expert Committee on the Diagnosis and Classification of Diabetes Mellitus. Report of the Expert Committee on the Diagnosis and Classification of Diabetes Mellitus. Diabetes Care. 2002;25(Suppl 1):S5–S20. doi: 10.2337/diacare.26.2007.s5. [DOI] [PubMed] [Google Scholar]
- 14.Bacha F, Saad R, Gungor N, Janosky J, Arslanian SA. Obesity, regional fat distribution, and syndrome X in obese black vs white adolescents: race differential in diabetogenic and atherogenic risk factors. J Clin Endocrinol Metab. 2003;88:2534–2540. doi: 10.1210/jc.2002-021267. [DOI] [PubMed] [Google Scholar]
- 15.Nadeau KJ, Zeitler PS, Bauer TA, et al. Insulin resistance in adolescents with type 2 diabetes is associated with impaired exercise capacity. J Clin Endocrinol Metab. 2009;94:3687–3695. doi: 10.1210/jc.2008-2844. [DOI] [PMC free article] [PubMed] [Google Scholar]
- 16.Kleinbaum DG, Kupper LL, Morganstern H. Epidemiologic research: principles and quantitative methods. Lifetime Learning Publications; Belmont: 1982. [Google Scholar]
- 17.Lawrence JM, Mayer-Davis EJ, Reynolds K, et al. Diabetes in Hispanic American youth: prevalence, incidence, demographics, and clinical characteristics: the SEARCH for Diabetes in Youth Study. Diabetes Care. 2009;32(Suppl 2):S123–S132. doi: 10.2337/dc09-S204. [DOI] [PMC free article] [PubMed] [Google Scholar]
- 18.Mayer-Davis EJ, Beyer J, Bell RA, et al. Diabetes in African American youth: prevalence, incidence, and clinical characteristics: the SEARCH for Diabetes in Youth Study. Diabetes Care. 2009;32(Suppl 2):S112–S122. doi: 10.2337/dc09-S203. [DOI] [PMC free article] [PubMed] [Google Scholar]
- 19.Kahn SE, Prigeon RL, McCulloch DK, et al. Quantification of the relationship between insulin sensitivity and β-cell function in human subjects. Diabetes. 1993;42:1663–1672. doi: 10.2337/diab.42.11.1663. [DOI] [PubMed] [Google Scholar]
- 20.Kahn SE. The relative contributions of insulin resistance and beta-cell dysfunction to the pathophysiology of type 2 diabetes. Diabetologia. 2003;46:3–19. doi: 10.1007/s00125-002-1009-0. [DOI] [PubMed] [Google Scholar]
- 21.Saad R, Gungor N, Arslanian S. Progression from normal glucose tolerance to type 2 diabetes in a young girl: longitudinal changes in insulin sensitivity and secretion assessed by the clamp technique and surrogate estimates. Pediatr Diab. 2005;6:95–99. doi: 10.1111/j.1399-543X.2005.00097.x. [DOI] [PubMed] [Google Scholar]
- 22.Williams KV, Erbey JR, Becker D, Arslanian S, Orchard TJ. Can clinical factors estimate insulin resistance in type 1 diabetes? Diabetes. 2000;49:626–632. doi: 10.2337/diabetes.49.4.626. [DOI] [PubMed] [Google Scholar]
- 23.Szadkowska A, Pietrzak I, Mianowska B, et al. Insulin sensitivity in type 1 diabetic children and adolescents. Diabet Med. 2008;25:282–288. doi: 10.1111/j.1464-5491.2007.02357.x. [DOI] [PubMed] [Google Scholar]
- 24.Lewis GF, Zinman B, Groenewoud Y, Vranic M, Giacca A. Hepatic glucose production is regulated both by direct hepatic and extrahepatic effects of insulin in humans. Diabetes. 1996;45:454–462. doi: 10.2337/diab.45.4.454. [DOI] [PubMed] [Google Scholar]
- 25.Klein S, Allison DB, Heymsfield SB, et al. Waist circumference and cardiometabolic risk: a consensus statement from Shaping America’s Health: Association for Weight Management and Obesity Prevention; NAASO, The Obesity Society; the American Society for Nutrition; and the American Diabetes Association. Am J Clin Nutr. 2007;85:1197–1202. doi: 10.1093/ajcn/85.5.1197. [DOI] [PubMed] [Google Scholar]
- 26.Arslanian S, Suprasongsin C. Insulin sensitivity, lipids, and body composition in childhood: is “syndrome X” present? J Clin Endocrinol Metab. 1996;81:1058–1062. doi: 10.1210/jcem.81.3.8772576. [DOI] [PubMed] [Google Scholar]
- 27.Lee S, Bacha F, Gungor N, Arslanian SA. Waist circumference is an independent predictor of insulin resistance in black and white youths. J Pediatr. 2006;148:188–194. doi: 10.1016/j.jpeds.2005.10.001. [DOI] [PubMed] [Google Scholar]
- 28.Hokanson JE. Hypertriglyceridemia and risk of coronary heart disease. Curr Cardiol Rep. 2002;4:488–493. doi: 10.1007/s11886-002-0112-7. [DOI] [PubMed] [Google Scholar]
- 29.Lemieux I, Pascot A, Couillard C, et al. Hypertriglyceri- demic waist: a marker of the atherogenic metabolic triad (hyper- insulinemia; hyperapolipoprotein B; small, dense LDL) in men? Circulation. 2000;102:179–184. doi: 10.1161/01.cir.102.2.179. [DOI] [PubMed] [Google Scholar]
- 30.Arslanian S, Heil BV, Kalhan SC. Hepatic insulin action in adolescents with insulin-dependent diabetes mellitus: relationship with long-term glycemic control. Metabolism. 1993;42:283–290. doi: 10.1016/0026-0495(93)90075-y. [DOI] [PubMed] [Google Scholar]
- 31.Tfayli H, Bacha F, Gungor N, Arslanian S. Phenotypic type 2 diabetes in obese youth: insulin sensitivity and secretion in islet cell antibody-negative vs -positive patients. Diabetes. 2009;58:738–744. doi: 10.2337/db08-1372. [DOI] [PMC free article] [PubMed] [Google Scholar]
- 32.Vuorinen-Markkola H, Koivisto VA, Yki-Jarvinen H. Mechanisms of hyperglycemia-induced insulin resistance in whole body and skeletal muscle of type I diabetic patients. Diabetes. 1992;41:571–580. doi: 10.2337/diab.41.5.571. [DOI] [PubMed] [Google Scholar]
- 33.McIntyre HD, Ma A, Bird DM, Paterson CA, Ravenscroft PJ, Cameron DP. Metformin increases insulin sensitivity and basal glucose clearance in type 2 (non-insulin dependent) diabetes mellitus. Aust NZ J Med. 1991;21:714–719. doi: 10.1111/j.1445-5994.1991.tb01375.x. [DOI] [PubMed] [Google Scholar]