

Abstract
Amyloid β-protein (Aβ) sequence length variants with varying aggregation propensity coexist in vivo, where coaggregation and cross-catalysis phenomena may affect the aggregation process. Until recently, naturally occurring amyloid β-protein (Aβ) variants were believed to begin at or after the canonical β-secretase cleavage site within the amyloid β-protein precursor. However, N-terminally extended forms of Aβ (NTE-Aβ) were recently discovered and may contribute to Alzheimer's disease. Here, we have used thioflavin T fluorescence to study the aggregation kinetics of Aβ42 variants with N-terminal extensions of 5–40 residues, and transmission electron microscopy to analyze the end states. We find that all variants form amyloid fibrils of similar morphology as Aβ42, but the half-time of aggregation (t1/2) increases exponentially with extension length. Monte Carlo simulations of model peptides suggest that the retardation is due to an underlying general physicochemical effect involving reduced frequency of productive molecular encounters. Indeed, global kinetic analyses reveal that NTE-Aβ42s form fibrils via the same mechanism as Aβ42, but all microscopic rate constants (primary and secondary nucleation, elongation) are reduced for the N-terminally extended variants. Still, Aβ42 and NTE-Aβ42 coaggregate to form mixed fibrils and fibrils of either Aβ42 or NTE-Aβ42 catalyze aggregation of all monomers. NTE-Aβ42 monomers display reduced aggregation rate with all kinds of seeds implying that extended termini interfere with the ability of monomers to nucleate or elongate. Cross-seeding or coaggregation may therefore represent an important contribution in the in vivo formation of assemblies believed to be important in disease.
Graphical abstract

Introduction
An improved understanding of the molecular mechanism underlying amyloid β peptide (Aβ) aggregation and its modulation by intrinsic and extrinsic factors may provide a basis for the development of future treatments and diagnostics of Alzheimer's disease (AD).1,2 Genetic evidence links the amyloid β-protein precursor (APP) to AD pathogenesis, and additional evidence suggests that a proteolytic product of APP, Aβ, is the causal agent.3 The coexistence in vivo of several Aβ sequence length variants with extensions and truncations at both termini, and with varying aggregation propensity, makes it important to determine the influence of each length variation on the aggregation mechanism as well as its effect on other members of the ensemble. Insights into the plethora of phenomena that may occur in complex peptide mixtures, for example, cross-catalysis and coaggregation of different peptides, are a prerequisite for understanding the mechanism of Aβ aggregation in vivo. A first step toward this goal is to find the mechanism by which extensions and truncations hinder or promote aggregation of each variant per se. More intriguing, the next step involves investigations of the interplay between coexisting length variants, and to elucidate conditions promoting cross-catalysis and coaggregation processes.
Production of Aβ is initiated by β-amyloid cleaving enzyme-1 (BACE1), which hydrolyzes the Met671–Asp672 peptide bond of APP. (The amino acid numbering used throughout is for the human sequence of the longest isoform of APP, APP770.) This generates two products: APPsβ (residues 1–671) and C99 (residues 672–770). 4,5 BACE1 also cuts at a second less-favored site 11 residues further C-terminal, producing C89 (residues 682–770) and a slightly longer version of APPsβ (residues 1–681). The C99 and C89 fragments are substrates for γ-secretase, a unique aspartyl protease which cleaves within the transmembrane domains of certain type I membrane proteins.
More than 30 different primary structures of Aβ have been detected in human specimens6–15 including Aβ peptides with N-termini originating at, before, or after the canonical BACE1 cleavage site Asp672, which is numbered Asp1 in Aβ peptides. The first evidence that APP may be proteolyzed at residues other than at the canonical BACE1 and α-secretase (the latter cleaves APP between Gln686 and Lys687, and precludes formation of Aβ) sites came from mass spectrometric analysis of cerebrospinal fluid, which identified 11 peptides with N-termini before Asp672.16 N-Terminally extended Aβ (NTE-Aβ) variants with up to 9 residues extensions have been detected in human plasma7 and even longer variants with extension ≥34 residues have been found in tissue culture studies.12 Importantly, culture medium rich in NTE-Aβ variants blocks long-term potentiation (LTP),6 a cellular correlate of learning and memory, the disruption of which is believed to be relevant to synaptic changes that occur in the early stages of AD.17 Although the precise sequences of the synaptotoxic species and whether their activity is mediated by monomeric or aggregated NTE-Aβ is not yet known, it is clear that the presence of NTEs is compatible with toxic activity.
Full-length APP has to our knowledge not been observed to form amyloid although the highly aggregation prone Aβ segment is embedded in its sequence. The aggregation of Aβ has been studied for almost three decades, but only recently have mechanistic studies been conducted with an aim to find the underlying microscopic steps of the process. Specifically, the aggregation kinetics data for Aβ42 are reconciled with a mechanism including primary nucleation of monomers in solution, secondary nucleation of monomers on fibril surface, and elongation of fibrils by monomer attachment to their ends.18 The secondary nucleation was found to be the dominant route for generation of new aggregates, and in vitro it is the microscopic process responsible for the generation of most of the toxicity.18–21 Comparison of Aβ40 vs Aβ42 reveals the importance of C-terminal identity; for Aβ40, all rate constants are reduced relative to Aβ42, with the largest effect on primary nucleation.22 In a previous study, we found that Aβ40 and Aβ42 form separate fibrils in binary mixtures23 and do not cross-catalyze the aggregation of each other, which may be related to their local packing differences yielding distinct fibril structures.23,24 While certain N-terminal truncations have been observed to accelerate Aβ aggregation,25–27 the effects of N-terminal extensions on the aggregation propensity and mechanism have not been quantified.
Here we have studied the effect of N-terminal sequence extensions on the rate of amyloid formation by experiment and simulation. The fibril formation kinetics was studied by means of thioflavin T (ThT) fluorescence for Aβ(M1–42) and six variants with N-terminal extensions of 5–40 residues (Figure 1A). Monte Carlo simulations were set up to model the fibril formation kinetics of hexa-peptides without or with N-terminal extensions of 1–6 residues (Figure 1C). In both experiment and simulation, we find that all extended variants form fibrils, but the rate of fibril formation is significantly reduced with a progressive retardation the longer the extensions. This suggests that the retarding effect on the fibril formation reaction due to terminal extensions is a general physicochemical effect related to the decreased probability of “productive” molecular encounters between monomers and between monomers and fibrils, and we discuss the generality of this finding. Aggregation kinetics as a function of peptide concentration and time were subjected to a global kinetic analysis which indicated that terminal extensions significantly reduce the rate constants for primary and secondary nucleation as well as elongation. Coaggregation experiments starting from monomer mixtures, monitored by ThT fluorescence and immuno-gold transmission electron microscoy (TEM), suggest that extended peptides and Aβ(M1–42) form mixed fibrils. Self- and cross-seeding experiments suggest that monomer identity is the determining factor for the rate of surface catalysis. Our results highlight the importance of the relative concentration of Aβ sequence length variants and how changes in the ratios of different variants have the potential to elevate or decrease production of toxic intermediates. In this regard, our demonstration that NTE-Aβ species can aggregate and provide a catalytic surface for aggregation of canonical forms of Aβ adds a new player to the already crowded field of Aβ species that can contribute to Aβ aggregation in vivo. These and other recent studies demonstrate that the physiochemical properties of the individual Aβ components will determine the overall aggregation process in the naturally occurring heterogeneous Aβ family of peptides; this process is necessarily complex and sensitive to changes in the composition and concentration of both canonical and noncanonical forms of Aβ.
Figure 1.
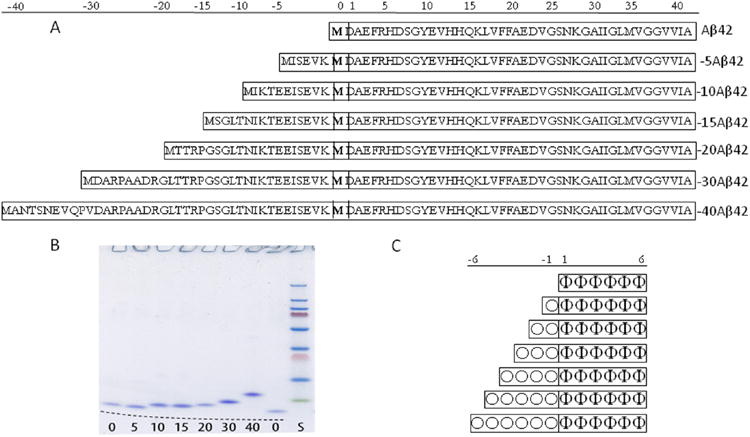
Aβ42 and model peptides used for in vitro and in silico studies. (A) Amino acid sequences of Aβ42 and the six NTE-Aβ peptides, with 5, 10, 15, 20 25, 30, and 40 extra amino acids from APP and (B) their migration on 4–20% polyacrylamide SDS tris-tricine gel with peptides visualized by staining with coomassie brilliant blue. The number of residues in the extension is given under each lane. The same Aβ42 sample was loaded in the two outer lanes to help to identify the migration of NTE-Aβs; the gel is curved as indicated by the dashed black line. (C) Schematic representation of the model hexapeptide and NTE-model peptides used in the Monte Carlo simulations with six amyloidogenic residues (Φ) and 0, 1, 2, 3, 4, 5, or 6 nonamyloidogenic residues (O).
Materials and Methods
Expression and Purification of Aβ(M1–42) and N-Terminally Extended Aβ
Six variants of Aβ were produced with extensions of 5, 10, 15, 20, 30, or 40 residues from the APP sequence added to the N-terminus of Aβ(M1–42) (Figure 1A). The genes for N-terminally extended variants (by 5, 10, 15, 20, 30, or 40 residues from APP) were produced through stepwise extension of the synthetic Aβ(M1–42) gene28 by PCR using oligonucleotides with the desired extensions with E. coli preferred codons. The genes were cloned into PetSac vector and DNA sequence confirmed on plasmids prepared from single colonies. Aβ(M1–42) and the N-terminally extended variants were expressed in E. coli (BL2 DE3 PLysS Star). The peptides were purified using ion exchange and size exclusion steps as described.28 The purity of the peptides was confirmed by SDS PAGE (Figure 1), RP-HPLC and MALDI-TOF mass spectrometry. Purified peptides were stored as lyophylized aliquots. The approximate yields of the final pure peptides per liter culture were as follows: 20 mg of Aβ42, 30 mg of −5Aβ42, 40 mg of −10Aβ42, 30 mg of −15Aβ42, 20 mg of −20Aβ42, 15 mg of −30Aβ42, and 10 mg of −40Aβ42.
Expression and Purification of Aβ(1–42)
Aβ1–42 was expressed in BL21 De3 pLysS star in fusion with a small ubiquitin-related modifier (SUMO) fusion protein placed N-terminal to the Aβ42 sequence. The sequence of the 163 residue fusion construct is as follows with the SUMO cleavage site underlined: MSYYHHHHHH-LESTSLYKKAGSGSLQDSEVNQEAKPEVKPEVKPETHINL-KVSDGSSEIFFKIKKTTPLRRLMEAFAKRQGKEMDSLRFL-YDGIRIQADQAPEDLDMEDNDIIEAHREQIGGDAEFRHDSGY-EVHHQKLVFFAEDVGSNKGAIIGLMVGGVVIA. Cells from 2 L of culture were sonicated in 50 mL of 10 mM Tris/HCl, 1 mM EDTA, pH 8 (buffer A) with 0.5 mg of DNase for 90 s, 50% duty cycle, max power. Sonication was performed in a glass beaker immersed in ice/water slurry, and immediately followed by centrifugation for 10 min at 15 000 rpm in SS34 rotor at 4 °C. The supernatant was removed and pellet again sonicated for 10 min in 50 mL buffer A, followed by 8 min centrifugation at 15 000 rpm. Sonication and centrifugation was repeated once more. The supernatant was removed, and the pellet (inclusion bodies) was dissolved in 50 mL of buffer A with 8 M urea. Highest quality urea was dissolved just prior to use to avoid covalent modification of the protein. The dissolved inclusion bodies were diluted with 150 mL of buffer A and purified by ion exchange chromatography on 30 mL DEAE cellulose resin equilibrated in 2 M urea in buffer A. The resin was washed with 300 mL of 2 M urea in buffer A with 75 mM NaCl, and the fusion protein eluted in 2 M urea in buffer A with125 mM NaCl. The eluted protein was diluted with three volumes of buffer A with 92 mM NaCl to reach final concentration 100 mM NaCl and 0.5 M urea. SUMO-1 protease was added (preparation described below), and the solution was incubated at room temp for 2 h. This gave close to complete cleavage, after which the sample was lyophylized, dissolved in 6 M GuHCl, and subjected to two rounds of gel filtration on a 26 × 600 mm Superdex75 column in 20 mM NaP buffer with 0.2 mM EDTA, pH 8.0, to isolate monomer.
Preparation of SUMO-Hydroxlyase
SUMO-1 hydroxylase with a His6 tag29 was expressed in E. coli (BL21-DE3) by inoculating 100 mL of LB broth and grown overnight at 30 °C, which was added to 1 L of LB broth and grown at 30 °C until OD600 = 1.0. Subsequently the temperature of the incubator was lowered to 20 °C and 0.5 mM IPTG was added 1 h after the temperature change, and the protein was expressed overnight. Cells were harvested and frozen stored at −80 °C until purification. The pellet was subjected to two freeze–thaw cycles (frozen in liquid N2 and thawed in a 45 °C water bath) and resuspended in 40 mM HEPES/KOH, pH 7.4 with 150 mM KCl and 20 mM β-mercaptoethanol (Buffer B), followed by addition of 10 mg lysozyme, 0.5 mg of DNase, and a EDTA free Complete tablet. The pellet was sonicated with a tip sonicator (Branson 450 sonifier) 50% duty cycle, 2 min followed by 2 min rest (repeated twice) and pelleted at 17.5 k rpm for 30 min. The supernatant was added to 5 mL of Ni:NTA resin and washed with buffer A (150 mL) and eluted with buffer A with 250 mM imidazole added. The eluted protein was placed into 10 kDa snakeskin dialysis tube and left to dialyze for 2 days at 4 °C in 40 mM HEPES:KOH, 100 mM KCl, and 10 mM β-mercaptoethanol at pH 7.4. Following dialysis, the sample was concentrated with a 10 kDa centrifugal concentrator to a final volume of 2 mL with an equal volume of glycerol added, and 100 μL aliquots were frozen until needed.
Preparation of Samples for Kinetic Experiments
For kinetic experiments, 0.2–0.5 mg aliquots of the purified Aβ1–42, Aβ(M1– 42), or NTE-Aβ peptides were dissolved in 1 mL 6 M GuHCl, 20 mM sodium phosphate, 0.2 mM EDTA, pH 8.5, and subjected to gel filtration on a Superdex 75 10/300 column in 20 mM sodium phosphate buffer pH 8.0, with 200 μM EDTA and 0.02% NaN3. The middle part of monomer peak was collected on ice, lyophlized, dissolved in 6 M GuHCl, 20 mM sodium phosphate, 0.2 mM EDTA, pH 8.5 and subjected to a second round of gel filtration to ensure complete removal of trace amounts of aggregates and small molecule contaminants from E. coli. The middle part of monomer peak was collected on ice and was typically found to have a concentration in the range 20–70 μM (determined by absorbance of the collected part of the chromatogram peak using ε280 = 1400 L mol−1cm−1). The collected monomer was supplemented with 10 μM thioflavin T (ThT) from a 2 mM stock and used to prepare a dilution series in the range 0.5–20 μM peptide in 20 mM sodium phosphate buffer pH 8, with 200 μM EDTA, 10 μM ThT and 0.02% NaN3. The ThT concentration was optimized to give a linear response for the concentration of fibrils.18 The dilution series were prepared in low-binding tubes on ice using careful pipetting to avoid introduction of air bubbles. Each sample was pipetted into multiple wells of a 96 well half a rea plate of black polystyrene with clear bottom and PEG coating (Corning 3881), 80 μL per well. The samples were added to the plate from lower to higher concentration after which the plate was sealed with a plastic film (Corning 3095). Two to three 96-well plates were set up for each variant with all solutions in quadruplicate.
Aggregation Kinetics by Thioflavin T Fluorescence
The experiment was initiated by placing the 96-well plate at 37 °C in a plate reader (Fluostar Omega, Optima or Galaxy from BMG Labtech, Offenburg, Germany). The ThT fluorescence was measured through the bottom of the plate every 60 or 120 s (with excitation filter 440 nm, and emission filter 480 nm).
Circular Dichroism (CD) Spectroscopy
Monomers were isolated by gel filtration in 5 mM sodium phosphate buffer with 40 mM NaF, pH 8.0, and spectra recorded immediately in 1 mm quartz cuvettes between 250 and 185 nm at 37 °C using a JASCO J-815 polarimeter with scan rate 20 nm/min, response 16s, slit 1 nm. CD spectra were then recorded repeatedly during the aggregation reaction and at the end. Alternatively, to obtain aggregation time courses, the CD signal at 198 nm, reporting on the disappearance of unstructured monomer (negative signal) and appearance of β-sheet (positive signal) was recorded as a function of time for up to 24 h or until a stable plateau value was reached after a transition had been observed.
Kinetic Analysis
The global kinetic analysis to extract rate constants for the different Aβ variants was performed using the fitting platform Amylofit.30 These analyses use master equations derived by considering the contributions from primary nucleation, secondary nucleation, and elongation.31 For each NTE-Aβ42 variant, aggregation kinetics data at several peptide concentrations were uploaded, normalized and globally fitted.
Negative Contrast TEM
The morphology of Aβ aggregates formed from solutions incubated as above were assessed by negative contrast electron microscopy (EM) as described previously.32 Briefly, samples (5 μL) were applied to carbon-coated Formvar grids left for 1 min, fixed with glutaraldehyde, washed with MQ water, wicked dry with filter paper, and 2% uranyl acetate added and incubated for two min. The grid was wicked dry and allowed to air-dry for 10 min. Grids were stored in a sealed container and viewed under a Tecnai G2 BIOTWIN electron transmission microscope operated at 120 V. All reagents were supplied by Electron Microscopy Sciences (Hatfield, PA). Duplicate samples were analyzed and at least duplicate grids examined, and the EM operator was blind to sample identity.
Double Antibody Immuno-Gold Labeling and Negative Contrast TEM
These studies were performed on end-stage aggregation products formed from (i) 5 μM Aβ(1–42), that is, recombinant Aβ that lacked an exogenous methionine, (ii) 5 μM −30Aβ42, and (iii) a mixed solution containing 2.5 μM Aβ(1–42) and 2.5 μM −30Aβ42. Samples (5 μL) were applied to carbon-coated Formvar grids left for 5 min and blocked with 1% BSA in PBS for 10 min, and then incubated for a further 30 min with 1G6 (Covance, Dedham, MA), a monoclonal antibody that recognizes an epitope just N-terminal of the Aβ region (APP649–652) and readily detects recombinant NTE-Aβ42, but not Aβ1–42.33 Grids were then washed with PBS (3 drops in 10 min) and incubated for 20 min with rabbit anti-mouse bridging antibody (Cappel, MP Biomedicals, Solon, OH) in 1% BSA, PBS. Grids were again washed with PBS (3 drops in 10 min) and then incubated for 20 min with Protein A conjugated to 10 nm gold particles (University Medical Center, Utrecht, The Netherlands) in 1% BSA, PBS. Grids were washed in PBS (2 drops in 5 min) and then fixed for 1 min in 0.5% (v/v) glutaraldehyde. Thereafter, samples were washed with 20 mM glycine in PBS (4 drops in 10 min) and then incubated for 30 min with 3D6, a monoclonal antibody that specifically recognizes the free Asp1 N-terminal residue of Aβ.34 Visualization of 3D6 was achieved as described above for 1G6, but used a rabbit antimouse bridging antibody and Protein A conjugated to 5 nm gold particles (University Medical Center, Utrecht, The Netherlands). All samples treated with both the 3D6 and 1G6 antibody. On completion of this procedure grids were washed in Milli-Q water (4 drops in 10 min) and wicked dry with filter paper, and samples stained for 30 s with 0.75% (w/v) uranyl formate. Duplicate samples were analyzed and at least duplicate grids examined and the EM operator was blind to sample identity.
Monte Carlo Simulations of Amyloid Formation
The model peptides used in these simulations contain only two kinds of residues, amyloidogenic (Φ) and nonamyloidogenic (O), differing only in terms of the average lifetime of their fibrillar contacts. The algorithm for the Monte Carlo simulations is reported elsewhere,35,36 and in brief it operates as follows. Inter-residue contacts are grouped in two categories, strong and weak contacts, with different average lifetime. Strong contacts are the fibrillar contacts involving the C-terminal six residues in each peptide as outlined in Figure 5D. The average lifetime for these contacts is given by the parameter τs. Weak contacts are all other intra- or intermolecular contacts involving the C-terminal six residues and the residues in the extension. The average lifetime for these contacts is given by the parameter τw. All contacts (strong and weak, intra-, and intermolecular) are allowed to form with equal probability but their formation is governed by their physical separation in space, which is modeled via the effective contact order (ECO) at each stage of the simulation. Each simulated system contains 100 peptides, which before the simulation are equally dispersed in the system and unfolded with no contacts formed between any residues. Each simulation cycle starts by randomly picking two residues which may be in the same or on two different peptides. The probability of forming a contact between the randomly chosen residues is proportional to 1/ECO1.5. If no contact is formed, the program steps forward to the next cycle. If a strong contact is formed, it is assigned a lifetime which is randomly picked from an exponential decay with the time constant τs. If a weak contact is formed, it is assigned a lifetime randomly picked from an exponential decay with the time constant τw. If a contact forms next to a preexisting one, its randomly assigned lifetime is multiplied by the cooperativity factor fc. Each simulation cycle ends by terminating the contacts that expire on that cycle. In an earlier study36 it was found that 5–20 times longer average survival time for a fibrillar contact (τs/τw = 5–20) is a sufficient criterion for fibrillar structure to dominate at equilibrium, and a value of τs/τw = 10 was used in the current simulations. The parameter settings were as follows. Number of peptides per simulated system: 100, τs = 40 MCU, τw = 4 MCU, fc = 2. One Monte Carlo Unit (MCU) is defined as the square of the system size (10 000 simulation cycles in the present case).
Figure 5.
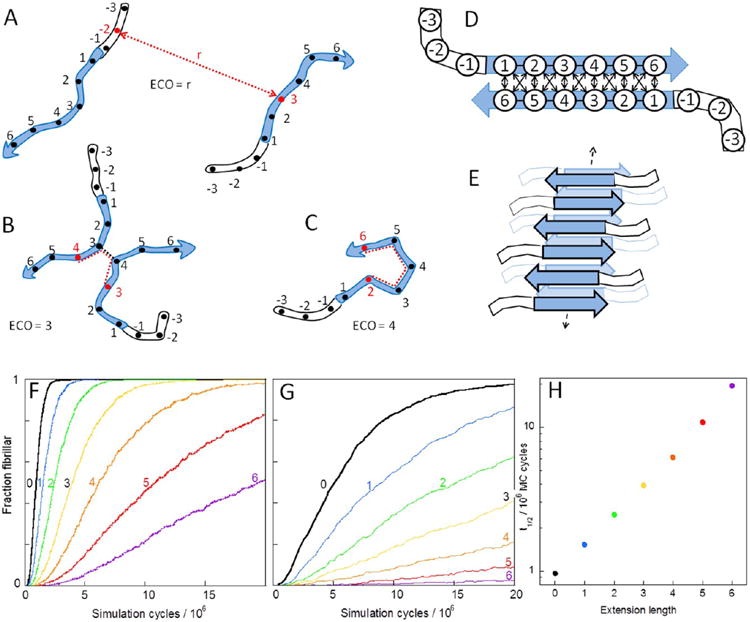
Monte Carlo Simulations to test the effect of N-terminal extensions on fibril formation. (A–C) Effective contact order (ECO) is defined as the number of covalent amino-acid connections for the shortest path (dashed red line) between the trial residues (red) and three examples of different values of ECO are shown. (D) Fibrillar contacts. (E) Each peptide is allowed to interact with a maximum of three other peptides. Panels (F)–(H) show results of the simulations of model peptides with six amyloidogenic (Φ) residues in an aggregation-prone segment numbered 1, 2, 3, 4, 5, 6 and up to 6 non-amyloidogenic (O) residues in an N-terminal extension numbered −1, −2, −3, −4, −5, and −6. The average of 100 simulations of systems of 100 peptides of each length (labeled with the number of residues in the extension) is shown in panels for two concentration, c: (F) c = 0.0025 and (G) c = 0.0008. (H) Number of simulation steps required until 50% of the fibrillar contacts are formed (using c = 0.0025 as in panel F).
Results
N-Terminally Extended Aβ Variants
We investigated the aggregation propensity of six recombinant NTE-Aβ42 peptides with progressively longer primary sequences. These designed variants span the full range of N-terminal extensions identified in human plasma7 and in cell culture.6 Our peptides incorporate juxtaposed APP sequence of 5, 10, 15, 20, 30, or 40 residues upstream of M671 (Figure 1A). Synthetic genes were produced through stepwise extension of the Aβ(M1–42) gene28 using PCR. The requirement for a start codon results in a methionine residue at the N-terminus of each peptide. The methionine at the N-terminal side of Asp1 is common to all seven peptides and designated residue 0, while N-terminal extensions are assigned negative numbers based on the size of the extension. All seven peptides expressed well in E. coli, and were readily purified to homogeneity (Figure 1B) using the two-step chromatographic procedure developed for Aβ(M1– 40) and Aβ(M1–42).28 Throughout, Aβ42 refers to Aβ(M1– 42). Recombinant Aβ beginning at Asp1 and ending at Ala42, referred to as Aβ1–42, was used in coaggregation experiments for immuno-gold TEM analysis (see below).
NTE-Aβ Peptides Aggregate to Form Amyloid Fibrils
Fibril formation of NTE-Aβ42 peptides was investigated under conditions where Aβ42 is known to rapidly form amyloid fibrils.18,37 Aggregation starting from freshly isolated monomers was followed by monitoring the ThT fluorescence as a function of time at 37 °C in 20 mM sodium phosphate, 0.2 mM EDTA, 10 μM ThT, 0.02% sodium azide, pH 8.0 under quiescent condition. Under these conditions all six NTE-Aβ42 peptides form ThT-positive fibrils over time (1–14 h for 10 μM peptide solutions; examples of data shown in Figure 2A).
Figure 2.
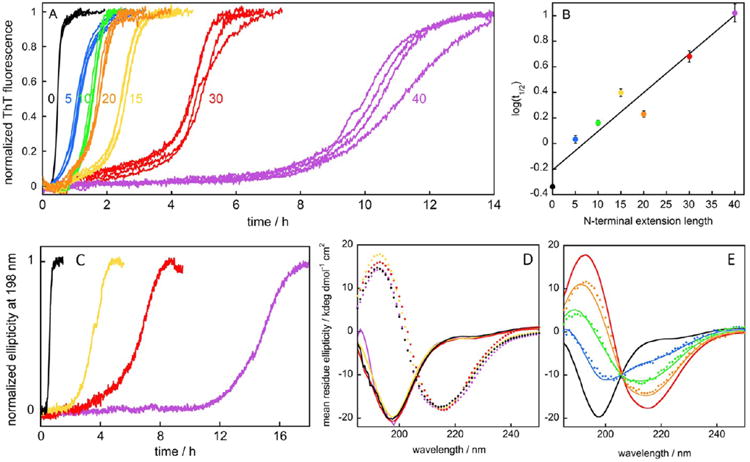
(A) Examples of aggregation kinetics for Aβ42 and the six NTE-Aβ42 peptides. Aggregation was monitored by ThT fluorescence at ca.10 μM peptide concentration in 20 mM sodium phosphate, 0.2 mM EDTA, 0.02% NaN3, pH 8.0 under quiescent condition. The individual traces from four replicates are shown, and the results are representative of at least eight different experiments. The same data is shown without normalization and truncation in Figure S1. (B) The logarithm of the time of half completion (t1/2) of the aggregation process for each extension length at 10 μM peptide concentration was determined from the experiments conducted as in (A). The solid line is a straight line fitted to the data points. (C) Aggregation kinetics as monitored by the CD signal at 198 nm for Aβ42 (black), −15Aβ42 (yellow), −30Aβ42 (red), and −40Aβ42 (purple). (D) Examples of CD spectra recorded before (solid lines) and after (dotted lines) the aggregation reactions for Aβ42 (black), −15Aβ42 (yellow), −30Aβ42 (red), and −40Aβ42 (purple). (E) Examples of CD spectra recorded for −15Aβ42 at start (black line) and end (red line), as well as during the transition at 2.5 h (blue dots), 3.2 h (green dots), and 4 h (orange dots), with weighted superpositions of the start and end spectra shown as solid lines in the respective colors. All data in panels (C)–(E) are obtained at ca.10 μM total peptide concentration in 5 mM sodium phosphate, 40 mM NaF, pH 8.0 under quiescent conditions.
Characteristic of nucleated polymerization reactions, all aggregation curves have sigmoidal-like appearances with a lag phase, a growth phase and a final plateau, (Figures 2A and S1). However, the aggregation process is retarded for all NTE-Aβ42 peptides relative to Aβ42. The time of half completion (t1/2) was extracted from each aggregation trace as the point in time where the ThT fluorescence intensity is halfway between the initial baseline and the final plateau. We find that even the peptide with the shortest extension, −5Aβ42, aggregates significantly more slowly than Aβ42 and the effect is more pronounced for the longer extensions. Log(t1/2) values, obtained for reactions starting from 10 μM monomer of each peptide, are plotted versus extension length in Figure 2B. Although −20Aβ42 deviates somewhat from the overall trend, the data are reasonably well fitted by a straight line (R = 0.965), implying that t1/2 grows exponentially with extension length. Similar trends are observed when the aggregation process is followed by circular dichroism (CD) spectroscopy (Figure 2C). CD spectra recorded at the start and end of the reactions reveal that the NTE-Aβ42 peptides are unstructured as monomers and that the aggregates formed are β-sheet rich (Figure 2D). At all time points, the observed spectra can be reconstructed by a weighted superposition of the start and end spectra (Figure 2E), as previously reported for Aβ42.61
Each NTE-Aβ42 peptide was studied at a range of concentrations covering at least 1 order of magnitude. The t1/2 values versus initial monomer concentration are shown in Figure 3 with linear (Figure 3A) and logarithmic (Figure 3B) axes. We find that the aggregation of each NTE-Aβ42 peptide is retarded compared to Aβ42 over the entire concentration range. For each variant, t1/2 versus peptide concentration was fitted by a power function (Figure 3A) yielding a straight line in the double logarithmic plot (Figure 3B). The scaling exponent in the power function becomes the slope in the double logarithmic plot, and serves as a guide to the dominant nucleation mechanisms.38 The similarity for the exponent of all variants (−1.2 to −1.5) suggests that their aggregation is governed by the same underlying mechanism as for Aβ42, which is dominated by secondary nucleation of monomers on the fibril surface at all time-points except at the very beginning of reactions starting from monomeric peptide.18–21
Figure 3.
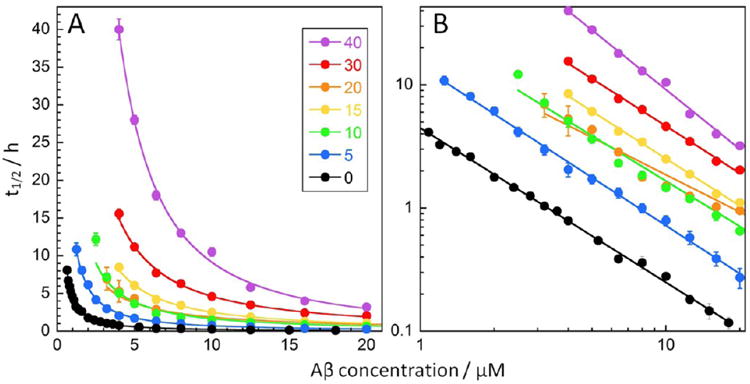
Concentration dependence of aggregation kinetics for Aβ42 and NTE-Aβ42 peptides under quiescent conditions. The time of half completion of the aggregation process, t1/2, is plotted as a function of peptide concentration for Aβ42 and the NTE-Aβ42 peptides in 20 mM sodium phosphate, 0.2 mM EDTA, 0.02% NaN3, pH 8.0. Half times and peptide concentrations are shown in linear scales in (A) and logarithmic scales in (B). Each data point is the average, and the error bars represent SD of four replicates. For each peptide, we include the peptide concentrations at which fibril formation was observed within the time frame of experiment. The solid lines show fits of a power function to each data set. The color codes per extension length are given in panel (A).
Morphology of Aggregates
Transmission electron microscopy was used to study the morphology of end-stage aggregates. All six extended variants were found to form amyloid fibrils that appear similar to each other (Figure 4) and to typical Aβ(1–42) and Aβ(M1–42) fibrils.28 In all cases, individual filaments are obvious and two or more filaments are twisted around a common long axis. Clearly visible nodes appear at regular intervals corresponding to minima in apparent thickness, akin to the appearance of nodes when fibers are twisted together to form a rope. Individual filaments have a diameter of ∼5 nm and the fibrils formed from two twisted filaments have diameters of ∼14 nm.
Figure 4.

TEM of end-stage reaction time points for the six NTE-Aβ42 peptides: (A) −5Aβ42, (B) −10Aβ42, (C) −15Aβ42, (D) −20Aβ42, (E) −30Aβ42, and (F) −40Aβ42. All NTE-Aβ42 peptides form fibrils that are very similar to those formed from Aβ1–42 and Aβ(M1–42).19,28
Monte Carlo Simulations of Amyloid Formation
Monte Carlo simulations were used to follow the aggregation kinetics of model peptides with a hexa-residue aggregation-prone segment and 0, 1, 2, 3, 4, 5, or 6 residues in an N-terminal extension (Figure 1C). In the simulations, all interactions were treated as attractive and the model peptides contain only two kinds of residues, amyloidogenic (Φ) and nonamyloidogenic (O). All kinds of inter-residue contacts (OO, OΦ, and ΦΦ) were allowed to form with equal probability, depending on the physical separation, which is modeled via the effective contact order (ECO) at each stage of the simulation (Figure 5A–C), while ΦΦ contacts within fibrillar structure (Figure 5D, E) were assumed to persist on average 10 times longer than OΦ or OO contacts or any nonfibrillar ΦΦ contacts. An individual nonfibrillar contact may thus survive longer than a fibrillar one, but on average the fibrillar contacts survive 10-fold longer than the nonfibrillar ones. A similar model with kinetic discrimination governing the contacts in a lower free energy structure has previously been used to model protein folding35 and fibril formation of peptides with only amyloidogenic residues.36
While Monte Carlo simulations contain no time variable, we find that the terminal extensions reduce the apparent aggregation rate in terms of the number of simulations cycles needed to reach a certain fraction of aggregated species (Figure 5F–H). This is reflected both in an increased number of cycles needed to reach a state with half the peptides in fibrillar form and a reduced steepness of the growth phase. The longer the extension, the more the simulated aggregation trace deviates from symmetric sigmoidal shape. Notably, the effect of terminal extension (Figure 5F) is similar to the effect of diluting the system by increasing the size of the simulated system (Figure 5G).
Kinetic Analysis of Experimental Data
The quiescent aggregation data obtained over a range of initial monomer concentrations were fitted globally for each NTE-Aβ42 length variant using the AmyloFit platform.30 We find that the data for all NTE-Aβ42s are reasonably well fitted using the same mechanism as for Aβ42 (Figures 6A and S2), that is, with three microscopic steps corresponding to primary nucleation (rate constant kn), elongation (k+), and surface-catalyzed secondary nucleation (k2). For Aβ42, fragmentation is a slow reaction under quiescent conditions,18 and the data for the extended variants are also well fitted by setting the fragmentation rate to zero. Examples of experimental data and the best fit using a model with primary nucleation, elongation and surface-catalyzed secondary nucleation are shown in Figure 6A for −15Aβ42 and in Figure S2 for all NTE-Aβ42s. The kinetic analyses yield two products of rate constants, knk+ and k2k+, referred to as the combined rate constants, since the measured aggregation kinetics from monomer depend only on these products not the rate constants individually.31
Figure 6.
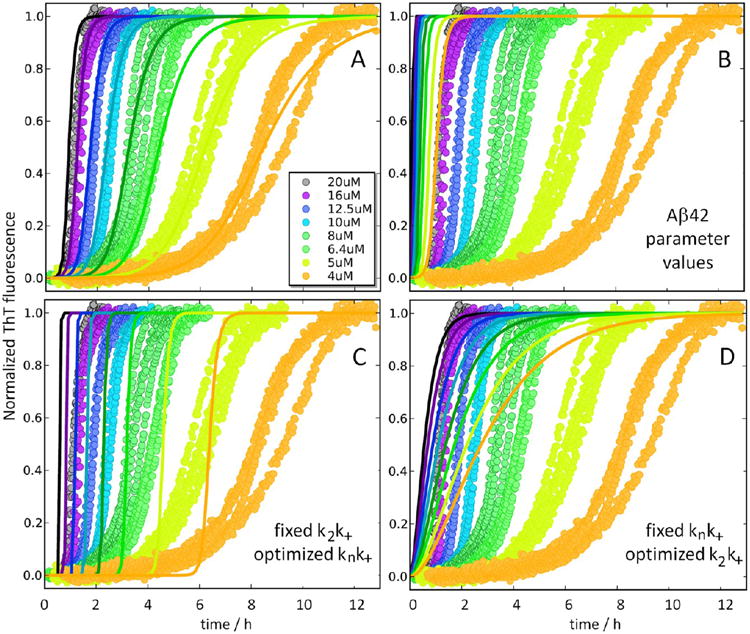
Aggregation kinetics data for 4, 5, 6.4, 8, 10, 12.5, 16, and 20 μM −15Aβ42. Data are from a single experiment in which four replicates for each condition are shown. At least two repeat experiments were performed for each peptide. The results of global fitting to all data are shown with the curves at each concentration shown in the same color as the respective data points. (A) The best fit using a model with primary nucleation, elongation, and surface-catalyzed secondary nucleation, with the resulting rate constants knk+ = 1.3 M−2 s−2 and k2k+ = 6 × 10⁸ M−3 s−2. (B) Curves generated using the parameters for Aβ42 (knk+ = 900 M−2 s−2 and k2k+ = 4 × 10¹⁰ M−3 s−2). (C) The best fit under the assumption that only the primary nucleation rate constant is shifted relative to Aβ42. (D) The best fit under the assumption that only the rate constant for secondary nucleation is shifted relative to Aβ42.
The resulting rate constants are shown for all NTE-Aβ42 in Figure 7A, and for −15Aβ42 we find knk+ = 1.3 M−2 s−2 and k2k+ = 6 × 10⁸ M−3 s−2. These values are 700- and 70-fold lower than those for Aβ42, respectively. Curves generated using the same rate constants as for Aβ42 (knk+ = 900 M−2 s−2 and k2k+ = 4 × 10¹⁰ M−3 s−2; ref 18) clearly do not fit the −15Aβ42 data (Figure 6B). Misfits are also obtained if only the rate constant for primary nucleation (Figure 6C) or only the rate constant for secondary nucleation (Figure 6D) is allowed to shift relative to the value for Aβ42. Thus, the combined elongation–nucleation rate constants for both primary and secondary processes are reduced for −15Aβ42. Similar results are obtained for the other five variants; the data are reasonably well fitted by the same model as the data for Aβ42 if all rate constants are allowed to take lower values (Figure S2), with a progressively larger reduction the longer the extension (Figure 7A). The data are well fitted if both primary and secondary nucleation have reaction orders of 2 for all NTE-Aβ42s, as for Aβ42,18 suggesting that the observed behavior is not the result of an altered reaction order.
Figure 7.
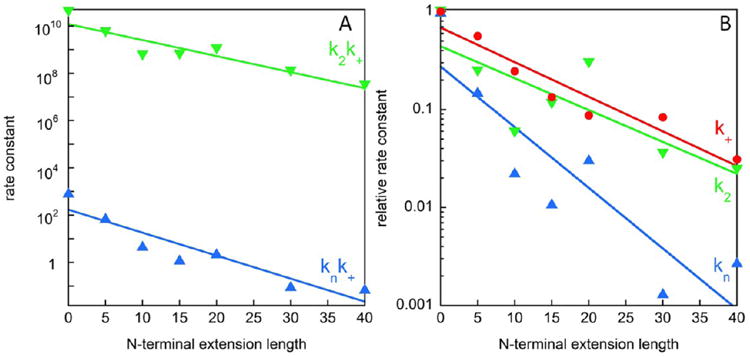
Microscopic rate constants. (A) Combined rate constants (obtained from kinetic analyses of concentration-dependent data, as exemplified in Figures 6 and S2) for primary nucleation and elongation (knk+, blue upward triangle) and for secondary nucleation and elongation (k2k+, green downward triangle), as a function of extension length. (B) Dependence of individual rate constants on N-terminal extension resolved after analysis of data obtained in the high seed regime. This analysis yields the relative elongation rate constant (k+, red circle), used to resolve the relative rate constants for primary nucleation (kn, blue upward triangle), and secondary nucleation (k2, green downward triangle).
The results (Figure 7A) suggest that log(knk+) and log(k2k+) decrease roughly linearly with extension length, and thus the reduction in rate constants is exponential in terminal extension length. We find that the N-terminal extensions reduce knk+ by up to 4 orders of magnitude and k2k+ by up to 3 orders of magnitude.
Seeded Aggregation Kinetics
Seeded aggregation kinetics experiments were set up to resolve the individual rate constants and to determine whether the reduction of k2k+ for NTE-Aβ is due to the extended termini interfering with the catalytic activity of the fibril surface or with the monomer's ability to nucleate on the surface. Self-seeding experiments were set up for each variant (Aβ42 or NTE-Aβ42) by supplementing purified monomer with preformed seeds of the same variant. Cross-seeding experiments were set up for each variant by supplementing purified monomer with preformed seeds of Aβ42 or each of the other NTE-Aβ42s. Examples of normalized data are shown in Figure 8 for self- and cross-seeding of Aβ42, −15Aβ42, and −30Aβ42, and these and additional data are shown non-normalized in Figure S3A. While there is some variation in the final ThT intensity over the seeded samples, SDS PAGE analysis (Figure S3B) shows that in all cases most of the monomer is converted to fibrils by the end of the reaction. In all cases of self-seeding, we observe shortening of the lag phase in the presence of preformed seeds as would be expected in the presence of a surface-catalyzed secondary nucleation process of monomer on fibril surface.38 Moreover, we find a very close correspondence between self-seeding and cross-seeding effects, irrespective of the identity of the seeds added to each monomeric peptide; for example, the aggregation of −15Aβ42 is equally catalyzed by −15Aβ42 seeds or Aβ42 seeds or any NTE-Aβ42 seed (middle column of Figures 8 and S3). Likewise, the aggregation of Aβ42 or −30Aβ42 is equally catalyzed by Aβ42 seeds or any NTE-Aβ42 seed (left and right column of Figures 8 and S3). On the contrary, if we compare the aggregation of different kinds of monomers on the same seeds (horizontal comparisons in Figures 8 and S3), we observe widely different time dependencies. The positive curvature in the aggregation curves is preserved up to ca. 10% seed, but is not seen at the highest seed concentration (30%) for most variants due to the very high elongation rate at this high seed concentration.38
Figure 8.
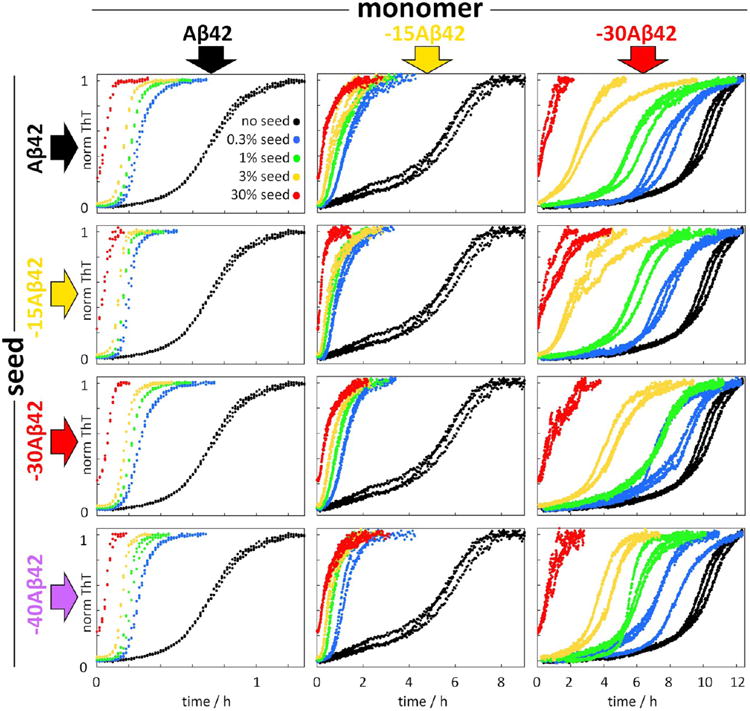
Seeded aggregation kinetics of 5 μM Aβ42 monomers (left column), 5 μM −15Aβ42 monomers (middle column), and 5 μM −30Aβ42 monomers (right column) by seeds of Aβ42 (top row), −15Aβ42 (second row), −30Aβ42 (third row), and −40Aβ42 (bottom row) in comparison with unseeded reactions (black data points). The seed concentrations are 0.3% (blue), 1% (green), 3% (yellow), and 30% (red) of the monomer concentration at time zero. The data are presented as normalized ThT fluorescence intensity versus time, with three replicates of each condition.
The aggregation at 30% seed at early time points is to a good approximation governed by elongation processes alone. Therefore, the initial gradient can be used in order to extract the relative elongation rate. We find that the elongation rates are reduced for NTE-Aβ42s in comparison with Aβ42 by over an order of magnitude (Figure 7B). With these values of the elongation rate constant for each variant at hand, we may resolve the rate constants of primary and secondary nucleation (Figure 7B). After this analysis, it is clear that N-terminal extensions reduce the rate constants of all three microscopic steps in the mechanism, with the largest effect on the rate constant for primary nucleation, kn. The trend lines in Figure 7B imply a reduction in k2 and k+ by over an order of magnitude, and a reduction in kn by up to 3 orders of magnitude over the extension series studied here.
Coaggregation Experiments
To determine whether Aβ42 coaggregates with NTE-Aβ42, component monomers were mixed and their aggregation monitored using ThT fluorescence. Each peptide was separately isolated as monomer by gel filtration, and these solutions were used to prepare a series of samples in which (i) and (ii) one peptide was held constant at a concentration of 5 μM with increasing amounts (0- 5 μM) of the other peptide, or (iii) the total peptide concentration was held at 5 μM and the ratio of the peptides was varied (5:0, 4:1, 3:2, 2.5:2.5, 2:3, 2:4 and 0.5:4.5). Examples of coaggregation data for Aβ42 and −15Aβ42 are shown in Figure 9A, and for Aβ42 and each NTE-Aβ42 in Figure S4. In all cases, the macroscopic aggregation curve displays a single sigmoidal-like transition, indicative of one joint aggregation process. Most strikingly, there is a very strong dependence on Aβ42 concentration, which seems to be the driver of the overall aggregation.
Figure 9.

Coaggregation of NTE-Aβ and Aβ. (A) Aggregation kinetics starting from monomer mixtures of −15Aβ42 and Aβ42. Left: data for solutions with Aβ42 held constant at 5 μM and −15Aβ42 varied from 0 to 5 μM (color codes given in the panel). Middle: −15Aβ42 held constant at 5 μM and Aβ42 varied from 0 to 5 μM. Right: Sum of Aβ42 and −15Aβ42 held constant at 5 μM. The Aβ42 concentration follows the color codes given in the panel, and the −15Aβ42 concentration is 5 μM minus the Aβ42 concentration. (B) Negative stain TEM of fibrils formed from 5 μM Aβ1–42 (left), 2.5 μM Aβ1–42 + 2.5 μM −30Aβ42 (middle), or 5 μM −30Aβ42 (right), taken at the time points as indicated with circles at the inset aggregation curves for 5 μM Aβ1–42 (black), 2.5 μM Aβ1–42 + 2.5 μM −30Aβ42 (brown), and 5 μM −30Aβ42 (red). Fibrils were added to grids and incubated with 3D6 (an antibody specific for Asp-1) conjugated to 5 nm gold nanoparticle and 1G6 (an antibody specific for an epitope in the 30-residue extension) conjugated to 10 nm gold nanoparticle. All samples were treated with both the 3D6 and 1G6 antibody. The middle panel contains fibrils decorated with both 5 and 10 nm gold nanoparticles marked with black and red arrows, respectively. Left and right fields contain fibrils marked by only 5 and 10 nm gold nanoparticles, respectively. A small number of these are marked with arrows. In control experiments, preformed 1–42 fibrils and preformed −30Ab42 fibrils were mixed and used for immuno-EM, in which case no fibrils stained with both 3D6 and 1G6 were detected (see Figure S5).
Immuno-gold TEM was used to examine whether joint fibrils are formed in monomer mixtures displaying a single sigmoidal-like aggregation curve. Such experiments require two antibodies: one specific for an epitope in NTE-Aβ not present in Aβ, and one specific for an epitope in Aβ not present in an NTE-Aβ. We chose 1G6 since this antibody recognizes an epitope in APP N-terminal of Asp1 (APP649–652; ref 33) and therefore recognizes NTE-Aβ, but not Aβ1–42. Conversely, 3D6 recognizes the free N-terminal Asp1 of Aβ and therefore reacts with Aβ1–42, but not NTE-Aβ.34 For these experiments Aβ1– 42 was expressed with an N-terminal fusion partner (a SUMO domain) to obtain Asp1 at the N-terminus after proteolytic digestion with SUMO protease. The fibrils formed in reactions starting from monomer mixtures of Aβ1–42 and −30Aβ42 as well as in pure samples of Aβ1–42 or −30Aβ42 were probed by 3D6 (Asp1-specific with 5 nm gold particles) and 1G6 (NTE-specific with 10 nm gold particles). We find that fibrils formed from a homogeneous solution of Aβ1–42 or −30Aβ42 are labeled with only 3D6 or only 1G6, respectively. In contrast, the mixed sample yields fibrils that are labeled with both 3D6 and 1G6 (Figure 9B). Some fibrils label predominantly with 3D6, and others with 1G6, but significant numbers of fibrils were labeled with both 3D6 and 1G6 and in some cases portions of the same fibrils are labeled with both antibodies. These results demonstrate that at least some fibrils contain both Aβ1–42 and −30Aβ42-a finding consistent with the single transitions seen in the ThT aggregation curves for mixed peptide solutions (Figures 9 and S4).
Discussion
Mutation, overexpression, or altered-processing of APP underlie all known monogenic cases of familial AD (fAD). APP undergoes substantial post-translational processing and many different proteolytic fragments of APP have been identified. Still, therapeutic targeting has focused on canonical forms of Aβ,39 driven by the observation that increased relative ratios of Aβ42:Aβ40 are associated with most, but not all, fAD mutations. However, available data support a pathogenic role for other APP metabolites.40–42 Indeed, the recent discovery of bioactive NTE-Aβ peptides could partly explain the lack of efficacy of experimental therapies designed to target canonical Aβ species.2 For instance, it is possible that while BACE1 inhibitors reduce canonical Aβ they increase N-terminally extended or truncated Aβ species.43 In this regard, it is important to note that some NTE-Aβs have already been found to be potent neurotoxins.6
In this study, we set out to investigate the aggregation behavior of NTE-Aβ42 peptides, and whether their aggregation is influenced by Aβ42 and vice versa. We find that all variants form fibrils of similar morphology as Aβ42 fibrils (Figure 4), but the rate by which these fibrils form is progressively lower the longer the extension (Figure 2A,C). As previously found for Aβ42,61 the CD spectra for the NTE-Aβ42s can at all time points be reconciled with unstructured monomer, or β-sheet fibrils or a weighted superposition of spectra for these start and end structures (Figure 2D,E) meaning that the species distribution is dominated by these two forms at all time points. This is seen on a macroscopic level as an overall retarded aggregation process, and the time taken to achieve half-maximal aggregation (t1/2) increases approximately exponentially with extension length (Figure 2B). Detailed kinetic analysis of concentration-dependent ThT fluorescence data for each extended variant (Figure 3) allows this observation to be resolved into the underlying microscopic steps in the reaction mechanism (Figures 6 and 7), suggesting that the rate constants of all steps are reduced. Aβ and NTE-Aβ appear to coaggregate into joint fibrils (Figure 9), and the extended N-termini do not interfere with the catalytic sites presented for surface nucleation on the fibrils (Figure 8).
The same aggregation mechanism as recently found for Aβ42 (primary nucleation, elongation, and surface-catalyzed secondary nucleation of monomers on fibril surfaces) can be used to globally fit the data for each NTE-Aβ42, implying the underlying reaction mechanism can to a large extent still be described by the same aggregation model as for Aβ42. The analyses provide combined rate constants for primary nucleation and elongation, knk+, and for secondary nucleation and elongation, k2k+. Both products are dramatically influenced by the N-terminal extensions; the data can only be fitted if both products are allowed to take lower values than for Aβ42 (Figure 6C,D), with a more severe reduction the longer the extension length (Figure 7A).
While the kinetic analysis implies that primary nucleation is more strongly retarded than secondary nucleation, it does not resolve the relative effects on elongation and nucleation. We therefore analyzed aggregation data in the high seed regime. Here the ThT signal increase at early time points is, to a good approximation, governed by elongation alone, and the initial gradient can be used to estimate the relative elongation rate constant. With an estimate of the elongation rate constant, we can in turn estimate the rate constants of primary and secondary nucleation. From this analysis (Figure 7B), we can conclude that the rate constants for all three microscopic processes are reduced upon N-terminal extension of Aβ42. The elongation and secondary nucleation rate constants are affected similarly, both decreasing by more than an order of magnitude. The primary nucleation rate constant is even more strongly affected, decreasing by up to 3 orders of magnitude.
The reduction in primary nucleation rate implies an interference of the extended termini with the nucleating monomers. In the cases of elongation and secondary nucleation, we may compare self- and cross-seeding data to resolve whether the extended termini interfere with seed or monomer. Aβ42 or NTE-Aβ42 was found to aggregate equally fast if supplemented with fibrils of Aβ42 or any NTE-Aβ42. On the contrary, if the seed type is held constant, there is a marked difference in the observed reaction rate between Aβ42 monomers and NTE-Aβ42 monomers. The results at high seed concentration reveal that the monomer identity, rather than seed identity, dictates the elongation rate (Figures 8 and S3). Also at low seed concentration, the monomer identity dictates the observed aggregation curves, and we infer that N-terminal extensions interfere with the nucleating monomers also in secondary nucleation. This is opposite to C-terminal variation, in which case the identity of the fibrils dictates the rate of surface catalyzed nucleation; Aβ42 monomers fail to nucleate on Aβ40 fibrils,23 and Aβ40 monomers fail to nucleate on Aβ42 fibrils.23,24 This contrasting behavior most likely reflects on the one hand the flexibility of the N-terminus and on the other hand the much higher level of structural organization of the C-terminus, as inferred from solid-state NMR studies.24,44,45 While solid state data fail to detect residues 1– 10 within the β-sheet of the Aβ42 fibrils,24,46 we speculate that the extended N-termini may appear as flexible appendices that decorate fibrils akin to a polymer brush.
We also examined the aggregation process in solutions that initially contained two kinds of monomers, Aβ42 and NTE-Aβ42. All six NTE-Aβs were examined in combination with Aβ42 at several molar ratios. In all cases, we observe a single aggregation process compatible with coaggregation of Aβ42 and NTE-Aβ42 (Figures 9 and S4). Notably, we have shown previously that mixtures of Aβ peptides that do not form coaggregates produce biphasic aggregation curves23 very different from those reported here. The asymmetry in behavior (Figure 9A), with the Aβ42 concentration being the main determinant of the half times observed for mixtures, can be understood in terms of Aβ42 seeds providing a catalytic surface for nucleation of all variants. In addition, Aβ42 and NTE-Aβ42 monomers may cooperate in conucleation events. Our data imply that Aβ42 aggregation will drive the aggregation of NTE-Aβ42 and therefore the Aβ42 concentration may be a main risk factor. In mixtures with Aβ42, aggregation of NTE-Aβ42s becomes as fast as for Aβ42 alone, although NTE-Aβ42s are intrinsically less aggregation prone and aggregate much more slowly in isolation.
While natural amyloid-forming peptides may have one47 or several kinds of residues (as in the case of Aβ), the use of only one kind of amyloidogenic residue and one kind of non-amyloidogenic residue in our simulations leaves less room for parameter adjustment and the results are more likely to be general. We find that the number of simulation cycles required to reach the midpoint of the aggregation process grows exponentially with extension length (Figure 5), as in the experiments (Figure 3). If we compare the systems during ongoing reactions at the same number of simulation cycles, the fraction of peptides in the fibrillar aggregates is lower the longer the terminal extension. The “productive” molecular collisions leading to in-register fibrillar contacts compete with a larger number of “nonproductive” molecular collisions the longer the terminal extension.
The striking similarity between the experimental results for the extended Aβ variants and the results of the Monte Carlo simulations for simplified model peptides suggest that also in the case of NTE-Aβ42s the reduced overall aggregation rate may arise from a protection mechanism relying on the unstructured termini competing with the aggregation-prone segment for productive molecular encounters between monomers and between monomers and fibrils. Such a general physicochemical effect would lower the aggregation rate for any amyloidogenic peptide if extended at the N- or C-terminus by flanks of nonamyloidogenic sequence. Similar mechanisms may be at hand also for all kinds of aggregates that involve a discrete peptide segment. A theoretical study found that the free energy of peptide cluster formation was increased by disordered flanks, thus reducing the aggregation tendency.48 Retardation of aggregation by flanking polypeptide segments occurs also when an amyloidogenic peptide segment is embedded in folded monomeric proteins. In those cases, unfolding of the monomer precedes amyloid formation, and stabilizing interactions with and within the rest of the protein prevent fibril formation even more.49 The rate of aggregation may increase upon destabilization of the protein through pH reduction, mutation or reduced affinity for a ligand.50–53
Besides the specific knowledge uncovered about NTE-Aβs, our results have important implications for the more general physiochemical observation that aggregation activity can be effectively diluted by adding a nonaggregation prone sequence. The reduced aggregation rates observed here for NTE-Aβ variants are compatible with experimental observations of increased aggregation when the N-terminus is truncated,25,26 and with the effects of extension and truncation of other proteins and peptides.54–60 In many polypeptides associated with protein aggregation diseases, the amyloid-forming segment is part of a larger protein or peptide, which seems to protect against aggregation. Enhanced aggregation rates have been observed upon trimming of the protein sequence through proteolysis, or when the amyloidogenic segment is produced as a separate peptide, as long as the amyloidogenic segment remains intact. Examples of this phenomenon are provided by the cell cycle protein Cks1,54 α-synuclein,55–59 and myoglo-bin.60
Conclusion
Aβ42 variants with up to 40 residue N-terminal extensions form fibrils of very similar morphology as Aβ starting at Asp1. However, the fibril formation process is strongly retarded in the extended variants. The half time grows exponentially with extension length, and the rate constants for all underlying microscopic processes are reduced. The retardation is consistent with a general physicochemical effect involving reduced frequency of amyloid-productive molecular encounters between monomers and between monomers and fibrils. Aβ42 and NTE-Aβ42 can coaggregate into mixed fibrils, and nucleation of monomers on the surface of fibrils accelerates the overall reaction in pure samples as well as in sequence mixtures. Once incorporated into fibrils, N-terminal extensions of Aβ monomers have little effect on the seeding capacity. Aβ and NTE-Aβs nucleate equally fast on fibrils of Aβ and fibrils of NTE-Aβs and the aggregation rate in seeded samples is governed by the monomer identity. In nature, Aβ exists as a heterogeneous family of peptides which include NTE-Aβs. The overall aggregation process may be determined by the concentration of the most aggregation prone Aβ-variants, which may serve as initiators for the formation of synaptotoxic aggregates of NTE-Aβs.
Supplementary Material
Acknowledgments
We thank Maria Ericsson of the Harvard Medical School Electron Microscopy Facility for assistance with immuno-EM studies. We also thank Dr. Kendra K. Fredrick for her assistance in preparing the SUMO-Aβ vector. 3D6 was a kind gift from Dr. G. Basi, Elan Pharmaceuticals. The present study was funded by the Swedish Research Council, VR and its Linneaus Centre Organizing Molecular Matter (SL), the European Research Council (SL,TPJK), the Crafoord Foundation (SL), Lars Hiertas Minne (OS), the Royal Physiographic Society (OS), the National Institute of Health grant AG046275 (DMW), the BrightFocus Foundation (DMW), the Cambridge Home and EU Scholarship Scheme (GM), The Frances and Augustus Newman Foundation (TPJK) and the BBSRC (TPJK) and by the National Institute of Biomedical Imaging and Bioengineering of the National Institute of Health under grants EB-003151, and EB-002026 (M.T.C., A.C.J., and R.G.G.).
Footnotes
Supporting Information: The Supporting Information is available free of charge on the ACS Publications website at DOI: 10.1021/jacs.5b07849. Supporting figures (PDF)
Notes: The authors declare no competing financial interest.
References
- 1.Hebert LE, Weuve J, Scherr PA, Evans DA. Neurology. 2013;80:1778–1783. doi: 10.1212/WNL.0b013e31828726f5. [DOI] [PMC free article] [PubMed] [Google Scholar]
- 2.Selkoe D. J Ann Neurol. 2013;74:328–336. doi: 10.1002/ana.24001. [DOI] [PubMed] [Google Scholar]
- 3.Hardy J. J Neurochem. 2009;110:1129–1134. doi: 10.1111/j.1471-4159.2009.06181.x. [DOI] [PubMed] [Google Scholar]
- 4.Vassar R, Bennett BD, Babu-Khan S, Kahn S, Mendiaz EA, Denis P, Teplow DB, Ross S, Amarante P, Loeloff R, Luo Y, Fisher S, Fuller J, Edenson S, Lile J, Jarosinski MA, Biere AL, Curran E, Burgess T, Louis JC, Collins F, Treanor J, Rogers G, Citron M. Science. 1999;286:735–741. doi: 10.1126/science.286.5440.735. [DOI] [PubMed] [Google Scholar]
- 5.Cai H, Wang Y, McCarthy D, Wen H, Borchelt DR, Price DL, Wong PC. Nat Neurosci. 2001;4:233–234. doi: 10.1038/85064. [DOI] [PubMed] [Google Scholar]
- 6.Welzel AT, Maggio JE, Shankar GM, Walker DE, Ostaszewski BL, Li S, Klyubin I, Rowan MJ, Seubert P, Walsh DM, Selkoe D. J Biochemistry. 2014;53:3908–3921. doi: 10.1021/bi5003053. [DOI] [PMC free article] [PubMed] [Google Scholar]
- 7.Kaneko N, Yamamoto R, Sato TA, Tanaka K. Proc Jpn Acad, Ser B. 2014;90:104–117. doi: 10.2183/pjab.90.104. [DOI] [PMC free article] [PubMed] [Google Scholar]
- 8.Haass C, Schlossmacher MG, Hung AY, Vigo-Pelfrey C, Mellon A, Ostaszewski BL, Lieberburg I, Koo EH, Schenk D, Teplow DB, Selkoe D. J Nature. 1992;359:322–325. doi: 10.1038/359322a0. [DOI] [PubMed] [Google Scholar]
- 9.Haass C, Selkoe D. J Cell. 1993;75:1039–42. doi: 10.1016/0092-8674(93)90312-e. [DOI] [PubMed] [Google Scholar]
- 10.Gowing E, Roher AE, Woods AS, Cotter RJ, Chaney M, Little SP, Ball MJ. J Biol Chem. 1994;2691:10987–10990. [PubMed] [Google Scholar]
- 11.Larner A. J Neurobiol Aging. 1999;20:65–69. doi: 10.1016/s0197-4580(99)00014-7. [DOI] [PubMed] [Google Scholar]
- 12.Portelius E, Olsson M, Brinkmalm G, Ruetschi U, Mattsson N, Andreasson U, Gobom J, Brinkmalm A, Holtta M, Blennow K, Zetterberg H. J Alzheimer's Dis. 2013;33:85–93. doi: 10.3233/JAD-2012-120994. [DOI] [PubMed] [Google Scholar]
- 13.Portelius E, Andreasson U, Ringman JM, Buerger K, Daborg J, Buchhave P, Hansson O, Harmsen A, Gustavsson MK, Hanse E, Galasko D, Hampel H, Blennow K, Zetterberg H. Mol Neurodegener. 2010;5:2. doi: 10.1186/1750-1326-5-2. [DOI] [PMC free article] [PubMed] [Google Scholar]
- 14.Portelius E, Westman-Brinkmalm A, Zetterberg H, Blennow K. J Proteome Res. 2006;5:1010–1016. doi: 10.1021/pr050475v. [DOI] [PubMed] [Google Scholar]
- 15.Bros P, Delatour V, Vialaret J, Lalere B, Barthelemy N, Gabelle A, Lehmann S, Hirtz C. Clin Chem Lab Med. 2015;53:1437–4331. doi: 10.1515/cclm-2014-1048. [DOI] [PubMed] [Google Scholar]
- 16.Portelius E, Brinkmalm G, Tran AJ, Zetterberg H, Westman-Brinkmalm A, Blennow K. Neurodegener Dis. 2009;6:87–94. doi: 10.1159/000203774. [DOI] [PubMed] [Google Scholar]
- 17.Shankar GM, Walsh DM. Mol Neurodegener. 2009;4:48–60. doi: 10.1186/1750-1326-4-48. [DOI] [PMC free article] [PubMed] [Google Scholar]
- 18.Cohen SI, Linse S, Luheshi LM, Hellstrand E, White DA, Rajah L, Otzen DE, Vendruscolo M, Dobson CM, Knowles TP. Proc Natl Acad Sci U S A. 2013;110:9758–9763. doi: 10.1073/pnas.1218402110. [DOI] [PMC free article] [PubMed] [Google Scholar]
- 19.Cohen SIA, Arosio P, Presto J, Kurudenkandy FR, Biverstal H, Dolfe L, Dunning C, Yang X, Frohm B, Vendruscolo M, Johansson J, Dobson CM, Fisahn A, Knowles TP, Linse S. Nat Struct Mol Biol. 2015;22:207–213. doi: 10.1038/nsmb.2971. [DOI] [PMC free article] [PubMed] [Google Scholar]
- 20.Arosio P, Cukalevski C, Frohm B, Knowles TPJ, Linse S. J Am Chem Soc. 2014;136:219–225. doi: 10.1021/ja408765u. [DOI] [PubMed] [Google Scholar]
- 21.Arosio P, Knowles TPJ, Linse S. Phys Chem Chem Phys. 2015;17:7606–7618. doi: 10.1039/c4cp05563b. [DOI] [PMC free article] [PubMed] [Google Scholar]
- 22.Meisl G, Yang X, Hellstrand E, Frohm B, Kirkegaard JB, Cohen SI, Dobson CM, Linse S, Knowles TP. Proc Natl Acad Sci U S A. 2014;111:9384–9389. doi: 10.1073/pnas.1401564111. [DOI] [PMC free article] [PubMed] [Google Scholar]
- 23.Cukalevski C, Yang X, Meisl G, Weininger U, Bernfur K, Frohm B, Knowles TPJ, Linse S. RSC Chemical Science. 2015;6:4215–4233. doi: 10.1039/c4sc02517b. [DOI] [PMC free article] [PubMed] [Google Scholar]
- 24.Xiao Y, Ma B, McElheny D, Parthasarathy S, Long F, Hoshi M, Nussinov R, Ishii Y. Nat Struct Mol Biol. 2015;22:499–505. doi: 10.1038/nsmb.2991. [DOI] [PMC free article] [PubMed] [Google Scholar]
- 25.Pike CJ, Overman MJ, Cotman CW. J Biol Chem. 1995;270:23895–23898. doi: 10.1074/jbc.270.41.23895. [DOI] [PubMed] [Google Scholar]
- 26.D'Arrigo C, Tabaton M, Perico A. Biopolymers. 2009;91:861–873. doi: 10.1002/bip.21271. [DOI] [PubMed] [Google Scholar]
- 27.Galante D, Corsaro A, Florio T, Vella S, Pagano A, Sbrana F, Vassalli M, Perico A, D'Arrigo C. Int J Biochem Cell Biol. 2012;44:2085–2093. doi: 10.1016/j.biocel.2012.08.010. [DOI] [PubMed] [Google Scholar]
- 28.Walsh DM, Thulin E, Minogue A, Gustavsson T, Pang E, Teplow DB, Linse S. FEBS J. 2009;276:1266–1281. doi: 10.1111/j.1742-4658.2008.06862.x. [DOI] [PMC free article] [PubMed] [Google Scholar]
- 29.Andreasson C, Fiaux J, Rampelt H, Mayer MP, Bukau B. J Biol Chem. 2008;283:8877–8884. doi: 10.1074/jbc.M710063200. [DOI] [PubMed] [Google Scholar]
- 30.Meisl G, Kirkegaard JB, Arosio P, Vendruscolo M, Dobson CM, Linse S, Knowles TP. J Nature Protocols. 2015 doi: 10.1038/nprot.2016.010. in press. [DOI] [PubMed] [Google Scholar]
- 31.Cohen SIA, Vendruscolo M, Dobson CM, Knowles TP. J J Chem Phys. 2011;135:065106. doi: 10.1063/1.3608917. [DOI] [PMC free article] [PubMed] [Google Scholar]
- 32.Walsh DM, Lomakin A, Benedek GB, Condron MM, Teplow DB. J Biol Chem. 1997;272:22364–22372. doi: 10.1074/jbc.272.35.22364. [DOI] [PubMed] [Google Scholar]
- 33.Mc Donald JM, O'Malley TT, Liu W, Mably AJ, Brinkmalm G, Portelius E, Wittbold WM, Frosch MP, Walsh DM. Alzheimer's Dementia. 2015 doi: 10.1016/j.jalz.2015.01.005. [DOI] [PMC free article] [PubMed] [Google Scholar]
- 34.Feinberg H, Saldanha JW, Diep L, Goel A, Widom A, Veldman GM, Weis WI, Schenk D, Basi GS. Alzheimer's Res Ther. 2014;6:31. doi: 10.1186/alzrt261. [DOI] [PMC free article] [PubMed] [Google Scholar]
- 35.Linse S, Linse B. J Am Chem Soc. 2007;129:8481–8486. doi: 10.1021/ja070386e. [DOI] [PubMed] [Google Scholar]
- 36.Linse B, Linse S. Mol BioSyst. 2011;7:2296–2303. doi: 10.1039/c0mb00321b. [DOI] [PubMed] [Google Scholar]
- 37.Hellstrand E, Boland B, Walsh DM, Linse S. ACS Chem Neurosci. 2010;1:13–18. doi: 10.1021/cn900015v. [DOI] [PMC free article] [PubMed] [Google Scholar]
- 38.Cohen SI, Vendruscolo M, Dobson CM, Knowles TP. J Mol Biol. 2012;421:160–171. doi: 10.1016/j.jmb.2012.02.031. [DOI] [PubMed] [Google Scholar]
- 39.Hardy J, Selkoe D. J Science. 2002;297:353–356. doi: 10.1126/science.1072994. [DOI] [PubMed] [Google Scholar]
- 40.Neve RL, McPhie DL, Chen Y. Brain Res. 2000;886:54–66. doi: 10.1016/s0006-8993(00)02869-9. [DOI] [PubMed] [Google Scholar]
- 41.Moore S, Evans LDB, Andersson T, Portelius E, Smith J, Dias TB, Saurat N, McGlade A, Kirwan P, Blennow K, Hardy J, Zetterberg H, Livesey F. J Cell Rep. 2015;11:689–696. doi: 10.1016/j.celrep.2015.03.068. [DOI] [PMC free article] [PubMed] [Google Scholar]
- 42.Cantlon A, Sala Frigerio CS, Walsh DM. J Alzheimer's Dis Parkinson's Dis. 2015;2:12–24. doi: 10.13188/2376-922X.1000009. [DOI] [PMC free article] [PubMed] [Google Scholar]
- 43.Portelius E, Dean RA, Andreasson U, Mattsson N, Westerlund A, Olsson M, Demattos RB, Racke MM, Zetterberg H, May PC, Blennow K. Alzheimer's Res Ther. 2014;6:75. doi: 10.1186/s13195-014-0075-0. [DOI] [PMC free article] [PubMed] [Google Scholar]
- 44.Balbach JJ, Petkova AT, Oyler NA, Antzutkin ON, Gordon DJ, Meredith SC, Tycko R. Biophys J. 2002;83:1205–1216. doi: 10.1016/S0006-3495(02)75244-2. [DOI] [PMC free article] [PubMed] [Google Scholar]
- 45.Bertini I, Gonnelli L, Luchinat C, Mao JF, Nesi A. J Am Chem Soc. 2011;133:16013–16022. doi: 10.1021/ja2035859. [DOI] [PubMed] [Google Scholar]
- 46.Colvin MT, Silvers R, Frohm B, Su Y, Linse S, Griffin RG. J Am Chem Soc. 2015;137:7509–7518. doi: 10.1021/jacs.5b03997. [DOI] [PMC free article] [PubMed] [Google Scholar]
- 47.Fandrich M, Dobson CM. EMBO J. 2002;21:5682–5690. doi: 10.1093/emboj/cdf573. [DOI] [PMC free article] [PubMed] [Google Scholar]
- 48.Abeln S, Frenkel D. PLoS Comput Biol. 2008;4:e1000241. doi: 10.1371/journal.pcbi.1000241. [DOI] [PMC free article] [PubMed] [Google Scholar]
- 49.Tartaglia GG, Pawar AP, Campioni S, Dobson CM, Chiti F, Vendruscolo M. J Mol Biol. 2008;380:425–436. doi: 10.1016/j.jmb.2008.05.013. [DOI] [PubMed] [Google Scholar]
- 50.Ramirez-Alvarado M, Merkel JS, Regan L. Proc Natl Acad Sci U S A. 2000;97:8979–8984. doi: 10.1073/pnas.150091797. [DOI] [PMC free article] [PubMed] [Google Scholar]
- 51.Kad NM, Myers SL, Smith DP, Smith DA, Radford SE, Thomson NH. J Mol Biol. 2003;330:785–797. doi: 10.1016/s0022-2836(03)00583-7. [DOI] [PubMed] [Google Scholar]
- 52.Szczepankiewicz O, Cabaleiro-Lago C, Tartaglia GG, Vendruscolo M, Hunter T, Hunter GJ, Nilsson H, Thulin E, Linse S. Mol BioSyst. 2011;7:521–532. doi: 10.1039/c0mb00155d. [DOI] [PubMed] [Google Scholar]
- 53.Masino L, Nicastro G, Calder L, Vendruscolo M, Pastore A. FASEB J. 2011;25:45–54. doi: 10.1096/fj.10-161208. [DOI] [PMC free article] [PubMed] [Google Scholar]
- 54.Bader R, Seeliger MA, Kelly SE, Ilag LL, Meersman F, Limones A, Luisi BF, Dobson CM, Itzhaki LS. J Biol Chem. 2006;281:18816–18824. doi: 10.1074/jbc.M603628200. [DOI] [PubMed] [Google Scholar]
- 55.Kessler JC, Rochet JC, Lansbury PT. Biochemistry. 2003;42:672–678. doi: 10.1021/bi020429y. [DOI] [PubMed] [Google Scholar]
- 56.Hoyer W, Cherny D, Subramaniam V, Jovin TM. Biochemistry. 2004;43:16233–16242. doi: 10.1021/bi048453u. [DOI] [PubMed] [Google Scholar]
- 57.Murray IV, Giasson BI, Quinn SM, Koppaka V, Axelsen PH, Ischiropoulos H, Trojanowski JQ, Lee VMY. Biochemistry. 2003;42:8530–8540. doi: 10.1021/bi027363r. [DOI] [PubMed] [Google Scholar]
- 58.Li W, West N, Colla E, Pletnikova O, Troncoso JC, Marsh L, Dawson TM, Jakala P, Hartmann T, Price DL, Lee MK. Proc Natl Acad Sci U S A. 2005;102:2162–2167. doi: 10.1073/pnas.0406976102. [DOI] [PMC free article] [PubMed] [Google Scholar]
- 59.Lewis KA, Yaeger A, deMartino GN, Thomas PJ. J Bioenerg Biomembr. 2010;42:85–95. doi: 10.1007/s10863-009-9258-y. [DOI] [PMC free article] [PubMed] [Google Scholar]
- 60.Correa DHA, Ramos CH. Int J Biol Macromol. 2011;48:583–588. doi: 10.1016/j.ijbiomac.2011.01.027. [DOI] [PubMed] [Google Scholar]
- 61.Cukalevski R, Boland B, Frohm B, Thulin E, Walsh D, Linse S. ACS Chem Neurosci. 2012;3:1008–1016. doi: 10.1021/cn300073s. [DOI] [PMC free article] [PubMed] [Google Scholar]
Associated Data
This section collects any data citations, data availability statements, or supplementary materials included in this article.