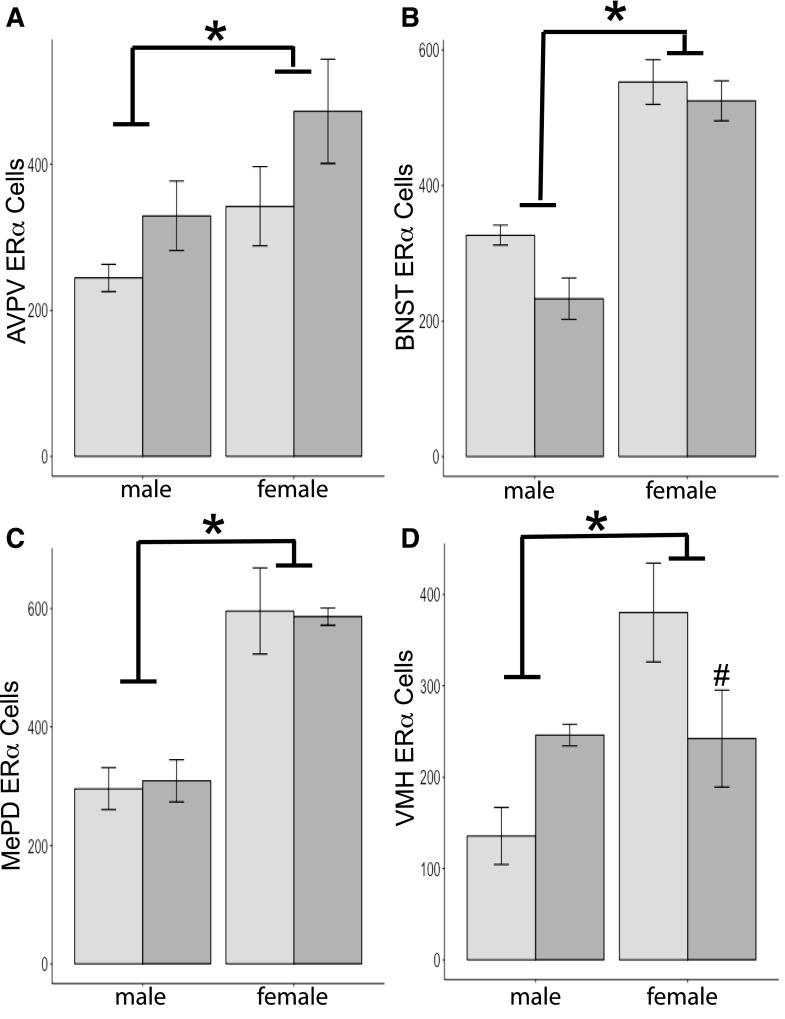
Figure 3.
Mean + SEM ERα cells quantified in F1 brains of mice either exposed to BPA during gestation (dark-gray histograms) or controls (light-gray histograms). (A) For the AVPV, n = 4 per group, except n = 3 for control females. (B) For the BNST, n = 5 per group, except n = 4 for control males. (C) For the MePD, n = 4 for control males, n = 5 for BPA males, n = 3 for control females, and n = 2 for BPA females. (D) For the VMH, n = 3 for all groups, except n = 4 for BPA males. An asterisk signifies significant effect of sex in all regions; females had more immunoreactive cells than males (P < 0.05). A pound sign signifies significant interaction produced by differences in ERα cell numbers in BPA-exposed versus control females (P < 0.05).

