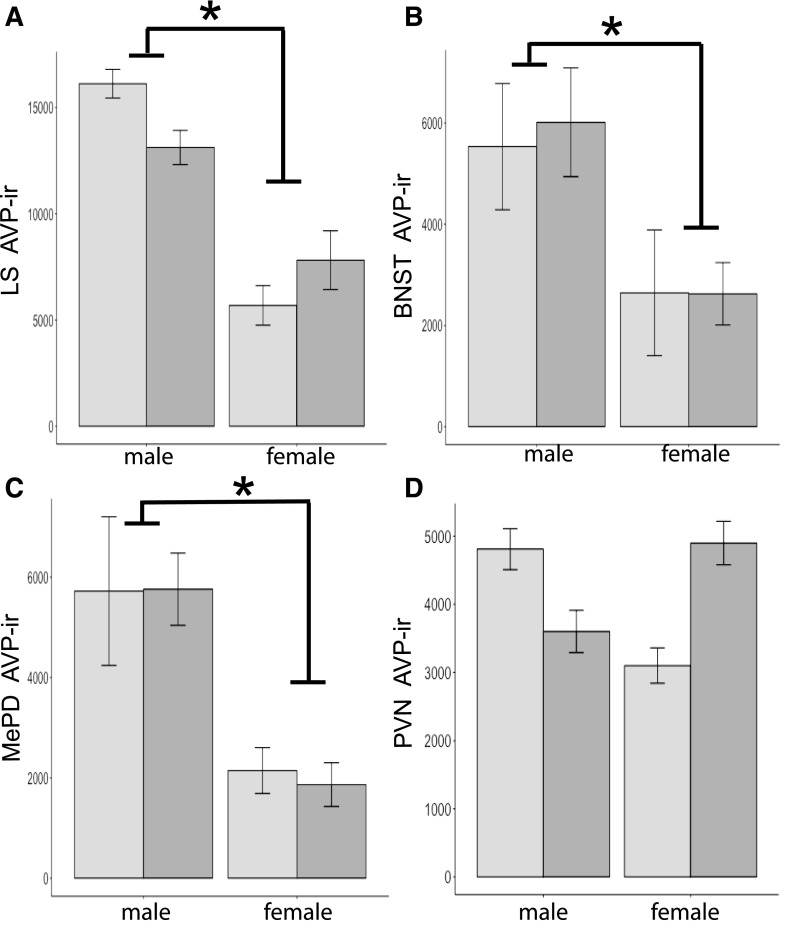
Figure 4.
Mean + SEM AVP-ir–stained area (μm2) quantified in (A) the LS (n = 10 for control males, n = 11 for BPA males and control females, and n = 13 for BPA females), (B) the BNST (n = 11 for control and males, n = 12 for control females, and n = 13 for BPA females), (C) the MePD (n = 11 for control and males, n = 9 for control females, and n = 13 for BPA females), and (D) the PVN (n = 5 in all groups, except control females, where n = 6). Mice were the F3 generation from BPA (dark-gray histograms) or control (light-gray histograms) lineages. An asterisk signifies significant sex differences; males had more immunoreactivity than females (P < 0.001).

