Abstract
We present a new one-dimensional model of gas transport in the human adult lung. The model comprises asymmetrically branching airways, and heterogeneous interregional ventilation. Our model differs from previous models in that we consider the asymmetry in both the conducting and the acinar airways in detail. Another novelty of our model is that we use simple analytical relationships to produce physiologically realistic models of the conducting and acinar airway trees. With this new model, we investigate the effects of airway asymmetry and heterogeneous interregional ventilation on the phase III slope in multibreath washouts. The model predicts the experimental trend of the increase in the phase III slope with breath number in multibreath washout studies for nitrogen, SF6 and helium. We confirm that asymmetrical branching in the acinus controls the magnitude of the first-breath phase III slope and find that heterogeneous interregional ventilation controls the way in which the slope changes with subsequent breaths. Asymmetry in the conducting airways appears to have little effect on the phase III slope. That the increase in slope appears to be largely controlled by interregional ventilation inhomogeneities should be of interest to those wishing to use multibreath washouts to detect the location of the structural abnormalities within the lung.
1. Introduction
Inert gas washouts are used to detect structural abnormalities in the lung periphery due to such conditions as asthma [1,2], cystic fibrosis [3,4] and chronic obstructive pulmonary disease [5,6]. Specifically, the slope of the latter part of the exhaled inert gas concentration versus volume washout curve; known as phase III (see Fig 15 in the Appendix for a typical washout curve), is thought to be sensitive to ventilation inhomogeneities occurring in the respiratory, or acinar, region of the lung. The rate of increase of the phase III slope observed with each subsequent breathing cycle during a multibreath washout is thought to offer additional information on the precise location of the structural abnormalities within the acinus [7].
Crawford et al. [8], showed experimentally that in healthy subjects the phase III slope divided by the mean expired concentration, SnIII, increases significantly with breath number in multibreath inert-gas washout tests. While many theories have been proposed to account for this increase in slope there is still some doubt as to the exact mechanism responsible. Verbanck and Paiva [9] proposed that it is due to heterogeneous ventilation, while Tawhai and Hunter [10] suggested that conducting airway asymmetry is largely responsible for the increase, and Scherer et al. [11] and Cruz et al. [12] considered the role played by gas exchange.
Since it is impossible to measure acinar gas mixing in vivo, most studies of the origins of the phase III slope have relied on numerical simulation of gas transport in simplified models of the airway tree. Early models used a lumped, single pathway, approach (Scherer et al. [13] and Paiva [14]); however, these predicted zero slope in phase III. This highlights an important point: that a symmetric model of the lung is incapable of predicting the phase III slope, and hence, it is also unable to predict the increase in slope with breath number. More recent studies, using a multibranch model of the airway tree, have proved able to predict phase III slopes that are of the same order as the available experimental data (e.g., Verbanck and Paiva [9] and Tawhai and Hunter [10]). Nonetheless, as mentioned above, there remains some doubt as to the mechanism responsible for the increase in SnIII with breathing cycle number.
The objective of this work is to explore further the source of SnIII and to clarify the mechanisms responsible for the growth of the slope with breathing cycle number in multibreath nitrogen and tracer-gas washout tests. To achieve this, we have constructed a new multibranch numerical model. The novelty of our model is that we have employed a modified version of the regular branching asymmetry model of Majumdar et al. [15] to the acinus. With our acinus model, we can create physiologically realistic model acini with the specification of just two parameters. We have also used the branching model of Majumdar et al. [15], without modification, to define asymmetry in the conducting airways. Our model differs from that of Verbanck and Paiva [9] in that we use a multi-branch, asymmetric, conducting airway model, whereas they used a lumped model of the conducting airways. Our model also differs from that of Tawhai and Hunter [10] in that we use a full, multibranch, asymmetric acinus model whereas they used a lumped model of the acinus. This new model allows precise control of the amount and type of asymmetry in both the conducting and acinar airways, which we use to access the influence on SnIII of airway asymmetry in the conducting and acinar airways, both individually and in combination. The model also simulates heterogeneous interregional ventilation.
2. Background
The respiratory tract is a dichotomously branching structure within which terminal ducts appear in generations 21 to 27 [16]. Gas exchange occurs in the lung at the surfaces of the millions of tiny sacs, or alveoli, which form the respiratory region of the lung. The alveoli are usually found in generations 15 and above [16].
In broad terms, oxygen reaches the alveoli in two stages. Namely, it is carried from the mouth to the respiratory region of the lung, the pulmonary acinus, by the bulk motion of the air (convection) at which point it is transported to the alveolar surfaces by molecular diffusion. As the rate of molecular transport is fixed by the diffusivity of oxygen in air, the lung’s architecture has evolved to ensure that the distance over which the oxygen molecules are transported by molecular diffusion is sufficiently short to be traversed in one breathing cycle. In the following, we first discuss lung ventilation; we then describe the washout of an inert tracer gas and the creation of the phase III slope, which leads to an explanation of why symmetric models cannot produce a phase III slope; we next discuss some past models, including those focused on the effects of gas exchange; and we end with a summary.
2.1. Lung Ventilation.
The volume flow rate in an airway depends only on the size of the air volume distal to the duct, Vdistal, and on how that volume changes in time. That is, Q = df /.dt, where is some reference value (the distal volume at functional residual capacity (FRC) for instance). The function f describes how the distal volume changes over the breathing period. Factors that control how the distal volume changes in time include, the material properties of the lung structure; surface tension due to the surfactant layer on the alveolar surfaces; and the effects of gravity. If we assume, as a first approximation, that f is the same in all regions of the lung; that is, if all factors controlling expansion are identical throughout the lung, then the lung is said to be homogeneously ventilated. In this case, for all ducts. If, as seems more likely, f varies from one part of the lung to another, then the lung is said to be heterogeneously ventilated. Heterogeneous ventilation may be classified as either interregional; i.e., the function f varies between lobes, or intraregional; i.e., the function f varies between individual acini, or groups of acini, in the same lobe. Studies on heterogeneous ventilation have largely focused on the effects of gravity. While, evidence of gravity-induced interregional heterogeneous ventilation has been reported [17,18], the evidence for the existence of gravity-induced intraregional heterogeneous ventilation is less compeling [17,18]. It is important to note that even if the air volume distal of two parallel, homogeneously-ventilated, ducts is identical, the bulk velocity, U = Q/A, of the air in each duct would still be different unless their cross-sectional areas were also identical. That is, the velocities in parallel ducts will only be equal if the ratio of distal volume to duct cross-sectional area is the same for both ducts. In general, this is not the case in an asymmetrically branching airway tree.
2.2. Creation of the Phase III Slope.
At the end of exhalation, the lung contains some residual air. In this section, we describe how the concentration of an inert tracer gas suspended in the residual air changes over exhalation. In the context of a one-dimensional approximation (i.e., no cross-stream variation), the front separating the inhaled air, which has no tracer gas, from the residual air, which contains tracer gas, travels along an airway at the local bulk velocity, U. Consequently, the front can travel at different speeds in different parts of the same acinar generation, even if the acinus is homogeneously ventilated. Hence, at the end of inspiration, the front will be relatively further away from the acinus entrance in pathways leading to terminal ducts located in higher numbered generations and relatively closer to the acinus entrance in pathways leading to terminal ducts located in lower numbered generations. Also, the inert gas in the terminal ducts at the end of the shorter pathways will have more time to mix with the inhaled air than that in the terminal ducts at the end of the longer pathways. The front takes longer to arrive at the more peripheral ducts because the average bulk velocity reduces from one generation to the next by the ratio of the cross-sectional area of the parent duct to the sum of the cross-sectional areas of daughter ducts, which is, on average, about 60% [16]. Furthermore, the shorter pathways will tend to have higher tracer-gas concentration gradients, and hence, a greater rate of tracer-gas diffusion than the longer pathways. Consequently, the closer the terminal ducts are to the acinar entrance, the lower their tracer-gas concentration will be at the end of inspiration. We note that the front separating the air with no tracer gas from that with tracer gas will not be a distinct line by the end of inspiration. This is because some of the tracer gas in the residual air will diffuse into the inhaled air thus blurring the line between the two. In exhalation, the air in the lung is expelled sequentially. That is, the gas with the highest concentration; i.e., that in the more distal terminal ducts, is exhaled last. It is noteworthy that all throughout exhalation, diffusion in the distal part of the acinus is making the tracer-gas concentration in the periphery more homogeneous but over normal exhalation times, and without breath holds between inspiration and exhalation, there is insufficient time for diffusion to equalize the concentration in the terminal ducts. Hence, the tracer-gas concentration at the trachea increases throughout exhalation, ending with a roughly constant slope in phase III (see Fig 15 in the Appendix).
2.3. Symmetric Models.
The above highlights the reason why a symmetric model acinus cannot produce a phase III slope. Specifically, in a symmetric model, in which all terminal ducts reside in the same generation, the interface separating the inhaled air from the residual air would also be located in one generation. Hence, the air in each terminal duct would have the same value of concentration and therefore the slope in phase III, which represents conditions that existed in the peripheral airways, would be zero. Also, while the concentration in each generation of the acinus at the start of the next inhalation would be different from that before the first breath, there would not be any difference in concentration in the ducts of any one generation. Hence, the phase III slope would always be predicted to be zero, regardless of breath number.
2.4. Past Models.
It is generally agreed that asymmetry in the branching pattern of the acinar airways controls the size of the first-breath phase III slope (see, for instance, Dutrieue et al. [19]). However, there is less unanimity on what causes the increase in phase III slope with cycle number. Verbanck and Paiva [9] constructed a multibranch model, based on the asymmetric acinar airway data of Haefeli-Bleuer and Weibel [20], that included both interregional and intraregional heterogeneous ventilation. With this model, they were able to match the trend of the increase in phase III slope seen in the data of Crawford et al. [8]. However, Tawhai and Hunter [10] noted that Verbanck and Paiva [9] were only able to match the data of Crawford et al. [8] using very large (and presumably nonphysical) differences in intraregional ventilation. Tawhai and Hunter [10] have suggested that the increase in phase III slope can be attributed mainly to asymmetry in the conducting airways. Using an anatomically-based asymmetric model of the entire conducting airway tree, a lumped parameter model of the respiratory airways, homogeneous ventilation and no gas exchange Tawhai and Hunter [10] predicted an increase in slope similar to Crawford et al. [8]. Tawhai and Hunter [10] attribute the success of their model to the asymmetry in the conducting airways supplying resident gas to the acini in a no-uniform manner.
2.5. Gas Exchange.
The effect on the phase III slope of inert gas diffusing from the blood stream has been considered by a number of groups (see for instance, Scherer et al. [11] and Cruz et al. [12]). All are agreed that gas exchange from the blood stream is important mainly in the latter stages of a multi breath washout. That is, when the concentration of the inert gas in the alveoli has dropped to such a low level that the small amount of inert gas coming from the blood becomes significant.
2.6. Summary.
While it is generally agreed that geometric asymmetry in the acinus controls the first-breath phase III slope, the mechanism responsible for the increase in slope with breath number remains unclear. This uncertainty needs to be addressed before the increase in slope with breath number can be used with any confidence to assess structural or ventilation abnormalities. In the following, we first describe our new model, and then how we used it to clarify whether the increase in slope is primarily driven by interregional ventilation inhomogeneities or by conducting airway asymmetry.
3. Models and Methods
3.1. Lung and Ventilation Model.
Following Verbanck and Paiva [9] we divide the lung into an upper and a lower region (Fig. 1). At total lung capacity (TLC) it is assumed that both regions have the same volume and that the total lung volume at TLC is 6 liters. The total lung expands linearly with time over inspiration and similarly over expiration; i.e.,
Fig. 1.
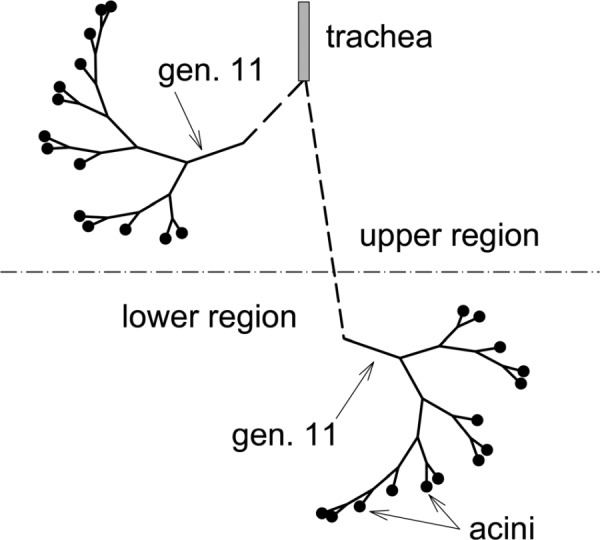
Schematic of upper and lower lung regions and asymmetrically branching conducting airway model
| (1) |
where, VFRC is the lung volume at functional residual capacity, Q = 2VT/T, VT is the tidal volume and T the breathing period.
At each instance in time, the upper and lower lung volumes (VU and VL, respectively) must equal the total lung volume and the volume flow rate entering the upper and lower regions (QU and QL, respectively) must equal the total flow rate entering the lung. Using these constraints, the volume of each lung region at time t is given as,
| (2) |
where, is the upper volume at FRC, is the tidal volume entering the upper volume over inspiration, and the volume flow rate into the upper volume at FRC. Note that while, the total volume is a linear function of time, the individual regions change parabolically with time. Further, the volume flow rate into a lung region at time t can be defined as follows,
| (3) |
Verbanck and Paiva [9] define the flow sequence between the two regions as
| (4) |
where, R = U,L
It can be shown that
| (5) |
Following Verbanck and Paiva [9], we assume VFRC = 3700 ml, = 2150 ml, = 2550 ml (hence, = 400 ml), = 1000 ml, and = 0.2. Therefore α = 0.581, β = 0.4 and γ = 0.425. Verbanck and Paiva [9] derived their values of VFRC etc. from the experimental ventilation data of Anthonisen et al. [21]. Homogeneous ventilation is recovered by setting α = β = γ = 0.5.
3.2. General Branching Scheme.
The scheme outlined below follows broadly that of Majumdar et al. [15]. We define each duct using a pair of indices (i,j). The first index, i, represents the generation number and the second index defines the duct’s position within the generation. The trachea is defined as (1,1). The diameter of each daughter duct is given as (Fig. 2)
Fig. 2.
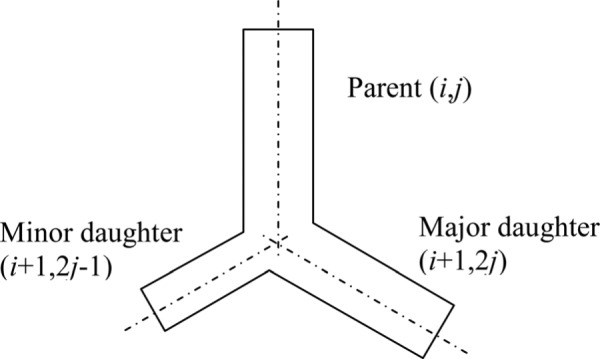
Branching notation
| (6) |
Also, it is assumed that
| (7) |
and that
| (8) |
Where is assumed fixed for all generations in the tree.
From Eqs. (6)–(8), it can be shown that
| (9) |
Using the adult human lung data of Raabe et al. [22], Majumdar et al. [15] found that r = 0.326.
3.2.1. Conducting Airways.
We defined typical conducting airway trees in the upper and lower lung regions. The trees’ branching patterns are identical and, to reduce the size of the model, each starts at generation 11 (Fig. 1). The average length and diameter of the ducts in generations 0–4 are estimated from the data of Raabe et al. [22]. Those for generations 5–11 were computed using the above scheme and setting r = 0.5. A fixed length to diameter ratio of three was also assumed for generations 5 and greater. The extent of the conducting airway tree was defined using the local Péclet number for oxygen. We define the Péclet number, of duct (i,j) as Pei; j = 4Qi; j/(πDdi; j), where D is the diffusivity of oxygen. Along any conducting airway path, the path was defined to end (in an acinus) when Pei; j ≤ 1. That is, when this condition was first met, the duct in which the condition was met was defined to be a transitional bronchiole. This scheme produces an asymmetric conducting airway model (Fig. 1) in which 14 transitional bronchioles occur over a range of generations (14 through 17), are of various diameters and have a range of volume flow rates. In the conducting airways, a value of = 3 was chosen to ensure dissipation is minimized while biological viability is maintained [15]. A symmetric branching scheme was achieved by setting r = 0.5 (and = 3). In this case, all 16 transitional bronchioles occur at generation 15.
3.2.2. Acinar Airways.
The scheme used to generate the conducting airways was also used to generate airway trees for the acini. The typical model of acinar airways given by Weibel et al. [16]was used as a guide. Inspection of this data reveals that > 3. It was found that = 7.5 (with r = 0.5) gave a reasonable approximation to the average data of Weibel et al. [16] with a value of 0.25 mm for the terminal duct in the case of symmetric branching. It is noted that = 3, is only necessary when the dominant transport mechanism is convection; that is, when it is desirable to minimize energy losses due to viscous dissipation. A terminal duct was assumed to have been reached when either Pei; j ≤ 0.01 or di; j ≤ 0.25 mm. For the asymmetric case, we used the same value of r ( = 0.326) as in the conducting airway model. This produced asymmetric acinar trees with terminal ducts occurring over a wide range of generations and acini with a range of volumes (Fig. 3). We note that the distribution and frequency of terminal branches in our model is similar to that of the anatomical data of H-B&W and that in our model and in the data of H-B&W, the average location of terminal branches in between the eight and ninth alveolar generation.
Fig. 3.
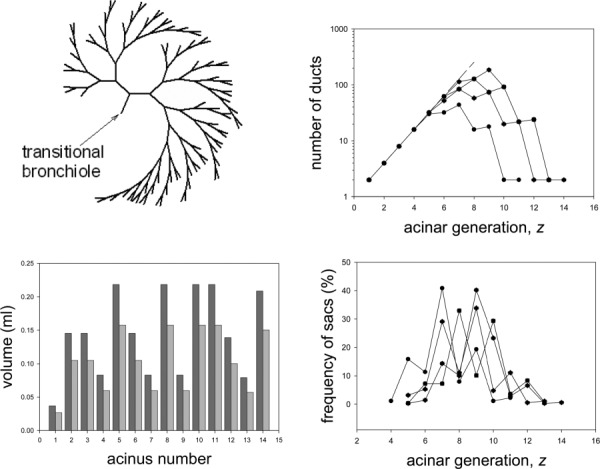
Schematic of a typical asymmetrically branching airway model acinus (shown without alveoli for clarity) (a); the number of ducts in each generation for all model acini (c); the frequency distribution of terminal ducts, or sacs, in the model acini (b); and volumes of the model acini at FRC in the upper (dark gray) and lower (light gray) egions of the lung (d)
Dutrieue et al. [19] defined the local asymmetry, A, of a bifurcation as A = 1 − V1/V2, where V1 is the smaller volume distal of the bifurcation and V2 is the lager volume. (For a symmetric bifurcation, V1 = V2, and hence, A = 0). If an acinus were to have the same number of ducts in each branch of a bifurcation, then . However, this is not the case in general because terminal ducts appear in a range of generations (Fig. 3). Hence, unfortunately, it is not possible to relate our model parameters r and to A analytically. To show the trends of how A is affected by r and , we have computed A for a range of values of r and (Fig. 4). For our choice of r = 0.326, and = 7.5, the average value of asymmetry, Aave = 0.49. Further, we find that the average asymmetry is much more sensitive to a change in r than in (Fig. 4). For example, for a change in r of ± 10% about the selected value of 0.326, Aave varied by approximately ± 14% but for a change in of ± 10% about the selected value of 7.5, Aave only varied by approximately ± 1.5%
Fig. 4.
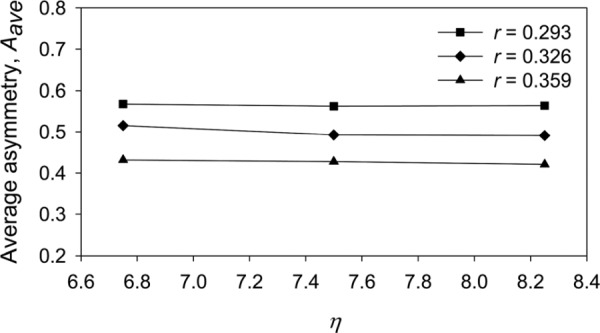
The effect of changes in bifurcation model parameters r and (see Eq. (9)) on the average asymmetry (see text for definition) of the model acinus
In the case of the symmetric tree (r = 0.5) the scheme reproduced the nine-generation acinus of Weibel et al. [8] when attached to a symmetric conducting airway tree. A hybrid model was also constructed comprising an asymmetric conducting airway tree (Fig. 1) feeding symmetric acinar trees. In this case, because of the asymmetry in the generational position of the transitional bronchioles, the symmetric acinar trees were of different volumes.
The respiratory, or alveolar, volume was distributed over the acinar airways based on the available surface area of the ducts. i.e., VA = Vacinus (SA/Sacinus), where VA and SA are the alveolar volume and surface area, respectively, of the duct, Vacinus is the total respiratory volume of the acinus, and Sacinus is the total surface area of all the ducts in the acinus. Following Weibel et al. [16], the transitional bronchiole was assumed to be 20% alveolated, the first respiratory bronchiole 40% alveolated and the second respiratory bronchiole 70% alveolated.
3.3. Ventilation Curve.
Following Crawford et al. [8], we assumed a saw-tooth ventilation curve in which one liter of gas was inhaled over a period of two seconds and then immediately exhaled over the same time period. In the case of heterogeneous filling, the volumes and the volume flow rates into the upper and lower regions were determined using equations 2 and 3, respectively, with α = 0.581, = 0.4 and = 0.425 (Fig. 5). This set of parameters approximates to the reference simulation of Verbanck and Paiva [9]. The acini were homogenously ventilated at a local level (intraregional ventilation) in that the flow into each acinus was proportional to its volume.
Fig. 5.
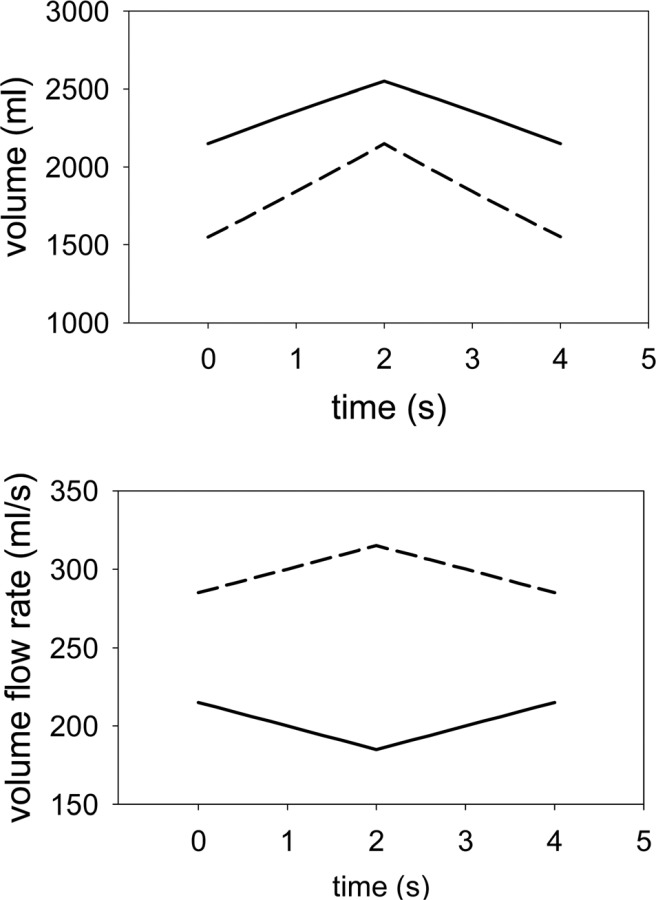
Volumes of and flow rates into the upper (solid line) and lower lung (broken line) regions for VFRC = 3700 ml and VT = 1000 ml α = 0.581, = 0.4 and = 0.425
3.4. Simulated Washout Procedure.
In the case of the nitrogen washouts, Crawford et al. [8] had their subjects breath room air for an initial period to establish a saturation concentration of nitrogen in the acinus. The subject then breathed 100% oxygen and the concentration of nitrogen was monitored over expiration for several breathing cycles. In the case of the tracer gases (SF6, and helium), the subject breathed a small amount of tracer gas mixed with air for an initial period to establish a saturation concentration of the tracer gas in the acinus. The subject than breathed air (without the tracer gas) and the concentration of the tracer gas was monitored over expiration for several breathing cycles.
Both the above washout procedures were simulated using the same initial and inlet condition; i.e., at t = 0, at the start of the first inspiration of oxygen in the case of a nitrogen washout, or the first inspiration of pure air in the case of a tracer gas washout, the concentration is set to unity throughout the model. The value of unity represents the saturation concentration of either nitrogen, or the tracer gas. The concentration at the inlet to the model conducting airways is set to zero throughout inspiration after a time offset representing the time taken for the concentration front to travel from the trachea to the entrance of the model conducting airways; i.e., toffset = V0−10/Q, where V0−10 is the volume of all ducts in generations 0–10. Over expiration, again after a time lapse of toffset, the concentration in the trachea, C0, was taken to be a weighted average of the concentrations at the entrance to upper and lower conducting airway models CU,11 and CL,11, respectively; i.e., C0 = (CU,11 QU,11 + CL,11 QL,11) /(QU,11 + QL,11), where QU,11 and QL,11 are the volume flow rates at the entrance to the upper and lower conducting airway models, respectively.
3.5. Normalized Phase III Slope.
All results will be discussed in terms of the normalized phase III slope, SnIII. Following Crawford et al. [8] we computed the phase III slope over the last 25% of the washout curve and normalized it by the mean concentration at the trachea over exhalation. The slope of the washout curve was estimated using the method of least squares.
3.6. Transport Equations and Numerical Solution.
The one-dimensional equation for transport of the concentration, C, of an inert gas can be written as
| (10) |
where A is the total flow are (duct and alveolar), Q = ADU, AD is the duct flow area, A′ is the area through which axial diffusion occurs (see Appendix and Sec. 4), U is the bulk velocity of the carrier gas in the duct, D (m2/s) is the diffusivity of the inert gas in the carrier gas, QB is the cardiac output (ml/s), λ is the inert gas solubility in blood (ml gas × (ml blood)−1), is the fraction of the total number of alveoli on the duct of length, l, and CB is the mixed venous inert blood gas concentration (Scherer et al. [11]).
The above equation was discretized using the finite volume method on an expanding grid. Convective terms were modeled using central differences. All length scales were defined to expand as the lung volume to the one-third power. The volume flow rate in each duct was determined with the aid of a discrete version of the continuity equation. As the change in volume for each duct was prescribed (Eq. (2)), the volume flow rate at the entrance plane of each duct could be computed using the continuity equation and starting at the terminal ducts, the exit planes of which were defined to be impervious. With the volume flow rates defined at the entrance planes of the terminal duct, the volume flow rates at the exit planes of their parent ducts were determined and, again invoking continuity, the volume flow rate at the entrance planes of the parent ducts could be determined. This procedure was repeated until the entrance duct was reached.
As mentioned above, the inlet boundary condition on concentration depended on the direction of gas flow. Over inspiration (for t ≥ toffset), the concentration was set to zero and over expiration (for t − T/2 ≥ toffset), the inlet concentration was set equal to the value in the first active grid cell. The inlet condition over expiration relies on the fact that the axial gradient of concentration is essentially zero over exhalation in the inlet duct; i.e., that convection dominates over diffusion. As the exit plane of each terminal duct was assumed impervious, the axial gradient of concentration was set to zero on this plane.
The resulting algebraic equation for transport was solved for CP for each cell in each duct using the Gauss-Seidel method with under-relaxation. More details on the discretization and numerical solution of the resulting equations are given in the appendix. Various grid increments and time steps were used to determine a configuration that gave solutions that were reasonably grid and time step independent. The solutions to be discussed were computed on a grid with 4 cells over the length of the shortest duct, with proportionate increases in cell numbers for the longer ducts, and a time step of T/400, where T ( = 4 s) is the breathing period.
4. Results
In the following, the “standard model” refers to the model configuration comprising an asymmetric conducting airway (Fig. 1), with r = 0.326 and = 3, feeding fourteen asymmetric acini (Fig. 3), with r = 0.326 and = 7.5, in each of the two heterogeneously ventilated lung regions, (Fig. 5).
Initial calculations were performed for a single breath with A′ = AD. It was found that the standard model produced excessively large values of first-breath phase III slope,S1III, particularly for SF6. Through a process of trial and error, it was found that S1III could be reduced if the area through which the gas was assumed to diffuse; i.e., A′ in Eq. (10), was increased somewhat (see Appendix for rational). That is, we set where VA is the alveolar volume associated with a duct and lD is the length of the duct. A value of = 0.5 was found to give reasonable values of first-breath phase III slope, S1III, for all three gasses (Fig. 6). It is noted that as the transport equation (Eq. (10)) is cast in terms of the volume flow rate, Q, the above change to A′ only affects the diffusive transport; that is, the convective velocity is not affected.
Fig. 6.
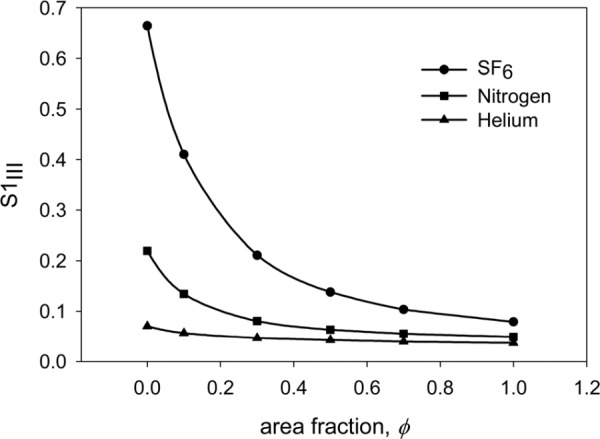
Variation of first-breath phase III slope, S1III, for nitrogen, helium and SF6 with , the fraction of the area associated with the alveolar volume, which is added to the duct flow area. See text for definition of .
With the value of selected, we then explored the effect on the predicted phase III slope of the bifurcation model parameters r and . As would be expected from the results of our study on the effects of these parameters on the asymmetry of the model acinus (Fig. 4), S1III was, in general, more affected by a change in r than in (Fig. 7). We note that a decrease in r (and hence an increase in the level of acinar asymmetry) increase the value of S1III for all three gases. Hence, increasing r above the selected value of 0.326 moves the predicted value of S1III closer to the experimental value of Crawford et al. [8] for helium, but further away for nitrogen and SF6. Conversely, decreasing r moves the predicted value of S1III closer to the experimental value of Crawford et al. [8] for SF6, but further away for nitrogen and helium. Hence, the values of r and selected for the standard model acinus can be seen as a reasonable compromise between conflicting trends.
Fig. 7.
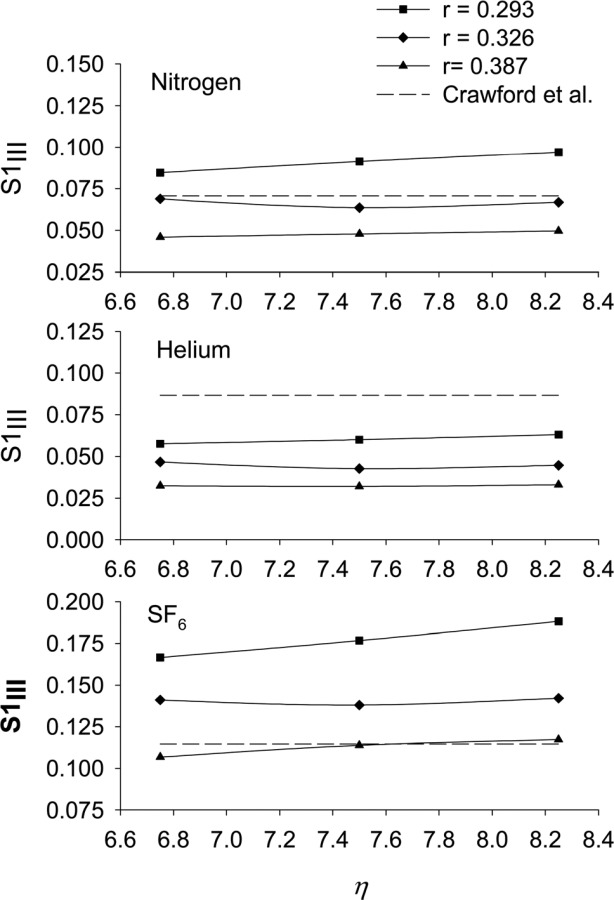
The effect of changes in bifurcation model parameters r and (see Eq. (9)) on the predicted value of the first-breath phase III slope, S1III, for nitrogen, helium, and SF6. Included for reference are the experimental values of S1III due to Crawford et al. [8]
The final check on the model was to consider the effect on the increase in SnIII with breath number of changes in the three parameters (α, , and ) defining the ventilation curve (Eq. (2)). For this exercise, we considered a ten-breath washout of nitrogen (Fig. 8). It was found that the rate of increase of SnIII with breath number increased if was decreased from its reference value of 0.581; if was increased from its reference value of 0.4; or if the flow sequence factor, FSU/ L (Eqn. 4), was increased from its reference value of 0.2. That FSU/ L and have similar effects on the rate of increase of SnIII with breath number would be expected from Eq. (5). Also, we see from Eq. (3), that increasing either FSU/ L or , while keeping fixed, results in the lung volumes changing with time in a more strongly parabolic manner. The results given in Fig. 8 would appear to suggest that the optimal value of α and for increasing the rate of increase of SnIII with breath number is 0.5, at least for the chosen ventilation curve, but in order to better compare with previous results [9], and because there is experimental evidence [21] supporting these values, we performed the remaining calculations with α = 0.581 and = 0.4 (and FSU/ L = 0.2).
Fig. 8.
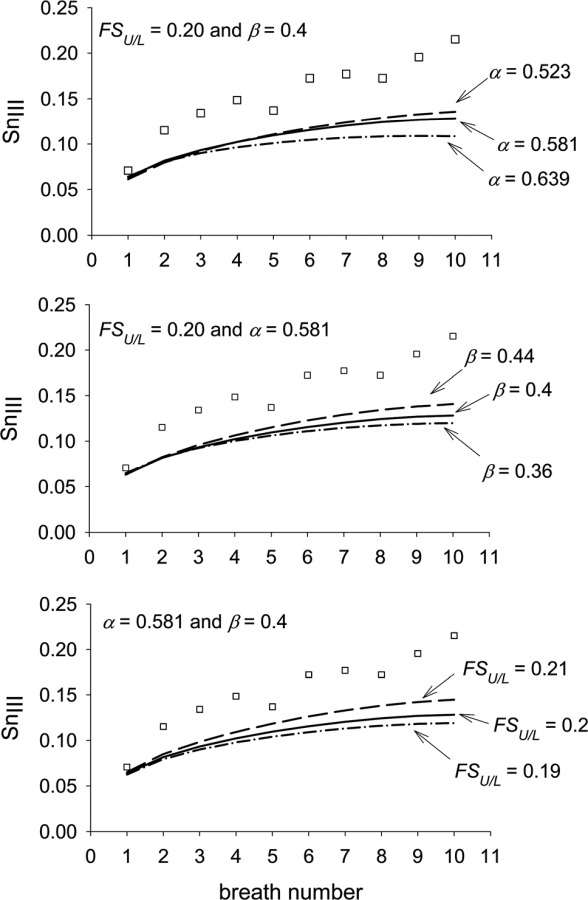
Effect of various combinations of ventilation parameters on SnIII with breath number for nitrogen. where is the volume of the upper lung region at FRC; where is the tidal volume entering the upper lung region; and FSU/L = flow sequence factor between the upper and lower regions (see Eq. (4). [□] = experimental data of Crawford et al. [8]
Using the standard model geometry, we first simulated a ten-breath washout of nitrogen (Fig. 9). Three variations of the model were considered. The first, with an area fraction, = 0.5 and no gas exchange, predicted well the first breath value of SnIII compared to the data of Crawford et al. [8]. Nonetheless, the model somewhat under predicts the increase in SnIII with breath number. The second variation, with = 0.5 and gas exchange, showed that gas exchange made little difference to the predicted curve, at least not for the first ten breathing cycles. The third variation, with = 1.0 and no gas exchange shows that the reduction in SnIII with increasing seen in Fig. 6 for the first breath continues throughout the ten cycles. For comparison, the predictions of Verbanck and Paiva [9] and Tawhai and Hunter [10] for nitrogen were also included in Fig. 9.
Fig. 9.
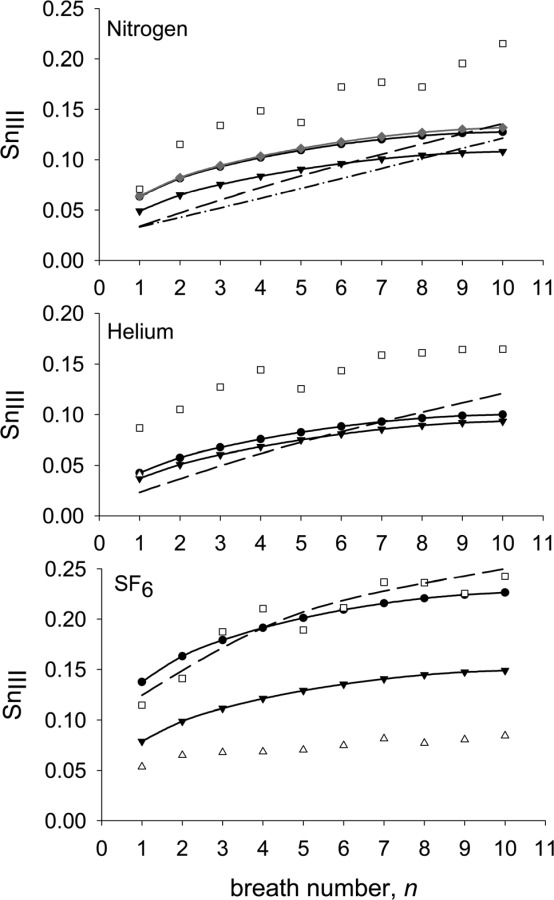
Predicted variation of SnIII with breath number for nitrogen, helium and SF6 ( , = 0.5 and no gas exchange;
  , = 0.5 and gas exchange;
  , = 1.0 and no gas exchange) compared to the experimental data of Crawford et al. [8](□) and of Grönkvist et al. [18] (Δ), and the predictions of Verbanck and Paiva [9] (- - -) (taken from Fig. 6 of that publication) and Tawhai and Hunter [10] (-. -) (taken from Fig. 3 of that publication and representing their LPA-ACA model with gas exchange). See text for definition of .
We next calculated two ten-breath washouts of SF6 (Fig. 9): one with an area fraction, = 0.5 and one with = 1.0. In the case with = 0.5, the predictions matched well the data of Crawford et al. [8]. As expected, the case with = 1.0 predicted a curve that was below that of the curve for = 0.5 but both had roughly the same increase in SnIII with cycle number. For comparison, the experimental data of Grönkvist et al. [18] and the prediction of Verbanck and Paiva [9] for SF6 were included in Fig. 9. The large differences apparent in the experimental data of Crawford et al. [8] and of Grönkvist et al. [18] will be discussed in the next section.
We then repeated the above calculations for helium; that is, we calculated a ten-breath washout of helium with an area fraction, = 0.5 and another with = 1.0 (Fig. 9). As expected from the results presented in Fig. 6, both values of gave similar results. In both cases, the predicted curves fell well below the experimental data of Crawford et al. [8]. However, the predictions matched well, the first breath value of SnIII reported by Grönkvist et al. [18] (only first-breath values of SnIII were reported for helium). For comparison, the prediction of Verbanck and Paiva [9] for helium was included in Fig. 9.
In order to explore further the effects of the various features of the model on SnIII and on its increase with cycle number we ran a series of computations for nitrogen with various features of the model either removed or changed. First, we switched from heterogeneous interregional ventilation (Fig. 10, curve (a)) to homogeneous ventilation (Fig. 10, curve (b)). We found that the first-breath SnIII was reduced by 18% and, of more importance, the increase in slope with cycle number reduced considerably after the second breath to the extent that at breath 10, SnIII for the homogeneously ventilated model was 44% lower than that for the heterogeneously ventilated case.
Fig. 10.
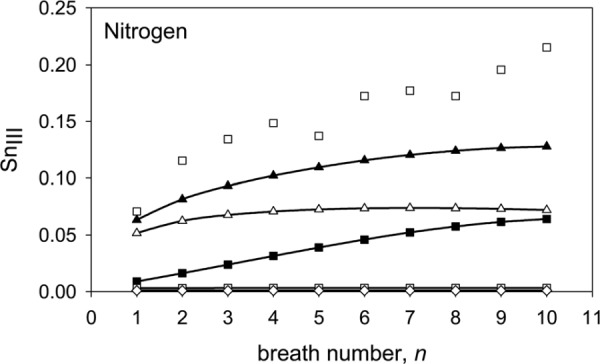
Predicted variation of SnIII with breath number for nitrogen for various configurations of the model. (a)  , asymmetric conducting airways (r = 0.326, = 3), asymmetric acinar airways (r = 0.326, = 7.5), and heterogeneous interregional ventilation (α = 0.581, = 0.4 and = 0.425); i.e., the standard model. (b) - - asymmetric conducting airways (r = 0.326, = 3), asymmetric acinar airways (r = 0.326, = 7.5), and homogeneous ventilation (α = = = 0.5). (c) -■- asymmetric conducting airways(r = 0.326, = 3), symmetric acinar airways (r = 0.5, = 7.5) and heterogeneous interregional ventilation (α = 0.581, = 0.4 and = 0.425). (d) -□- asymmetric conducting airways (r = 0.326, = 3), symmetric acinar airways (r = 0.5, = 7.5) and homogeneous ventilation (α = = = 0.5). (e) - - symmetric conducting airways (r = 0.5, = 3), symmetric acinar airways (r = 0.5, = 7.5) and homogeneous interregional ventilation (α = = = 0.5). Experimental data (□) taken from Fig. 3 of Crawford et al. [8]. (All above predictions had = 0.5 and no gas exchange.)
We next considered the effect of the asymmetry of the acinar airways. We first computed the washout, over ten cycles, for the heterogeneously ventilated case of an asymmetric conducting airway feeding symmetric acini (Fig. 10, curve (c)) and found that the first-breath SnIII reduced to 0.009 l − 1 (from 0.063 l−1, for the standard model). Nevertheless, the increase in SnIII with cycle number was comparable to that for the standard model. When we switched from heterogeneous interregional ventilation to homogeneous ventilation, using the same geometry, the increase in slope with cycle number completely disappeared (Fig. 10, curve (d)).
Finally, as expected, the homogeneously ventilated, symmetric conducting and acinar airway model predicted essentially zero SnIII for all breaths (Fig. 10, curve (e)).
5. Discussion
Our calculations confirm that asymmetric branching of the acinar airways largely controls the magnitude of SnIII. Our results also suggest that the asymmetric branching acinus model produced using the scheme due to Majumdar et al. [15] with increase to 7.5, appears to be a sufficiently accurate representation of the actual acinar airway geometry as it produces value of first-breath SnIII for nitrogen and SF6 in reasonable agreement with the experimental data of Crawford et al. [8]. While our model does less well in predicting the value of first-breath SnIII for helium given by Crawford et al. [8] it does match well the experimental data of Grönkvist et al. [18].
The difference in the value of SnIII between two tracer gases of greatly differing diffusivities; such as, SF6 and helium, is of interest because it is thought to provide information on the distribution of ventilation in the lung periphery [18]. Our model predicts the difference between the first-breath SnIII for SF6 and that of helium as 0.095 l−1 (with = 0.5); Verbanck and Paiva [9] give a difference of approximately 0.099 l−1; and Tawhai and Hunter [10] a difference of approximately 0.063 l−1. Conversely, Crawford et al. [8] give the difference between the first-breath SnIII for SF6 and that for helium as approximately 0.028 l−1. The difference between the first-breath SnIII for SF6 and that for helium in the data of Grönkvist et al. [18] is 0.013 l−1 (standing, VT = 1000 ml).
From the above, it is evident that current numerical models over predict the difference between the first-breath SnIII for SF6 and that for helium. Federspiel and Fredberg [23] showed theoretically and Tsuda et al. [24] confirmed experimentally that in straight alveolated ducts the effective axial dispersion coefficient, D*, of a gas can differ from its molecular value, D, depending on the local value of the Péclet number, Pe; specifically, for small Pe, D*/D < 1 and for large Pe, D*/D > 1. It is possible that in the part of the acinus in which the interaction between convection and diffusion occurs, which is thought to be the entrance region of the acinus, this mechanism preferentially increases the effective diffusivity of SF6, as Pe for SF6 would be roughly six times larger than that for helium. In this regard, we note that if we set = 1.0 in our model, which has the effect of increasing diffusive transport, we predict the difference between the first-breath SnIII for SF6 and that for helium to be 0.042 l−1; i.e., less than half that predicted with = 0.5. Further, as outlined in the appendix, the one-dimensional approximation used in this and other models cannot be applied precisely at bifurcations. This and other three-dimensional features of the actual acinar flow may play a role in adjusting the effective diffusivity of the tracer gases.
Our results also appear to confirm the finding of Verbanck and Paiva [9] that heterogeneous interregional ventilation is the main factor controlling the increase of SnIII with cycle number. We base this conclusion on the fact that heterogeneously ventilating a model comprising symmetric-branching acini of unequal volumes fed by asymmetrically branching conducting airways (Fig. 10, curve (c)) can produce a curve of SnIII with cycle number that has a slope similar to that of the experimental data. The curve is shifted down from the experimental curve, however, because of the small value of SnIII for the first breath. This is expected because, as discussed above, the value of the first-breath SnIII appears to be controlled by the asymmetry in the model acini. Also, the same geometric model (asymmetric conducting airways and symmetric acinar airways) when ventilated homogeneously does not produce a slope for the curve of SnIII with cycle number (Fig. 10, curve (d)). Hence, it is concluded that it is the heterogeneous interregional ventilation that is producing the increase in slope and not the symmetric acini of unequal volumes.
The above is contrary to the results of Tawhai and Hunter [10] who concluded that asymmetry in the conducting airways made a significant contribution to first-breath SnIII and its subsequence increase with cycle number. The configuration of our model that most closely mirrors that of the model of Tawhai and Hunter [10] is the case of asymmetric conducting airways and symmetric acinar airways with homogeneous ventilation (Fig. 10, curve (d)). As mentioned above, in this configuration, our model predicted a near-zero value of SnIII for all cycle numbers.
Our model of ventilation is the same as that of Verbanck and Paiva [9] at the interregional level but differs at the intraregional level (i.e., the acinar level). Within each acinus our model is homogeneously ventilated. That is, at each acinar bifurcation, the flow is divided in proportion to the volume distal of the two daughter ducts. In the model of Verbanck and Paiva [9] intraregional ventilation is imposed, somewhat arbitrarily. This difference in intraregional ventilation might explain why our model gives a smaller increase in SnIII with cycle number than the model of Verbanck and Paiva [9].
Compared to the experimental data of Crawford et al. [8], our model under predicts the increase in SnIII with cycle number, particularly for nitrogen. To the best of the authors’ knowledge, the data of Crawford et al. [8] is the only published study of multibreath nitrogen washouts. Again, to the best of the authors’ knowledge, the only other published study of multibreath wash-outs is that for SF6 by Grönkvist et al. [18]. As Crawford et al. [8] also published multibreath data for SF6, it is instructive to compare these two data sets when trying to match multibreath predictions to experimental data. We see (Fig. 9) that both the first breath value of SnIII for SF6 and its increase with cycle number are noticeably smaller in the data of Grönkvist et al. [18] than those reported in Crawford et al. [8]. While differences in experimental setup might explain the difference in reported values of first-breath SnIII for SF6, it is harder to explain the significant difference in the increase in SnIII with breath number seen between the data of Grönkvist et al. [18] and that of Crawford et al. [8].
Obviously, the limited experimental data and above differences in experimental data hinders the development of accurate numerical models of multibreath washouts. As shown in the Appendix, a one-dimensional model of the transport of the concentration of an inert gas in the bifurcating respiratory airways of the human lung includes many assumptions and approximations. Without a wealth of detailed, reliable, experimental data, it is hard to differentiate errors due to the numerical approximations from those due to transport mechanisms either not included, or, inadequately modeled.
6. Conclusion
Using a new model that incorporates a modified version of the asymmetric branching scheme of Majumdar et al. [15], we have predicted the experimental trend of the increase in the normalized phase III slope with breath number in multibreath washout studies for nitrogen, SF6 and helium. We have confirmed that asymmetry in the acinar airways controls the magnitude of the phase III slope. Further, we found that heterogeneous interregional ventilation controls the increase of phase III slope with breath number and that asymmetry in the conducting airways has little effect on the increase in slope. This finding should be of interest to those wishing to use multibreath washouts to detect the location of the structural abnormalities within the lung periphery. We also confirmed that gas exchange has little effect on SnIII for the first ten breaths. All current models over predict the experimentally found difference between SnIII for the two tracer gases, SF6 and helium. This is obviously one area that needs further investigation. Another area that needs to be addressed if numerical models are to be improved is the current paucity of experimental data with which to verify the numerical predictions.
Acknowledgment
This study was supported by NIH Grant No. R01 HL054062.
Appendix: Discretization and Numerical Solution of Governing Equations
The one-dimensional transport of concentration along the respiratory tract can be written as
where, A is the total (alveolar and duct) flow area, Q = ADU, AD is the duct flow area, A′ is the area through which axial diffusion occurs (see below), QB is the cardiac output (ml/s), λ is the inert gas solubility in blood (ml gas) × (ml blood)−1, is the fraction of the total number of alveoli over the length of duct Δx, and CB is the mixed venous inert blood gas concentration. The corresponding continuity equation is
The one-dimensional model of an alveolated duct comprises a central airway surrounded by the alveolar volume (Fig. 11). The alveolar septa prohibit any appreciable axial convection in the alveolar volume and so convective transport of a tracer gas is confined to the central duct. Conversely, the area through which diffusive transport occurs is less well defined in a one-dimensional model of an alveolated duct. This is because one assumption of the one-dimensional concept is that radial mixing is instantaneous. Hence, it could be argued that the alveolar septa offer little resistance to axial diffusion as the tracer gas would instantaneously diffuse radially once the impeding, extremely thin, septum is passed. Hence, we can say that the area through which axial diffusion occurs, A′, has a value somewhere between the duct area, AD, and the total flow area, A. To reflect this uncertainty, we defined where VA is the alveolar volume associated with a duct and lD is the length of the duct and found by trial and error (see Sec. 4).
Fig. 11.
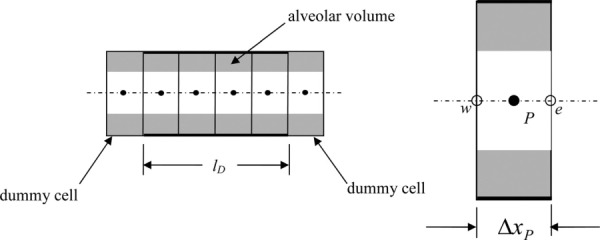
Typical duct of length lD and one-dimensional grid (a) and detail of a grid cell (b). Dummy cells are used to implement boundary conditions and transfer data from neighboring ducts.
We integrated each term in the transport equation over a control volume whose boundaries change in time (Fig. 11) to give
where
and dxe/dt and dxw/dt are the velocities of the east and west faces of the control volume, respectively. The continuity equation becomes
We introduced nondimensional parameters; i.e., let t = t'T, x = x′L, A = A′L2, V = V′L3, U = U′
, Q = Q′ L2 and drop primes for convenience to get
where and
The continuity equation becomes
The volume is assumed to change as
Hence, and where The actual form of the time functions are derived from the equations for the change in volume over time in the upper and lower lung regions (Eq. (2)).
The governing equations can now be written as
Transport
Continuity
Note that and are not decomposed because is found sequentially from the terminal ducts (where is zero) using the continuity equation.
Discretization.
Transport
Temporal acceleration
Convection. We used central differencing for Ce and Cw; i.e.,
where and
where
Diffusion. We also used central differencing for the diffusive terms
where
As each duct is assumed to be of constant flow area,
Collecting terms and rearranging we can write
where
and 0 < ≤ 1 is the underrelaxation factor.
Continuity. This equation need not be solved iteratively. It can be rearranged to solve for the volume flow entering the duct; i.e.,
This equation is solved for each duct starting with the terminal ducts where Q′e = 0. As the volume flow rate through the east plane of the cell P must equal that crossing the west plane of cell P + 1, we have
Boundary conditions.
At the inlet over inspiration the concentration is set to zero after a time offset to account for the time it takes for the concentration front to reach the model entrance. Over exhalation the concentration at the inlet is found by extrapolation from the internal concentration field. At the ends of the terminal ducts the gradient of concentration is set to zero for all time.
Treatment of diffusion at the bifurcation.
For mass conservation, we require that what leaves the parent duct enters the daughter ducts, and vice versa (Fig. 12); i.e.,
Fig. 12.
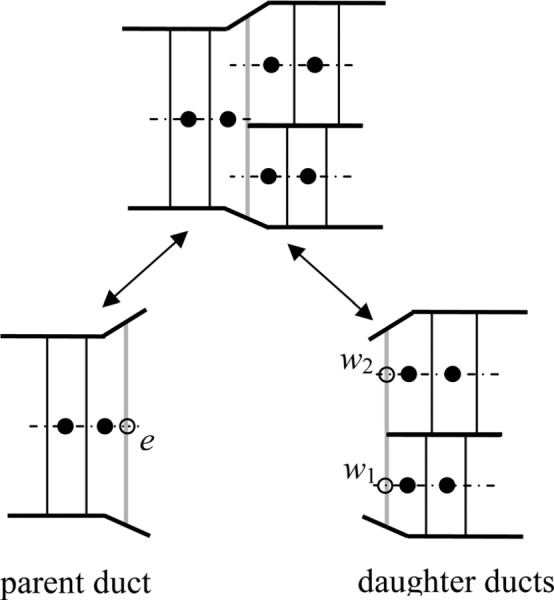
The gridded interface intact (a) and separated along the interface (b)
and
Also, at the bifurcation, which we assume occurs at one value of z, in keeping with the one-dimensional approximation,
The one-dimensional approximation also assumes that C and C/ x are continuous at the interface. That is,
and
In general, it is not possible to satisfy both the above equations simultaneously within a 1D approximation. We chose to satisfy the condition that the concentration is continuous at the interface and relaxed the condition on the gradient using the following approximations.
East face. We defined the concentration in the dummy cell east of the last cell in the parent duct (Fig. 13) as the volume-average of the concentration in the entrance cells of the daughter ducts; i.e.,
Fig. 13.
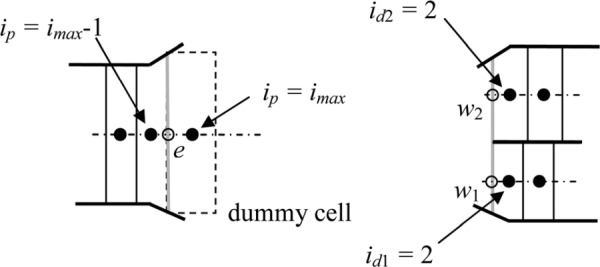
Boundary treatment at the east face of the parent duct
Where the subscripts p, d1 and d2 refer to the parent and the first and second daughter ducts, respectively.
We also defined the length of this dummy cell as the volume-average of the lengths of the entrance cells of the daughter ducts; i.e.,
The area through which the concentration diffuses is assumed to be the average of the parent duct area and the two daughter duct areas (Fig. 13); i.e.,
West face. Each daughter duct has a dummy cell that has the concentration of and the length of the last cell in the parent duct (Fig. 14). That is,
Fig. 14.
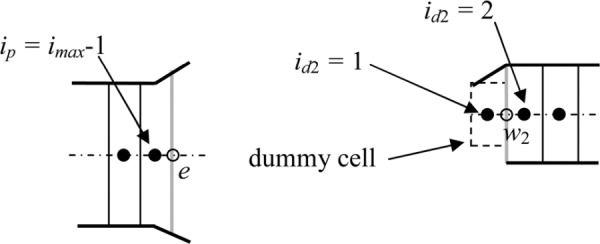
Boundary treatment at the west face of daughter duct 2
Fig. 15.
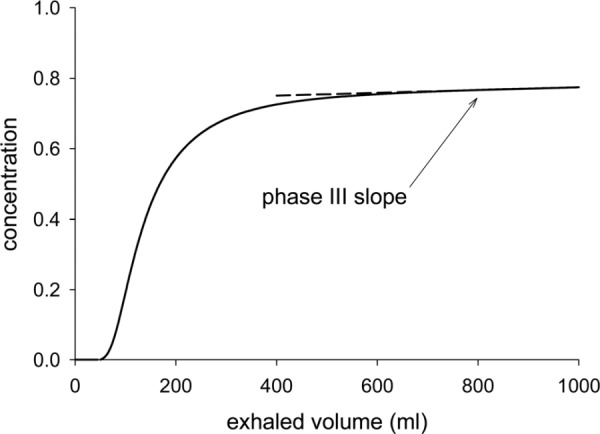
Prediction, using the standard model, of the variation over exhalation of the concentration of nitrogen at the inlet to generation 0 (the trachea).
and
where n = 1, 2
The area through which the concentration diffuses into the daughter duct is assumed to be a fraction of the average of the parent duct area and the two daughter duct areas (Fig. 14); i.e.,
where n = 1, 2
Typical washout curve.
A typical curve from which the phase III slope was computed is given in Fig. 15. The phase III slope was computed using the method of least squares over the last 250 ml of exhaled volume.
Contributor Information
F. S. Henry, Molecular and Integrative , Physiological Sciences, , Harvard School of Public Health, , Boston, MA 02115 , e-mail: fhenry@hsph.harvard.edu.
C. J. Llapur, James Whitcomb Riley , Hospital for Children, , Indiana University, , Indianapolis, IN 46202–5225
A. Tsuda, Molecular and Integrative , Physiological Sciences, , Harvard School of Public Health, , Boston, MA 02115
R. S. Tepper, James Whitcomb Riley , Hospital for Children, , Indiana University, , Indianapolis, IN 46202–5225
References
- [1]. Bourdin, A. , Paganin, F. , Préfaut, C. , Kieseler, D. , Godard, P. , and Chanez P., 2006, “Nitrogen Washout Slope in Poorly Controlled Asthma,” Allergy 61(1), pp. 85–89. 10.1111/j.1398-9995.2006.00970.x [DOI] [PubMed] [Google Scholar]
- [2]. Verbanck, S. , Schuermans, D. , Noppen, M. , Van Muylem, A. , Paiva, M. , and Vincken W., 1999, “Evidence of Acinar Airway Involvement in Asthma,” Am. J. Respir. Crit. Care Med. 159(5), pp. 1545–1550. [DOI] [PubMed] [Google Scholar]
- [3]. Aurora, P. , Gustafsson, P. , Bush, A. , Lindblad, A. , Oliver, C. , Wallis, C. E. , and Stocks J., 2004, “Multiple Breath Inert Gas Washout as a Measure of Ventilation Distribution in Children with Cystic Fibrosis,” Thorax, 59(12), pp. 1008–1010. 10.1136/thx.2004.022590 [DOI] [PMC free article] [PubMed] [Google Scholar]
- [4]. Horsley, A. R. , Macleod, K. A. , Robson, A. G. , Lenney, J. , Bell, N. J. , Cunningham, S. , Greening, A. P. , Gustafsson, P. M. , and Innes J. A., 2008, “Effects of Cystic Fibrosis Lung Disease on Gas Mixing Indices Derived from Alveolar Slope Analysis,” Respir. Physiol. Neurobiol. 162(3), pp. 197–203. 10.1016/j.resp.2008.06.014 [DOI] [PubMed] [Google Scholar]
- [5]. Verbanck, S. , Schuermans, D. , Meysman, M. , Paiva, M. , and Vincken W., 2004, “Noninvasive Assessment of Airway Alterations in Smokers: The Small Airways Revisited,” Am. J. Respir. Crit. Care Med., 170(4), pp. 414–419. 10.1164/rccm.200401-037OC [DOI] [PubMed] [Google Scholar]
- [6]. Akamatsu, K. , Matsunaga, K. , Sugiura, H. , Koarai, A. , Hirano, T. , Minakata, Y. , and Ichinose M., 2011, “Improvement of Airflow Limitation by Fluticasone Propionate/Salmeterol in Chronic Obstructive Pulmonary Disease: What is the Specific Marker?” Front. Pharmacol., 2, pp. 36–41. [DOI] [PMC free article] [PubMed] [Google Scholar]
- [7]. Robinson, P. D. , Goldman, M. D. , and Gustafsson, P. M. , 2009, “Inerst Gas Washout: Theoretical Background and Clinical Utility in Respiratory Disease,” Respiration, 78(3), pp. 339–355. 10.1159/000225373 [DOI] [PubMed] [Google Scholar]
- [8]. Crawford, A. B. H. , Makowska, M. , Paiva, M. , and Engel, L. A. , 1985, “Convection- and Diffusion Dependent Ventilation Maldistribution in Normal Subjects,” J Appl. Physiol., 59, pp. 838–846. [DOI] [PubMed] [Google Scholar]
- [9]. Verbanck, S. , and Paiva, M. , 1990, “Model Simulations of Gas Mixing and Ventilation Distribution in the Human Lung,” J. Appl. Physiol., 69, pp. 2269–2279. [DOI] [PubMed] [Google Scholar]
- [10]. Tawhai, M. H. , and Hunter, P. J. , 2001, “Multibreath Washout Analysis: Modelling the Influence of Conducting Airway Ssymmetry,” Respir. Physiol., 127(2–3), pp. 249–258. 10.1016/S0034-5687(01)00239-0 [DOI] [PubMed] [Google Scholar]
- [11]. Scherer, P. W. , Neff, J. D. , Baumgardner, J. E. , and Neufeld, G. R. , 1996, “The Importance of a Source Term in Modeling Multibreath Inert Gas Washout,” Respir. Physiol., 103(1), pp. 99–103. 10.1016/0034-5687(95)00080-1 [DOI] [PubMed] [Google Scholar]
- [12]. Cruz, J. C. , Jeng, D.-R. , Han, D. , Wu, G. , and Flores X. F., 1997, “Ventilation Inhomogeneities and Mixed Venous Blood N2 in Multibreath N2 Washout,” Respir. Physiol. 110(1), pp. 47–56. 10.1016/S0034-5687(97)00068-6 [DOI] [PubMed] [Google Scholar]
- [13]. Scherer, P. W. , Shendalman, L. H. and Greene, N. M. , 1972, “Simultaneous Diffusion and Convection in Single Breath Lung Washout” Bull. Math. Biophys., 34(3), pp. 393–412. 10.1007/BF02476450 [DOI] [PubMed] [Google Scholar]
- [14]. Paiva, M. , 1973, “Gas Transport in the Human Lung,” J. Appl. Physiol., 35, pp. 401–410. [DOI] [PubMed] [Google Scholar]
- [15]. Majumdar, A. , Alencar, A. M. , Buldyrev, S. V. , Hantos, Z. , Lutchen, K. R. , Stanley, H. E. , and Suki, B. , 2005, “Relating Airway Diameter Distributions to Regular Branching Asymmetry in the Lung,” Phys. Rev. Lett., 95(16), p. 168101. 10.1103/PhysRevLett.95.168101 [DOI] [PubMed] [Google Scholar]
- [16]. Weibel, E. R. , Sapovale, B. , and Filoche, M. , 2005, “Design of Peripheral Airways for Efficient Gas Exchange,” Respir. Physiol. Neurobiol., 148, pp. 3–21. 10.1016/j.resp.2005.03.005 [DOI] [PubMed] [Google Scholar]
- [17]. Prisk, G. K. , Elliott, A. R. , Guy, H. J. B. , Verbanck, S. , Paiva, M. , and West, J. B. , 1998, “Multiple-breath Washin of Helium and Sulfur Hexaflouride in Sustained Microgravity,” J. Appl. Physiol. 84, pp. 244–252. [DOI] [PubMed] [Google Scholar]
- [18]. Grönkvist, M. , Bergsten, E. , and Gustafsson, P. M. , 2002, “Effects of Body Posture and Tidal Volume on Inter- and Intraregional Ventilation Distribution in Healthy Men,” J. Appl. Physiol., 92(2), pp. 634–642. 10.1152/japplphysiol.00161.2001 [DOI] [PubMed] [Google Scholar]
- [19]. Dutrieue, B. , Vanholsbeeck, F. , Verbanck, S. , and Paiva, M. , 2000, “A Human Acinar Structure for Simulation of Realistic Alveolar Plateau Slopes,” J. Appl. Physiol. 89, pp. 1859–1867. [DOI] [PubMed] [Google Scholar]
- [20]. Haefeli-Bleuer, B. , and Weibel E. R., 1988, “Morphometry of the Human Pulmonary Acinus,” Anat. Rec. 220(4), pp. 401–414. 10.1002/ar.1092200410 [DOI] [PubMed] [Google Scholar]
- [21]. Anthonisen, N. R. , Robertson, P. C. , and Ross W. R. D., 1970, “Gravity-dependent Sequential Emptying of Lung Regions,” J. Appl. Physiol. 28, 589–595. [DOI] [PubMed] [Google Scholar]
- [22]. Raabe, O. G. , Yeh, H.-C. , Schum, G. M. , and Phalen, R. F. , 1976, “Tracheobronchial Geometry: Human, Dog, Rat, Hamster,” Technical Report No. LF-53.
- [23]. Federspiel, W. J. , and Fredberg, J. J. , 1988, “Axial Dispersion in Respiratory Bronchioles and Alveolar Ducts,” J. Appl. Physiol. 64, pp. 2614–2621. [DOI] [PubMed] [Google Scholar]
- [24]. Tsuda, A. , Federspiel, W. J. , Grant, Jr., P. A. , and Fredberg, J. J. , 1991, “Axial Dispersion of Inert Species in Alveolated Channels,” Chem. Eng. Sci., 46(516), pp. 1419–1426. 10.1016/0009-2509(91)85068-9 [DOI] [Google Scholar]


