

Abstract
Pulse wave imaging (PWI) is an ultrasound-based method for noninvasive characterization of arterial stiffness based on pulse wave propagation. Reliable numerical models of pulse wave propagation in normal and pathological aortas could serve as powerful tools for local pulse wave analysis and a guideline for PWI measurements in vivo. The objectives of this paper are to (1) apply a fluid-structure interaction (FSI) simulation of a straight-geometry aorta to confirm the Moens-Korteweg relationship between the pulse wave velocity (PWV) and the wall modulus, and (2) validate the simulation findings against phantom and in vitro results. PWI estimates the pulsatile wall displacement along the abdominal regions of canine aorta in vitro in sequential RF ultrasound frames and estimates the PWV in the imaged wall. The same system was also used to image the performance of similar estimations in polyacrylamide phantoms, mimicking the canine measurements as well as modeling softer and stiffer walls. Finally, the model parameters from the canine and phantom studies were used to perform 3D two-way coupled FSI simulations of pulse wave propagation and estimate the PWV. The simulation results were found to correlate well with the corresponding Moens-Korteweg equation. A high linear correlation was also established between PWV2 and E data across the combined simulation and experimental findings combined (R2 = 0.98) confirming the relationship established by the aforementioned equation.
Keywords: arterial stiffness, aortic pulse wave velocity (PWV), pulse wave imaging (PWI), fluid-structure interaction (FSI) simulation
1. Introduction
Changes in the vascular mechanics may have immediate ramifications on the onset and progression of cardiovascular disease (CVD) [1] and the aortic stiffness has been reported as an independent indicator of all-cause and CVD-related mortalities [2]. Collectively, it has been increasingly appreciated that assessing arterial stiffness could prove pivotal in routine clinical diagnosis, treatment and follow-up procedures [3].
The arterial pulse wave velocity (PWV) has been shown to be related to the underlying wall stiffness through the MoensKorteweg equation [4] and has been used in a variety of applications for noninvasive estimation of arterial stiffness [5,6]. The Moens-Korteweg equation has been established based on the assumptions of having an infinitely long, straight, isolated, and cylindrical vessel with elastic, isotropic, and homogenous walls, containing a homogenous, incompressible and nonviscous fluid [5,7]. Most of the aforementioned assumptions may not be valid in vivo; nonetheless, the qualitative relationship between stiffness and PWV remains valid and forms the basis of the PWI method for stiffness estimation based on the PWV measurements.
The current clinical gold standard consists of obtaining the global PWV by measuring the difference in arrival times between the temporal pulse pressure profiles at two distinct sites, e.g., the carotid and femoral arteries, and dividing it by the over-the-skin measured distance [3,8]. Such methods are at the core of most clinical studies involving the measurement of arterial stiffness [9]. Due to a number of factors, such as the lack of knowledge on the exact arterial geometry and the assumption of a single longitudinal flow direction between the carotid and the femoral sites, such methods may lead to an overestimation/underestimation of the true distance [10]. Most importantly, the wall stiffness has been shown to vary along the arterial tree, and therefore assuming a global PWV may not detect early onset or focal disease [11]. These and other fundamental limitations of the carotid-femoral methods have been reviewed in details elsewhere [12].
Different imaging modalities, such as ultrasound [13,14] and MRI [15,16] have been used for noninvasive imaging of the arterial wall at multiple time-points during the cardiac cycle in order to track the propagation of the transient vibrations along the artery in 2D and estimate the PWV; in some cases together with simultaneous pressure measurements for determining parameters such as augmentation index (AI). More recently, the ultrasound-based method of pulse wave imaging (PWI) has been developed to fully analyze the wave propagation with high temporal and spatial resolutions and to measure the PWV locally. The PWI feasibility studies have been done in various applications such as normal and aneurysmal mouse [17] and human aortas [18], aneurysmal and hypertensive patients [19], and experimental aortic phantoms [10]. The PWI results have also been compared against the clinical method of applanation tonometry in humans [20]. Ongoing PWI studies are focused on verification of the method in the presence of regional changes in wall composition and geometry, such as aneurysmal wall and arterial branches.
Existing finite element method (FEM)-based models that simulate vascular biomechanical function primarily rely on solid-state (SS) modeling of blood vessels experiencing static or pulsatile internal pressure replicating the hemodynamic effects [21,22]. More recently, fully-coupled FSI simulations using patient-specific geometries and anisotropic finite-strain constitutive relations have been reported in healthy and diseased arteries, aiming at computing biomechanical properties, such as fluid velocity and pressure, and wall displacement and stress [21,23,24]. Scotti et al. have extracted temporal wall displacement variation using dynamic FSI; however, no spatial information was obtained and therefore no PWV measurements were extracted [25]. Preliminary studies on performing FSI simulations of aortic pulse wave propagation have been reported by our group [11,26]. The objective of this paper is to verify the use of such simulations of pulse wave propagation along the straight-geometry linearly elastic aortic walls against similar PWI studies on phantoms and in vitro canine aortas.
2. Materials and Methods
2.1. Canine Aorta In Vitro.
Aortas from male Mongrel dogs (total length of L = 205 ± 21.21 mm, n = 2) were freshly excised from the thoracic to the suprarenal abdominal regions and kept in phosphate-buffered saline (PBS) during the entire in vitro experimentation. Given the known regional variations in the wall structural and mechanical properties, the wall was imaged along the descending (thoracic) and suprarenal abdominal (being respectively referred to as “proximal” and “distal” to the heart throughout the rest of the paper) to measure the pulse-wave-induced wall displacement at each location. Details of the ultrasound system and PWI setup are provided in Appendix A.1 (Fig. 1). After completion of the PWI, the same proximal and distal regions on the aorta were used to extract the rectangular samples (in the hoop direction) for the mechanical testing. The aortic samples had a length equal to l = 14.77 ± 0.93 mm, width w = 6.55 ± 0.11 mm, and thickness t = 1.99 ± 0.08 mm (n = 4) for the proximal, and l = 13.51 ± 2.39 mm, w = 6.21 ± 1.08 mm, and t = 1.45 ± 0.11 mm (n = 4) for the distal cases. All in vitro experiments were completed within 24 h post-mortem. Details of the tensile mechanical testing are provided in Appendix A.2. The Young's modulus measured on the distal aorta was used as the reference for the phantom and simulation studies.
Fig. 1.
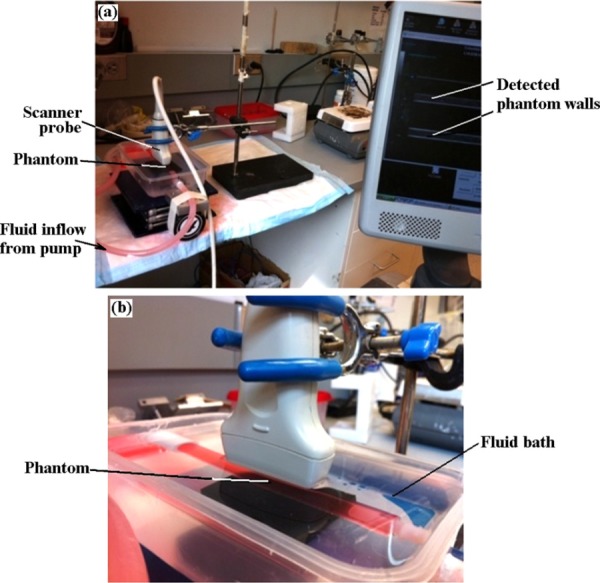
(a) Pulse wave imaging experimental set up. (b) Magnification at the transducer-phantom level. Red dye was injected in the fluid for leakage monitoring on the tube.
2.2. Phantoms.
Shear rheometry testing was initially performed on small cylindrical samples (diameter d = 6.68 ± 0.44 mm and height h = 4.20 ± 0.52 mm) from phantoms of 15%, 20%, 25%, 30%, 45%, 60%, and 75% polyacrylamide (Fisher Scientific, PA, USA) gel concentrations (n = 3 for each) [10], in order to characterize the wall mechanical properties. The mechanical testing results were used to determine the gel concentrations which yield the desired Young's modulus of 110 kPa (reported for canine aorta in vitro) as well as lower and higher moduli of 55 and 220 kPa, respectively, representing softer and stiffer walls. Details of the rheometry mechanical testing are provided in Appendix A.3. The tube phantoms (n = 3) from each modulus were manufactured with internal diameter di = 7.96 ± 0.84 mm, thickness t = 2.12 ± 0.36 mm, and total length L = 248.27 ± 2.30 mm and were imaged with the same PWI setup described in Appendix A.1 (Fig. 1) to map the pulse wave propagation and estimate the PWV.
2.3. FSI Model.
3D two-way coupled simulations of pulse wave propagation were performed using the coupled Eulerian-Lagrangian (CEL) explicit solver of Abaqus 6.10-1 (Simulia, RI, USA) (Fig. 2). A workstation with Intel® Xeon® CPU @2.33 GHz and 32 GB RAM was used to carry out the computations. The model parameters were primarily determined based on the previous experimental measurements as well as existing literature on the canine aorta in vitro [27]. The tube geometry was set with an internal diameter of di = 8 mm, thickness t = 2 mm and total length L = 300 mm (Fig. 2(a)). The wall was modeled with elastic material properties of density ρs = 1050 kg/m3, Poisson's ratio v = 0.48, and Young's modulus Enormal = 110 kPa, Esoft = 55 kPa or Estiff = 220 kPa, respectively, representing normal, softer, and stiffer walls. The same as in the phantom and in vitro studies, the fluid was modeled as water with density ρf = 993 kg/m3, sound speed c0 = 1523 m/s, and viscosity η = 0.007 N s/m2 [28,29]. Additional details can be found in Appendix A.4, as well as in a previous publication on using CEL for modeling the arterial pulse wave along inhomogeneous walls [11].
Fig. 2.
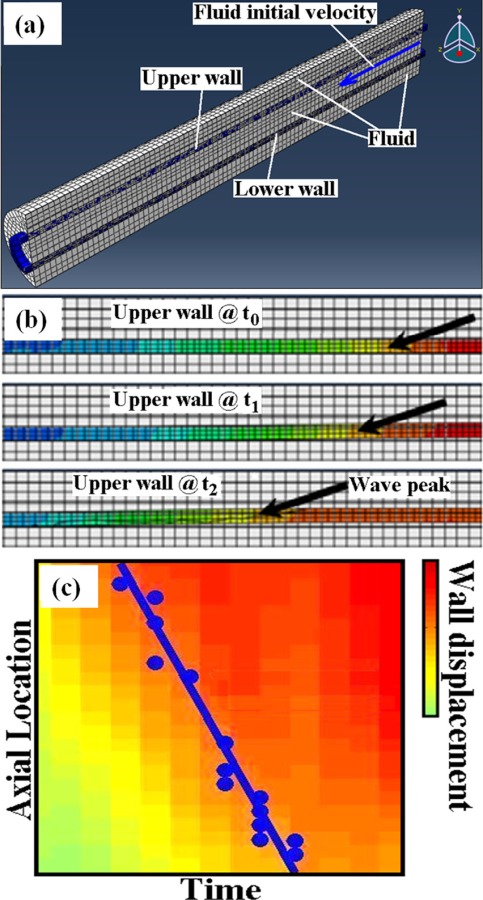
(a) Half view of the full 3D aorta-fluid mesh in Abaqus. (b) Examples of a propagating wall displacement wave at multiple time points. (c) Schematic representation of a spatio-temporal map of the wall displacement wave.
2.4. PWV-Based Stiffness Estimation.
The PWV estimates from the wall displacement spatio-temporal maps were used to obtain the Young's modulus, E, via the Moens-Korteweg equation [4,7,30], i.e.,
| (1) |
where v, ρ, t, and r denote the wall Poisson's ratio, density, thickness, and radius, respectively. This relation was the basis of establishing the correlation between the PWV2 and E. A high correlation is favorable in the PWI method allowing for the detection of local changes in stiffness based on the noninvasive PWV measurements.
3. Results
3.1. Canine Aorta In Vitro.
Figure 3(i.a) depicts an example of the spatio-temporal plot from a distal region on canine aorta. The single forward-traveling pulse wave, used in the PWV calculation, is shown in Fig. 3(i.b). Using the image-based diameter and thickness measurements at the proximal (di = 6.72 ± 0.02 mm; t = 1.80 ± 0.13 mm; n = 4) and distal (di = 5.66 ± 0.17 mm; t = 1.32 ± 0.04 mm; n = 4) regions, the average estimates of PWVprox = 4.44 ± 0.45 (R2 = 0.96) and PWVdist = 6.01 ± 0.59 m/s (R2 = 0.96) were obtained. The diameter and thickness measurements were also found to be in agreement with reported measurements on normal canine in vitro [31,32].
Fig. 3.
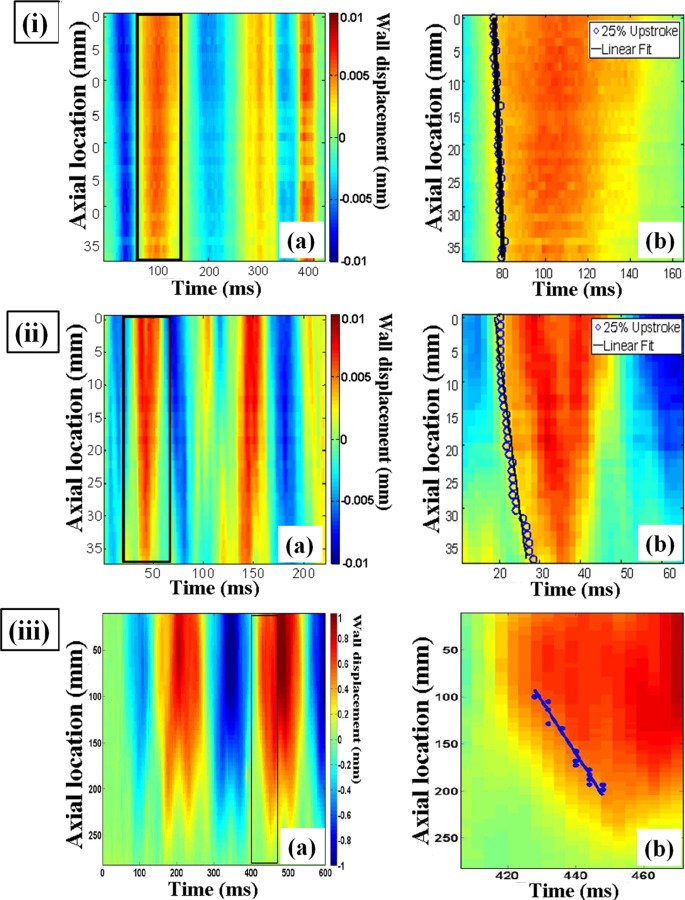
Spatio-temporal plots of the wall displacement obtained from PWI: (i.a) distal region on canine aorta in vitro, (ii.a) normal wall phantom, i.e., 110 kPa, (iii.a) normal wall simulation, i.e., 110 kPa; (i.b)-(iii.b) single isolated forward-traveling wave, respectively, corresponding to (i.a)–(iii.a), with the linear fit to the wave foot used for the PWV calculation.
3.2. Phantoms.
Figure 4 shows the results of mechanical characterization of the phantoms as a function of gel concentration. Based on the linear fit, polyacrylamide gel concentrations of 30%, 45%, and 75% were found to yield the desired elastic moduli of 55, 110, and 220 kPa, respectively, and were used in the PWI examinations. Figure 3(ii.a) depicts an example of the spatio-temporal plot from a 110-kPa phantom. The single forward-traveling pulse wave, used for PWV calculation, is shown in Fig. 3(ii.b). The average PWV measurements obtained on 55, 110, and 220 kPa wall moduli are 2.82 ± 0.45 (R2 = 0.96), 6.46 ± 1.08 (R2 = 0.94), and 11.20 ± 2.31 m/s (R2 = 0.96), respectively.
Fig. 4.
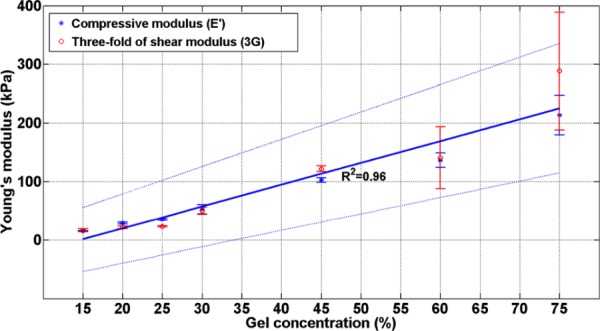
Mechanical characterization of phantom compressive modulus (E′) and threefold of the shear modulus (3G) (Appendix A.4). The errorbars show the standard deviation on each measurement (n = 3). The linear fit to the defined average Young's modulus, i.e., E = (E′ + 3G)/ 2, and the standard deviation lines are shown with the solid and dashed lines, respectively.
3.3. FSI Model.
Figure 3(iii.a) illustrates the spatio-temporal plot in the 110 kPa wall modulus simulation. The single forward-traveling pulse wave, used for the PWV calculation, is shown in Fig. 3(iii.b). The PWV measurements obtained for the 55, 110, and 220 kPa wall modulus are 2.72 (R2 = 0.87), 5.64 (R2 = 0.95), and 8.46 m/s (R2 = 0.93), respectively.
3.4. Correlation Between Stiffness and PWV.
Table 1 summarizes the quantitative in vitro, phantom, and simulation results. The PWV-based estimation difference of the modulus is provided in the last row of the table which shows acceptable PWI performance except in the proximal aortic region and the soft wall simulation. Figure 5 illustrates the theoretical, i.e., Moens-Korteweg, relationship between the PWV2 versus E (based on the parameters used in the simulation) as well as the measured data from in vitro, phantom, and simulations, showing a high linear correlation coefficient of R2 = 0.98, combined.
Table 1.
Summary of PWV and E estimates from canine aortas, phantoms, and simulations studies. The last row indicates the difference between the PWI-based stiffness estimates and the reference values, i.e., mechanical testing results in canine aortas and phantoms studies and the input values in the simulations studies.
|
Canine aortas |
Phantoms |
Simulations |
||||||
|---|---|---|---|---|---|---|---|---|
| Proximal | Distal | Soft | Normal | Stiff | Soft | Normal | Stiff | |
| Reference E (kPa) | 97.10 ± 9.54 | 125.06 ± 12.45 | 51.24 ± 7.03 | 112.26 ± 4.31 | 250.88 ± 37.14 | 55 | 110 | 220 |
| PWV-based E (kPa) | 56.20 ± 4.27 | 117.70 ± 0.25 | 51.20 ± 2.61 | 91.89 ± 5.27 | 254.31 ± 7.39 | 24.09 | 102.82 | 231.34 |
| E difference (%) | −42.12 ± 7.69 | −5.89 ± 10.41 | −0.08 ± 16.69 | −18.15 ± 5.72 | 1.37 ± 17.89 | −56.20 | −6.53 | 5.15 |
Fig. 5.
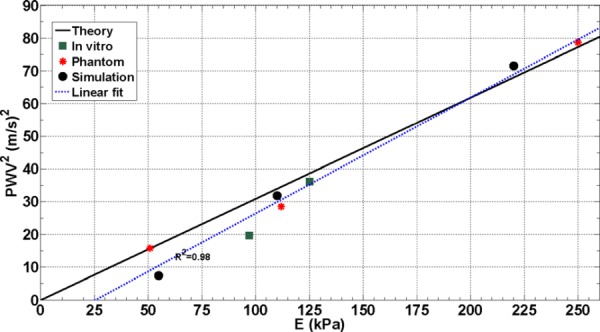
The theoretical, i.e., Moens-Korteweg, relationship between the PWV2 versus E (based on the parameters used in the simulation) as well as the measured data from canine aortas, phantoms, and simulations, showing a high linear correlation coefficient of R2 = 0.98, combined.
4. Discussion
Figure 5 shows that the three simulation data points (•) are reasonably correlated to the Moens-Korteweg line. Also, Table 1 shows that the difference of stiffness estimation was very low for normal and stiff models, i.e., less than 7%. However, the stiffness estimation accuracy is compromised in the simulation of the soft model, i.e. difference of 56.2%, most likely due to the larger and faster wall displacement in the soft wall causing possible under-sampling effects by the selected spatio-temporal resolutions. Furthermore, as predicted by the Moens-Korteweg equation, the PWVs measured in the canine aortas, phantoms, and simulations were found to increase with the corresponding Young's modulus. The simulation parameters were obtained from the in vitro and experimental phantom measurements and the results from all studies were found to be in excellent agreement, R2 = 0.98. Therefore, the PWI technique was found to serve as a good basis for detecting the relative stiffness changes.
Given the main focus here on validating the PWI method according to the Moens-Korteweg equation, simple geometry and a set of elastic material properties were considered in simulation and phantom studies. The PWI estimates on the phantom wall moduli showed that the method is able to describe the increase in the wall stiffness via the PWV estimates. However, the estimation difference was higher for the soft phantom most likely due to the much larger viscosity of soft phantoms obtained by shear rheometry (viscosity results not shown here). Similarly, the higher stiffness estimation error on the proximal aortic segment could be attributed to the large tissue inhomogeneity and viscosity. However, a lower PWV measured at the proximal confirms the mechanical testing results and previously reported findings that the thoracic region of the aorta is softer than the abdominal region [33].
Unlike in the phantom and in vitro experiments where a continuous stream of numerous pulsatile cycles was simply achieved, performing the 3D fully-coupled FSI simulations for long durations was tested in this study by the current limitations in the computational power. Therefore, the simulation results here also reflect the initial transient of the dynamic wave behavior. Nonetheless, the high correlation established in simulations for all homogenous and nonhomogeneous wall properties studied as previously reported [11], and the high correlation established between the simulation and experimental findings as well as the Moens-Korteweg theoretical relationship strongly confirm that the simulation framework accurately represents the wave propagation. As part of our ongoing studies related to the normal or pathological aortas, the 2D mesh is being considered in axisymmetric geometries, which allows for an affordable computational cost. In addition, despite the initial single cycle of the input function considered in this paper, the spatio-temporal plot demonstrates the existence of several forward (and backward) waves generated as a result of multiple reflections of the wave along the finite vessel length, primarily due to the higher velocities of the wall displacement wave (e.g., 2.72–8.46 m/s) compared to the fluid velocity (e.g., 1.5 m/s) and the fixed ends of the vessel.
Future investigations are needed to further assess the in vivo implications of the PWI simulations by better mimicking the physiologic conditions such as viscoelastic wall, non-Newtonian fluid and patient-specific velocity profile and geometry. Despite the fact that considerations of these factors could affect the numerical PWV estimates, the proportional change in PWVs due to change in the wall stiffness, as it pertains to the PWI calculations, is expected to remain valid.
5. Conclusion
This study shows the feasibility of using numerical solutions of pulse wave propagation along the walls of straight-geometry arteries for PWV and stiffness estimation as validated by the Moens-Korteweg formulation. The simulation results showed higher PWVs for increasing wall moduli and yielded accurate stiffness estimates. Furthermore, good agreement was found between PWV2 and the E in both the simulation and experimental PWI findings from arterial phantoms and canine aortas in vitro. The outcome of this study encourages the application of PWI for the noninvasive and regional estimation of arterial wall stiffening, with implications extended to cardiovascular clinical diagnosis.
Acknowledgment
The study was supported in part by NIH R01-HL098830. The authors thank Dr. Sacha Nandlall and Dr. Jianwen Luo from our lab for helpful discussions, and Prof. Van C. Mow and Dr. Leo Q. Wan from the department of biomedical engineering for helping with the mechanical testing systems and design.
Appendix
A.1. Pulse Wave Imaging (PWI) Protocol.
A customized laboratory setup was used to perform the PWI examinations (Fig. 1). The setup consisted of a peristaltic pump (Manostat Varistaltic, IL, USA), providing a sinusoidal flow of f = 1.5–3.5 Hz, |V| = 3.98–6.82 m/s into the aorta or phantom to induce the pulsatile wall displacement. A Sonix Touch (Ultrasonix Medical, BC, Canada) ultrasound system with a 10 MHz linear array was used to image the wall at 950 fps and 16-beam density. A radio frequency (RF)-based, one-dimensional cross correlation technique was used to estimate the temporal pulse-wave-induced wall displacement [10,34], averaged over 10 cycles. The spatio-temporal displacement variation was used to estimate PWV. In order to comply with the Moens-Korteweg assumptions, the best single forward-traveling pulse wave was identified on each spatio-temporal plot (also from the simulations) and the PWV was calculated as the slope of the linear regression fit (Fig. 2(c)).
A.2. Tensile Testing Protocol.
Tensile mechanical testing was performed on the canine aortic samples using an Instron® 5848 microtester (Instron, MA, USA). Samples were first preconditioned under ε = 5% for 20 cycles at 1 Hz, followed by 5 cycles of tensile testing under ε = 40% at 0.0125 Hz.
A.3. Shear Testing Protocol.
Shear rheometry was performed on polyacrylamide phantom specimens (TA Instrument, DE, USA). A biopsy punch of d = 6 mm was used to extract the test samples. First, the samples were tested under ε = 5% compression to measure the compressive Young's modulus, E′, followed by an f = 1 Hz oscillatory shear test under ε = 1% to measure the shear modulus, G. Given the quasi-incompressibility of the polyacrylamide phantoms [35], the measurements from both tests were used to estimate an elastic modulus (E) defined as the average of the compressive Young's modulus and threefold of the shear modulus, i.e., E = (E′ + 3 G)/2.
A.4. Simulations Framework.
To imitate the clamped ends of the phantoms and in vitro aortas, both ends of the tube were fully constrained in three dimensions as the boundary conditions in the simulation. Relative ambient pressures of 0 and 200 Pa were exerted around the tube, mimicking the immersion of the tube phantom under 2 cm depth of water in the experimental setup, and on the outlet, respectively. (Alternatively, absolute pressures could have been considered by adding the atmospheric pressure on both the surrounding and the tube outlet, however, no change in results were expected.) A sinusoidal initial fluid velocity (f = 1.5 Hz, |V| = 3.98 m/s) was applied on the tube inlet. Free and nonreflecting boundary conditions were, respectively, appointed on the fluid inlet and outlet cross sections to ensure continuous fluid flow and to minimize any boundary effect reflections. A friction coefficient of μ = 0.001 was assumed between the fluid and the solid wall surfaces. A mesh seeding size of 1.8 mm was found to be optimal in providing a converging stable solution while computationally affordable. The model contained a total number of 26691 elements and 30642 nodes. The initial time increment was 4.85 × 10⁻⁷ s with the average stable time increment and total CPU time, respectively, varying between 7.41 × 10⁻⁶ and 14.75 × 10⁻⁶ s, and 1.37 × 10⁶ and 1.46 × 10⁶ s, across different simulations. Additional details on using CEL for modeling the arterial pulse wave propagation can be found elsewhere [11]. In the radial direction (wall thickness), only one point was selected along the entire length of the tube to segment the wall and to measure the average wall displacement at the wall middle path (similar to the experimental and in vivo PWI studies). Axial spatial and temporal resolutions of 1.6 mm and 4 ms were used to measure the propagation of the wall displacement along the aorta (Fig. 2(b)) and the information was mapped onto a 2D spatio-temporal plane (Fig. 2(c)). Given the focus of the study on PWV estimation, the above parameters were considered to properly capture the wave propagation along the tube axial direction.
Contributor Information
Danial Shahmirzadi, e-mail: ds3031@columbia.edu.
Ronny X. Li, e-mail: rxl2103@columbia.edu, Ultrasound and Elasticity Imaging Laboratory, , Department of Biomedical Engineering, , Columbia University, New York, NY
Elisa E. Konofagou, Ultrasound and Elasticity Imaging Laboratory, , Department of Biomedical Engineering, , Department of Radiology, , Columbia University, , New York, NY , e-mail: ek2191@columbia.edu.
References
- [1]. Safar, M. , 1989, “Pulse Pressure in Essential Hypertension: Clinical and Therapeutical Implications,” Hypertension, 7(10), pp. 769–776. 10.1097/00004872-198910000-00001 [DOI] [PubMed] [Google Scholar]
- [2]. Sutton-Tyrrell, K. , Najjar, S. , Boudreau, R. , Venkitachalam, L. , Kupelian, V. , Simonsick, E. , Havlik, R. , Lakatta, E. , Spurgeon, H. , Kritchevsky, S. , Pahor, M. , Bauer, D. , and Newman, A. , 2005, “Elevated Aortic Pulse Wave Velocity, a Marker of Arterial Stiffness, Predicts Cardiovascular Events in Well-Functioning Older Adults,” Circulation, 111(25), pp. 3384–3390. 10.1161/CIRCULATIONAHA.104.483628 [DOI] [PubMed] [Google Scholar]
- [3]. Laurent, S. , Cockcroft, J. , Van Bortel, L. , Boutouyrie, P. , Giannattasio, C. , Hayoz, D. , Pannier, B. , Vlachopoulos, C. , Wilkinson, I. , and Struijker-Boudier, H. , 2006, “Expert Consensus Document on Arterial Stiffness: Methodological Issues and Clinical Applications,” Eur. Heart J., 27(21), pp. 2588–2605. 10.1093/eurheartj/ehl254 [DOI] [PubMed] [Google Scholar]
- [4]. Korteweg, D. , 1878, “Uber Die Fortpflanzungsgeschwindigkeit Des Schalles in Elastiischen Rohren,” Ann. Phys. Chem., 5, pp. 52–537. [Google Scholar]
- [5]. Fung, Y. , 1997, Biomechanics: Circulation, Springer-Verlag, New York, NY. [Google Scholar]
- [6]. Olufsen, M. , 1999, “Structured Tree Outflow Condition for Blood Flow in Larger Systemic Arteries,” Am. J. Physiol., Heart Circ. Physiol., 276(1), pp. H257–H268. [DOI] [PubMed] [Google Scholar]
- [7]. Nichols, W. , and O'Rourke, M. , 2005, McDonald's Blood Flow in Arteries: Theoretical, Experimental and Clinical Principles, Hodder Arnold Publication, London, UK. [Google Scholar]
- [8]. Pannier, B. , Avolio, A. , Hoeks, A. , Mancia, G. , and Takazawa, K. , 2002, “Methods and Devices for Measuring Arterial Compliance in Humans,” Am. J. Hypertens., 15(8), pp. 743–753. 10.1016/S0895-7061(02)02962-X [DOI] [PubMed] [Google Scholar]
- [9]. Davies, J. , and Struthers, A. , 2003, “Pulse Wave Analysis and Pulse Wave Velocity: A Critical Review of Their Strengths and Weaknesses,” Hypertension, 21(3), pp. 463–472. 10.1097/00004872-200303000-00004 [DOI] [PubMed] [Google Scholar]
- [10]. Vappou, J. , Luo, J. , and Konofagou, E. , 2010, “Pulse Wave Imaging for Noninvasive and Quantitative Measurement of Arterial Stiffness In Vivo,” Am. J. Hypertens., 23(4), pp. 393–398. 10.1038/ajh.2009.272 [DOI] [PMC free article] [PubMed] [Google Scholar]
- [11]. Shahmirzadi, D. , and Konofagou, E. , 2012, “Detection of Aortic Wall Inclusions Using Regional Pulse Wave Propagation and Velocity in Silico,” Artery Res., 6(3), pp. 114–123. 10.1016/j.artres.2012.05.004 [DOI] [PMC free article] [PubMed] [Google Scholar]
- [12]. Segers, P. , Kips, J. , Trachet, B. , Swillens, A. , Vermeersch, S. , Mahieu, D. , Rietzschel, E. , De Buyzere, M. , Van Bortel, L. , 2009, “Limitations and Pitfalls of Non-Invasive Measurement of Arterial Pressure Wave Reflections and Pulse Wave Velocity,” Artery Res., 3(2), pp. 79–88. 10.1016/j.artres.2009.02.006 [DOI] [Google Scholar]
- [13]. Brands, P. , Willigers, J. , Ledoux, L. , Reneman, R. , and Hoeks, A. , 1998, “A Noninvasive Method to Estimate Pulse Wave Velocity in Arteries Locally by Means of Ultrasound,” Ultrasound Med. Biol., 24(9), pp. 1325–1335. 10.1016/S0301-5629(98)00126-4 [DOI] [PubMed] [Google Scholar]
- [14]. Hoctor, R. , Dentinger, A. , and Thomenius, K. , 2007, “Array Signal Processing for Local Arterial Pulse Wave Velocity Measurement Using Ultrasound,” IEEE Trans. Ultrason. Ferroelectr. Freq. Control, 54(5), pp. 1018–1027. 10.1109/TUFFC.2007.347 [DOI] [PubMed] [Google Scholar]
- [15]. Bolster, B. , Atalar, E. , Hardy, C. , and McVeigh, E. , 1998, “Accuracy of Arterial Pulse-Wave Velocity Measurement Using MR,” Magn. Reson. Imaging, 8(4), pp. 878–888. 10.1002/jmri.1880080418 [DOI] [PMC free article] [PubMed] [Google Scholar]
- [16]. Shao, X. , Fei, D. , and Kraft, K. , 2004, “Computer-Assisted Evaluation of Aortic Stiffness Using Data Acquired via Magnetic Resonance,” Comput. Med. Imaging Graph., 28(6), pp. 353–361. 10.1016/j.compmedimag.2004.04.006 [DOI] [PubMed] [Google Scholar]
- [17]. Fujikura, K. , Luo, J. , Gamarnik, V. , Pernot, M. , Fukumoto, R. , Tilson, M. , and Konofagou, E. , 2007, “A Novel Noninvasive Technique for Pulse-Wave Imaging and Characterization of Clinically-Significant Vascular Mechanical Properties In Vivo,” Ultrason. Imaging, 29(3), pp. 137–154, available at: http://orion.bme.columbia.edu/ueil/documents/article/2007-fujikura-pwi-technique.pdf 10.1177/016173460702900301 [DOI] [PubMed] [Google Scholar]
- [18]. Vappou, J. , Luo, J. , and Konofagou, E. , 2010, “Regional Measurement of Arterial Stiffness Using Pulse Wave Imaging: Phantom Validation and Preliminary Clinical Results,” Proceedings of the IEEE Ultrasonics Symposium, San Diego, CA, pp. 1332–1335. [Google Scholar]
- [19]. Li, R. , Luo, J. , Balaram, S. , Chaudhry, F. , Lantis, J. , Shahmirzadi, D. , and Konofagou, E. , 2011, “ In Vivo Application of Pulse Wave Imaging for Arterial Stiffness Measurement Under Normal and Pathological Conditions,” 33rd Annual International IEEE EMBS Conference, Boston, MA, pp. 567–570. [DOI] [PubMed] [Google Scholar]
- [20]. Vappou, J. , Luo, J. , Okajima, K. , Tullio, M. , and Konofagou, E. , 2011, “Aortic Pulse Wave Velocity Measured by Pulse Wave Imaging (PWI): A Comparison With Applanation Tonometry,” Artery Res., 5(2), pp. 65–71. 10.1016/j.artres.2011.03.002 [DOI] [PMC free article] [PubMed] [Google Scholar]
- [21]. Leung, J. H. , Wright, A. R. , Cheshire, N. , Crane, J. , Thom, S. A. , Hughes, A. D. , and Xu, Y. , 2006, “Fluid Structure Interaction of Patient Specific Abdominal Aortic Aneurysms: A Comparison With Solid Stress Models,” Biomed. Eng. Online, 5(33), pp. 1–15. 10.1186/1475-925X-5-33 [DOI] [PMC free article] [PubMed] [Google Scholar]
- [22]. Simon, B. R. , Kaufmann, M. V. , McAfee, M. A. , and Baldwin, A. L. , 1993, “Finite Element Models for Arterial Wall Mechanics,” J. Biomech. Eng., 115(4B), pp. 489–496. 10.1115/1.2895529 [DOI] [PubMed] [Google Scholar]
- [23]. Rissland, P. , Alemu, Y. , Einav, S. , Ricotta, J. , and Bluestein, D. , 2009, “Abdominal Aortic Aneurysm Risk of Rupture: Patient-Specific FSI Simulations Using Anisotropic Model,” ASME J. Biomech. Eng., 131(3), pp. 031001. 10.1115/1.3005200 [DOI] [PubMed] [Google Scholar]
- [24]. Kelly, S. C. , and O'Rourke, M. J. , 2011, “A Two-System, Single-Analysis, Fluid-Structure Interaction Technique for Modelling Abdominal Aortic Aneurysms,” Proc. Inst. Mech. Eng., Part H: J. Eng. Med., 224(8), pp. 955–969. 10.1243/09544119JEIM725 [DOI] [PubMed] [Google Scholar]
- [25]. Scotti, C. M. , Jimenez, J. , Muluk, S. C. , and Finol, E. A. , 2008, “Wall Stress and Flow Dynamics in Abdominal Aortic Aneurysms: Finite Element Analysis vs. Fluid-Structure Interaction,” Comput. Methods Biomech. Biomed. Eng., 11(3), pp. 301–322. 10.1080/10255840701827412 [DOI] [PubMed] [Google Scholar]
- [26]. Vappou, J. , Zervantonakis, I. , Luo, J. , and Konofagou, E. E. , 2008, “Finite Element Modeling of the Pulse Wave Propagation in the Aorta for Simulation of the Pulse Wave Imaging (PWI) Method,” Computational Biomechanics for Medicine (MICCAI 2008 Workshop), New York, NY, pp. 118–127. [Google Scholar]
- [27]. Cox, R. , 1975, “Anisotropic Properties of the Canine Carotid Artery In Vitro,” Biomechanics, 8(5), pp. 293–300. 10.1016/0021-9290(75)90081-0 [DOI] [PubMed] [Google Scholar]
- [28]. Lide, D. , 2008, CRC Handbook of Chemistry and Physics, 89th ed., Taylor & Francis Publishing, New York, NY. [Google Scholar]
- [29]. Kaatze, U. , 1995, “Fundamentals of Microwaves,” Radiat. Phys. Chem., 45(4), pp. 539–548. 10.1016/0969-806X(94)00069-V [DOI] [Google Scholar]
- [30]. Moens, A. , 1878, Die Pulskurve [the Pulse Curve], Brill E. J.., ed., Leiden, The Netherlands. [Google Scholar]
- [31]. Bubenik, L. J. , Hosgood, G. , and Vasanjee, S. C. , 2005, “Bursting Tension of Medium and Large Canine Arteries Sealed With Ultrasonic Energy or Suture Ligation,” Vet. Surg., 34(3), pp. 289–293. 10.1111/j.1532-950x.2005.00043.x [DOI] [PubMed] [Google Scholar]
- [32]. Sato, M. , Hayashi, K. , Niimi, H. , Moritake, K. , Okumura, A. , and Handa, H. , 1979, “Axial Mechanical Properties of Arterial Walls and Their Anisotropy,” Med. Biol. Eng. Comput., 17(2), pp. 170–176. 10.1007/BF02440925 [DOI] [PubMed] [Google Scholar]
- [33]. Fischer, G. , and Llaurado, J. , 1966, “Collagen and Elastin Content in Canine Arteries Selected from Functionally Different Vascular Beds,” Circ. Res., 19(2), pp. 394–399. 10.1161/01.RES.19.2.394 [DOI] [PubMed] [Google Scholar]
- [34]. Luo, J. , and Konofagou, E. , 2010, “A Fast Normalized Cross-Correlation Calculation Method for Motion Estimation,” IEEE Trans. Ultrason. Ferroelectr. Freq. Control, 57(6), pp. 1347–1357. 10.1109/TUFFC.2010.1554 [DOI] [PMC free article] [PubMed] [Google Scholar]
- [35]. Geissler, E. , and Hecht, A. M. , 1980, “The Poisson's Ratio in Polymer Gels,” Macromolecules, 13(5), pp. 1276–1280. 10.1021/ma60077a047 [DOI] [Google Scholar]