

Abstract
Accurate characterization of carotid artery geometry is vital to our understanding of the pathogenesis of atherosclerosis. Three-dimensional computer reconstructions based on medical imaging are now ubiquitous; however, mean carotid artery geometry has not yet been comprehensively characterized. The goal of this work was to build and study such geometry based on data from 16 male patients with severe carotid artery disease. Results of computerized tomography angiography were used to analyze the cross-sectional images implementing a semiautomated segmentation algorithm. Extracted data were used to reconstruct the mean three-dimensional geometry and to determine average values and variability of bifurcation and planarity angles, diameters and cross-sectional areas. Contrary to simplified carotid geometry typically depicted and used, our mean artery was tortuous exhibiting nonplanarity and complex curvature and torsion variations. The bifurcation angle was 36 deg ± 11 deg if measured using arterial centerlines and 15 deg ± 14 deg if measured between the walls of the carotid bifurcation branches. The average planarity angle was 11 deg ± 10 deg. Both bifurcation and planarity angles were substantially smaller than values reported in most studies. Cross sections were elliptical, with an average ratio of semimajor to semiminor axes of 1.2. The cross-sectional area increased twofold in the bulb compared to the proximal common, but then decreased 1.5-fold for the combined area of distal internal and external carotid artery. Inter-patient variability was substantial, especially in the bulb region; however, some common geometrical features were observed in most patients. Obtained quantitative data on the mean carotid artery geometry and its variability among patients with severe carotid artery disease can be used by biomedical engineers and biomechanics vascular modelers in their studies of carotid pathophysiology, and by endovascular device and materials manufacturers interested in the mean geometrical features of the artery to target the broad patient population.
Keywords: carotid artery, three-dimensional geometry, mean geometry, curvature, torsion, bifurcation angle, atherosclerosis
Introduction
Carotid artery geometry is a risk factor for the development of atherosclerosis [1,2]. Geometric characterization, especially in the regions prone to vascular disease and subject to vascular or endovascular interventions, is required for mathematical modeling of arterial hemodynamics and biomechanics. This modeling may lead to improved understanding of carotid bifurcation pathophysiology through analysis of such atherosclerosis-related mechanical factors as fluid wall shear stress, or mechanical stresses and strains in the arterial wall [3–5]. In addition, detailed knowledge of carotid morphology and deployment site geometry is a major requirement in patient selection, preoperative planning, and the design of new prostheses for arterial reconstruction.
Most existing data on carotid artery geometry [6–10,32] are derived from planar analysis of conventional angiograms, maximum intensity projections from magnetic resonance (MR) angiography and views of vascular casts. All of these methods inevitably incur projection errors or discrepancies introduced by postmortem preparation [11]. Increasing numbers of studies employ volumetric MR and computerized tomography (CT) angiography [5,12–15] as these methods capture the actual three-dimensional geometry of the artery with substantial accuracy [11,16,17]. However, studies using these newer techniques are mostly performed on young healthy arteries and due to large effort involved in such reconstructions are usually confined to the individual geometries of one or two patients. Three-dimensional studies of larger patient groups are rare [13,14,32]. Those few that recently appeared present comprehensive analysis of individual carotid geometries, however they do not allow easy envisioning of the three-dimensional mean artery. The latter however is particularly important for use in mathematical models (in combination with flow data on the same patient group published separately [18]) studying arterial pathophysiology and for developing more adequate endovascular devices targeted for the broad patient population.
The goal of this study was to use state-of-the-art three-dimensional vascular imaging (CT) and accompanying analysis methods to study the carotid arteries of a series of cerebrovascular diseased patients and to derive average three-dimensional characteristics and construct a mean three-dimensional human carotid artery.
Methods
Research Protocol and Data Acquisition.
The research protocol was approved by the institutional review board of the Veterans Affairs Nebraska-Western Iowa Medical Center and informed consent was obtained from all patients. Sixteen male patients (mean age 68 ± 8) with severe (>80% diameter reduction) symptomatic and asymptomatic carotid bifurcation disease were selected for this study. Each patient contributed only one carotid artery. For all patients CTA scans were obtained using 64-channel scanner Brilliance 64 (Philips Medical Systems, Cleveland, OH). The patients were imaged in the supine position during inspiration breath-hold. CTA images were taken with an axial step of 1 mm. Resolution of each image was 512 × 512 pixels (pixel size 0.488 mm). All images were rescaled to 1200 × 1200 pixel matrix size (pixel size 0.208) using sub-pixel interpolation with standard imaging software which has been shown to improve the accuracy of segmentation [19].
Segmentation.
A segment of the carotid artery 5 cm proximal to the flow divider into the common carotid artery (CCA) and 5 cm distal into the internal carotid artery (ICA) and 3 cm distal into the external carotid artery (ECA) was examined. Segment length (100 mm) was chosen to comply with three-dimensional carotid geometries reconstructed by other authors [5,14,20–22]. Distal branches of the ECA were excluded from analysis because of their small size.
Outer (periadventitial) and inner (luminal) borders of the CCA, ICA, and ECA were semiautomatically segmented (in-house Matlab code) [19] on each of the two-dimensional cross-sectional images and best fit ellipses were inscribed in each of the obtained contours. Segmentation was performed under the supervision of a vascular surgeon who assisted the algorithm by correcting the segments of the automatically detected boundary that were partially obscured by periadventitial fat, atherosclerotic plaque or were illdefined due to poor contrast (see Fig. 1).
Fig. 1.
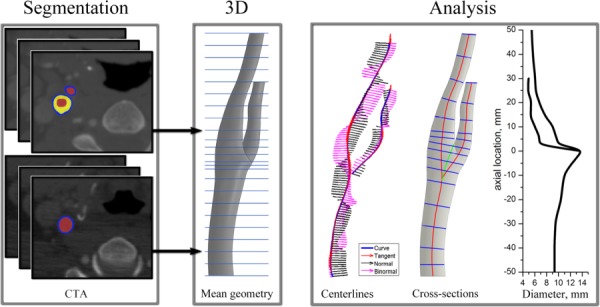
Work flow diagram showing three major steps for geometry characterization: segmentation of arterial contours, generation of 3D mean geometry, and analysis of geometrical features (tangent, normal, and binormal vectors of the arterial centerlines used for calculations of curvature and torsion; and change of lumen equivalent diameter along the length of the artery calculated as = 2 · for cross sections (in blue) orthogonal to the centerlines)
The mean contours were calculated by averaging between the individual patient geometrical data sets. The latter formed a stack of mean arterial cross sections that were connected together to form the three-dimensional solid body of the mean carotid artery in Computer Aided Design Software Solid Works using the loft function (see Fig. 1). Segmentation in the flow divider area required special attention because branching perturbed the centroids of the vessels causing perturbations of the centroid path. To resolve this issue we built the CCA-ICA and CCA-ECA arteries separately and then merged them together in Solid Works.
Angles of Carotid Bifurcation.
The angle of carotid bifurcation is commonly described as the one formed between straight line representations of the local directions of the two vessels at the bifurcation. However, there is no uniform agreement as to how to choose these directions. Previous studies have used tangents to the arterial centerlines, tangents to the vessel walls, and linear least square fits of centerline points in proximity of the bifurcation [6–9,12,13,31,32]. Three-dimensional studies have primarily used angles between the directional vectors of the branching arterial axes [23]. In addition to the bifurcation angle, planarity angle of the carotid bifurcation has been reported. Planarity angle is calculated in two-dimensional space and is defined as the angle formed between the out-of-plane components of the CCA and ICA vectors [13] (Fig. 2).
Fig. 2.
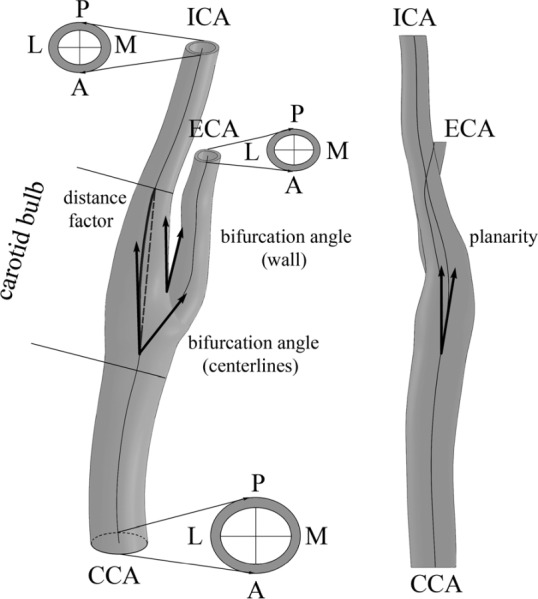
Schematic of the mean carotid bifurcation. CCA = common carotid artery, ICA = internal carotid artery, ECA = external carotid artery, L = lateral, M = medial, A = anterior, P = posterior. Arrows show planarity and bifurcation angles measured using two different approaches (as angle formed by branching centerlines and as angle formed between medial wall of the ICA and lateral wall of the ECA). Distance factor was calculated as the ratio of the ICA centerline length (solid bold line) to the shortest distance between two locations: the end of the bulb and point where two centerlines branch (dashed bold line).
We determined the three-dimensional bifurcation angles and two-dimensional planarity angle of each individual carotid artery bifurcation and calculated the mean angles with standard deviations. Bifurcation angles were calculated using two methods: as the angle formed by the directional vectors of the branching arterial axes [13,32] and as the one formed by the medial wall of the ICA and lateral wall of the ECA [7] (Fig. 2). The branching point of the ICA and ECA centerlines was determined using the technique similar to the one described in Smith et al. [32].
Arterial Tortuosity.
Previous investigators have quantitatively assessed in vivo carotid artery tortuosity from planar images [6,32]. However, actual vessel tortuosity will inevitably be misrepresented by two-dimensional analysis due to projection errors, because in vivo arterial curvature is rarely planar and at right angles to the imaging projection [11]. Three-dimensional studies have proposed several methods to characterize the arterial tortuosity.
Distance Factor.
Perhaps the most simple type of tortuosity analysis employs the one-dimensional metric called “distance factor” which is defined as the ratio between the vessel path length and the distance between two endpoints (Fig. 2). Tortuosity therefore may be thought of as the fractional increase in length of the tortuous vessel relative to a perfectly straight path [13]. It can therefore be calculated as (L/d) − 1, where L is the length of the vessel centerline between the two points, and d is the shortest distance between them.
Curvature and Torsion.
In three-dimensional analysis tortuosity of the artery is best described by the well-known Frenet formulas which define the tortuosity of the spatial curve (arterial centerline) through its curvature and torsion [11,23–25]. The Frenet frame is formed by three vectors: tangent, normal, and binormal that form the orthonormal basis.
The curvature metric measures the rate of change in the tangent vector at each point of the arterial centerline curve, whereas the torsion metric measures the rate of change in the orientation (binormal vector of the curve) of the osculating plane. Curvature can also be thought of as the reciprocal of the radius of the osculating circle, the center of which lies on the normal vector of the Frenet frame and the osculating plane is defined by the normal and tangent vector to the curve at the point. For a parametrically defined space curve c(t) = (x(t), y(t), z(t)), its curvature k at a particular point of the curve can be found from [26]
| (1) |
Here primes denote derivatives with respect to t.
The nonplanar nature of three-dimensional vessel tortuosity can be gauged by a measure of torsion of its centerline. Torsion describes how the trajectory twists out of the plane perpendicular to the binormal vector. Torsion is positive for a right-handed curve and negative for a left-handed curve. If torsion equals zero, then a curve is planar. For a parametrically defined space curve, its torsion τ at a point can be found from [26]
| (2) |
It follows from Eqs. (1) and (2) that the spatial arterial centerline curve must be at least three times differentiable to provide the closed form solutions of derivatives along the arterial path. To achieve this, discrete data extracted during centerline construction were smoothed by fitting them with Fourier series [27]. We followed Choi et al. [27] in introducing the cost function using a degree of the Fourier smoothing mode as an argument variable. The results obtained with the use of that function were then visually inspected and the coefficient of multiple determinations was calculated. This allowed us to eliminate spurious irregularities of the centerlines while maintaining good description of the geometry and maintaining consistency of calculations. All curve fitting was performed in Matlab to obtain parameterized centerline curves for each considered arterial segment. After parameterization, derivatives of the smooth-fitted centerline curves for obtaining curvature and torsion values were calculated.
In addition to calculating curvature and torsion, combined curvature CC was calculated as [11]
Combined curvature metric accounts for both curvature and torsion simultaneously.
Curvature, torsion, and combined curvature were calculated at a number of evenly spaced points along the entire length of the centerlines. A sampling frequency of 1 point/mm was employed throughout the study ensuring smooth distribution of the calculated geometrical quantities.
Accuracy of Curvature and Torsion Determination.
Accuracy of curvature and torsion calculation was assessed by considering an analytic spatial curve representing a helix for which curvature and torsion are known. In Cartesian coordinates a helix has the following parameterization:
Here a is the radius of a helix and 2πb is its pitch. Curvature and torsion for this helix can then be calculated from the following analytical formulas:
| (3) |
An array of points representing the helix was used to validate the accuracy of numerical curvature and torsion calculations. For each point of the helix curve both curvature and torsion were calculated using formulas (1) and (2). Since both these geometrical parameters are constant for a helix, their average values across all points of the curve were estimated. The error for curvature and torsion was calculated as absolute difference between the analytical values calculated using formulas (3) and numerical values calculated using formulas (1) and (2) and was assessed as a percentage of the analytical value. Analysis showed that error of numerical calculation was 0.01% for curvature and 0.2% for torsion. This assessment demonstrated the validity of the developed code used for further calculation of curvature and torsion.
Cross-Sectional Analysis.
Analysis of the arterial cross sections was performed to answer two questions. First, how different the shape of the arterial lumen is from that of a circle and second, how does the cross-sectional area of the artery change along its length. To answer the first question, the ratio of ellipse semimajor to semiminor axes (B/A) was calculated for each cross section along the length of the artery. We note that prior to performing this analysis, cross sections were rotated normal to the arterial centerlines (see schematics in Fig. 1). This allowed us to properly characterize oblique arterial segments. The second question was addressed by calculating the cross-sectional area of the ellipse as πAB. To avoid overestimation of the cross-sectional area in the region of the bulb, we have extended the CCA centerline (marked with a green line on Fig. 1) and oriented all bulb cross sections normal to this line (instead of using ICA and ECA centerlines in this region). In addition to calculating separate cross-sectional areas for the ECA and ICA after division of the CCA, the cumulative area of both the ICA and ECA was calculated as well.
Results
Three-Dimensional Geometry of the Mean Carotid Artery.
The mean three-dimensional carotid artery geometry constructed by averaging the 16 datasets of elliptic cross sections is presented in Fig. 3. Four different views of the artery (anterior, posterior, lateral, and medial) are presented and demonstrate the complexity and nonplanarity of the built mean geometry. It is tortuous, with a bend in the anterior-posterior plane centered around the carotid bulb. The axis of the distal ICA is shifted medially relative to the axis of the proximal CCA. The distal ECA has a bend in the anterior-posterior plane.
Fig. 3.
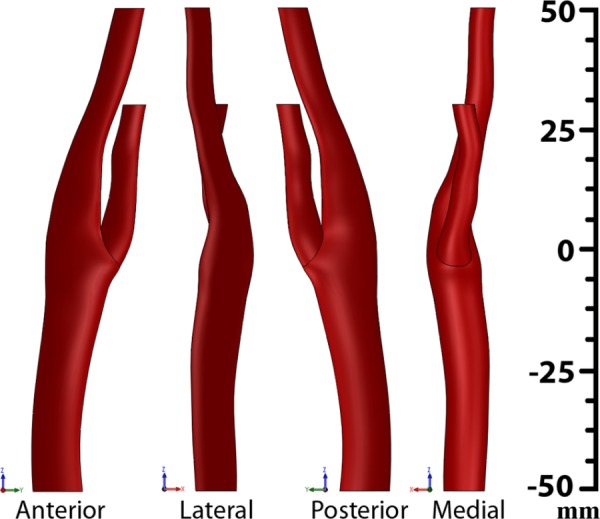
Anterior, lateral, posterior, and medial views of the mean carotid artery reconstructed from the results of CTA studies of 16 patients with carotid artery disease. See conventions of the anterior, lateral, posterior, and medial directions in Fig. 2.
Angles of Carotid Bifurcation.
The bifurcation angles were calculated as those formed by the arterial centerlines and those formed between the medial wall of the ICA and lateral wall of the ECA. The average bifurcation angle measured using mean center-lines was 36 deg ± 11 deg. The bifurcation angle formed by the medial wall of the ICA and lateral wall of the ECA in the mean model was 15 deg ± 14 deg. Though the bifurcation angle measurements obtained using the two techniques are more than twofold different, the standard deviation is comparable. Of interest, the two datasets of angles have demonstrated moderate positive correlation with Pearson's coefficient of 0.39. Planarity angle was measured in the anterior-posterior plane [14]. Mean planarity angle was 11 deg ± 10 deg. No correlation was found between the planarity angle and the angle of bifurcation (Pearson coefficient = 0.18).
Arterial Tortuosity.
The distance factor for the mean carotid artery was 0.024 ± 0.02. Distributions of curvature, torsion, and combined curvature and their inter-patient variations for the mean arterial geometry are plotted in Figs. 4(b)–4(d). Centerlines that were used to calculate these distributions and their Frenet frame vectors (tangent, normal, and binormal) are plotted in Fig. 4(a).
Fig. 4.
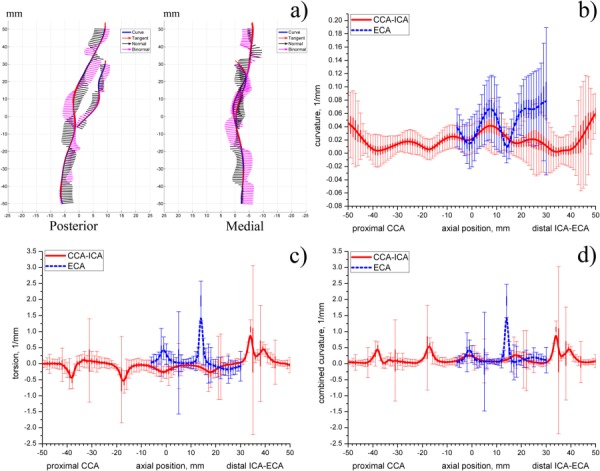
(a) Centerlines of the mean carotid artery plotted in the posterior and medial planes. Frenet frame at each point of the centerline is defined by tangent, normal, and binormal vectors; (b)–(d) distributions of centerline curvature (b), torsion (c), and combined curvature (d) along the length of the mean artery. Thin vertical lines represent standard deviations, thick vertical lines represent standard errors.
Axial distributions of three-dimensional curvature, torsion, and combined curvature provide a comprehensive representation of the varying severity, nonplanarity, and overall tortuosity of the carotid artery. These distributions show the complex three-dimensional nature of the arterial centerline paths that relate peaks in curvature or torsion to positions along the length of the artery.
In particular, high values of curvature are observed in the bulb region as well as in the distal ECA. These regions correspond to the tortuous centerline behavior seen in Fig. 4(a). Smaller variations of curvature are also observed in the proximal CCA and distal ICA. High values of curvature at the boundaries (most proximal CCA and most distal ICA) may be due to boundary effects produced by parameterization.
Torsion distribution generally fluctuates around zero which means that the centerline generally belongs to the same osculating plane. However, peaks in torsion are observed in the proximal CCA and distal ICA and ECA which indicates that in these areas the centerline possesses significant nonplanar behavior.
We note that combined curvature and torsion distributions are very similar. That is due to substantially higher torsion values than those of the curvature. Since combined curvature is always positive, negative peaks in torsion are reflected on the positive half of the combined curvature vertical axis.
Patient variability was analyzed by calculating standard deviations and standard errors in curvature, torsion, and combined curvature in multipatient datasets. Substantial variability for curvature is observed in the bulb and distal ICA and ECA. High variability in the proximal CCA and the most distal ICA may be due to parameterization. Of interest, standard deviations in both curvature and torsion are higher for the ECA than for the ICA branch. Also, an interesting observation is that variability drops at the level of 16 and 36 mm distal into the ICA from the flow divider and at the level 14 mm distal from the flow divider into the ECA.
Standard deviation in torsion and combined curvature graphs has sudden peaks in its value. These peaks are located diffusely along the entire length of the artery. We speculate that presence of these peaks may be due to high susceptibility of torsion calculation to error associated with higher-order derivatives. Similar peaks were reported elsewhere [11,25] in studies of geometry of the coronary arteries, abdominal aorta, visceral branch arteries, and common iliac arteries.
Cross-Sectional Analysis.
The ratio of semimajor to semiminor axes (B/A) for the lumen elliptic cross section plotted along the length of the artery is presented in Fig. 5(a). Values of B/A closer to 1 indicate more circular shape while larger values show that the cross section of the artery is more oblate-shaped. It can be seen from the figure that the cross section of the carotid artery is most different from the circle in the bulb region. The largest B/A ratio is observed for the flow divider level, while values closer to 1 are present at more proximal locations. Cross sections of the proximal ECA more closely resemble a circle than cross sections of the proximal ICA (the ECA curve is lower); however ICA becomes more circular distally. Of interest, average B/A ratio for the entire mean carotid geometry fluctuates around 1.2.
Fig. 5.
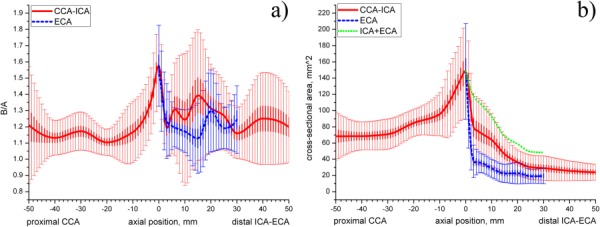
(a) B/A radio of semimajor to semiminor axes of the elliptical cross sections plotted along the length of the artery; (b) change of cross-sectional area (mm2) along the length of the artery. Green dotted line represents cumulative ICA + ECA area. Thin vertical lines represent standard deviations of presented mean data, thick vertical lines represent standard errors.
Substantial variations in the ratio are observed for all arterial branches. The largest variation of the B/A ratio is seen for the ICA and ECA branches and at the proximal CCA cross sections. Another interesting observation is that standard deviation substantially drops immediately after the flow divider level which indicates that at this location in most considered geometries cross sections had a pronounced elliptic shape with B/A ratio around 1.2–1.55. The second drop of standard deviation for the ICA is observed 30 mm distal to the flow divider.
The change of cross-sectional area of the mean carotid artery along its length is presented in Fig. 5(b). It can be seen that the cross-sectional area changes substantially on its way from the most proximal CCA to the most distal ICA location. The area of the proximal CCA stays fairly constant up to 30 mm proximal to the flow divider. It then starts to increase and reaches its peak at the flow divider. After that the cross-sectional area significantly drops in size due to separation of the artery into ECA and ICA branches. After separation the cross-sectional area of both ICA and ECA continues to decrease gradually, however cross-sectional area of the ICA stays larger than that of the ECA.
Of interest was to calculate the cumulative area of the ICA and ECA after the division of the CCA. As seen from Fig. 5(b), cumulative ICA + ECA area also decreases eventually possessing smaller cross-sectional area than that of the proximal CCA. Variations in the cross-sectional area between the patients are substantial. The largest variations are observed for the bulb region while the smallest variations can be seen in the cross-sectional areas of the distal ICA and ECA. Variability in the cross-sectional area of the most proximal CCA is substantial.
For easy clinical reference we have also calculated the change of the arterial diameters along the length of the artery. These diameters were calculated as those of the circles with areas equivalent to the ones measured from the area contour, i.e., D = 2 · . Equivalent diameters of the CCA, ICA, and ECA with respect to the axial location are plotted in Fig. 1. They follow the same trends as the cross-sectional areas plotted in Fig. 5(b) and are in agreement with data reported by Smith et al. [32] for severe stenoses.
Discussion
The observation that atherosclerotic plaque tends to occur preferably in places with specific hemodynamics, determined primarily by complex arterial geometry, has led to a widely accepted notion that carotid geometry may be a risk factor for atherosclerotic disease [1,3,4,13,14,28]. Characterization and quantification of the three-dimensional carotid geometry is essential for calculation of atherosclerosis-related mechanical factors such as fluid wall shear stress, or mechanical stresses and strains in the arterial wall [3–5] and therefore is vital to enhance our knowledge of the pathologic mechanisms. This knowledge is also invaluable to endovascular device manufacturers and users, because arterial tortuosity frequently poses problems for endovascular sheath navigation, device deployment, and optimal device performance in the treatment of carotid pathology [11]. This group of researchers is particularly interested in the mean geometrical features of the artery since they manufacture devices targeting broad patient population.
In this study we have characterized the complex three-dimensional nature of the carotid artery geometry in patients with severe carotid bifurcation disease, built the mean arterial geometry, and analyzed geometric inter-patient variations. Our results show that contrary to the commonly accepted notion, the mean carotid geometry is tortuous, exhibiting nonplanarity and both inand out-of-plane curvature. It has a bend in the anterior-posterior plane centered around the carotid bulb, shifted axis of the distal ICA, and bended distal ECA in the anterior-posterior plane. These results demonstrate that the assumption of a bifurcation for which all three vessels lie in the same plane and for which the ICA and ECA branch symmetrically from the CCA is a simplification of the actual case. This is particularly important for mathematical models of the carotid artery bifurcation, since nonplanarity and tortuosity are important factors that have significant influence on arterial hemodynamics and biomechanics [29].
Our built mean geometry had a small angle of bifurcation of only 36 deg ± 11 deg if measured using centerlines and 15 deg ± 14 deg if measured using the medial wall of the ICA and lateral wall of the ECA. Bifurcation angle severely affects the flow in the carotid artery [30], therefore its accurate calculation is important for mathematical modeling. Bifurcation angle in our model is smaller than most previously reported angles. In particular, using centerlines Thomas et al. [13] reported the angle of bifurcation of 61.5 deg ± 4.1 deg, Forster et al. [6] reported 56 deg ± 13 deg, Bharadvaj et al. [31] reported 55 deg, and DeSyo et al. [9] reported 40.5 deg ± 17.1 deg. All these studies, with the exception of DeSyo [9], were performed on disease-free arteries. Closer to our findings were results reported by Smith et al. [32] who reported an angle of 38.3 ± 12.8 deg, Thomas et al. [12] who reported angles of 34 deg, and Goubergrits et al. [8] who calculated the bifurcation angle as 33.8 deg ± 12.2 deg. All three studies were performed on stenosed arteries. Fisher and Fieman [7] have used a different method for measuring bifurcation angles. They have measured the angle as the one formed by the medial wall of the ICA and lateral wall of the ECA. Their results were twofold larger than those obtained in our study, although they were also performed on diseased arteries. Determined planarity angle was 11 deg ± 10 deg which is threefold smaller than data presented by Forster et al. [6]. Our results are closer to those reported by Thomas et al. [13] who reported mean planarity angle of 8.5 deg ± 8.1 deg for senior patients. We speculate that substantial differences in measured angles may be associated with patient population [13], and existence of severe stenoses [32]. In addition, differences may come from different methods of measurement used by authors. In particular, studies that have used two-dimensional vessel views to make their measurements may be less accurate than those using the actual three-dimensional representation of the artery due to inevitable incurred projection errors.
The well-known Frenet formulas were used to describe arterial curvature and torsion. We note that even though curvature and torsion are conventionally used for characterization of the arterial tortuosity, both these characteristics are point-specific and are very sensitive to the geometrical data. This is most likely the reason why torsion is less frequently used in characterization of the arterial geometry than curvature, because it is more susceptible to error in calculations associated with higher-order derivatives. Axial distributions of three-dimensional curvature, torsion, and combined curvature showed a comprehensive representation of the varying severity, nonplanarity, and overall tortuosity of the carotid artery while the one-dimensional distance factor lumped the three-dimensional information in one-dimension and hence was not able to clearly differentiate local curvature changes. Arterial tortuosity severely influences the flow [29], therefore its precise characterization is vital for accurate calculation of hemodynamics parameters, such as wall shear stress.
Analysis of arterial cross-sectional areas was performed to study how different the cross section of the carotid artery is from the circle and how does the cross-sectional area of the artery change along its length. Our data showed that arterial cross sections may be significantly different from the circle, especially in the bulb region. The average semimajor to semiminor ratio for the mean carotid artery was 1.2 demonstrating that the assumption that three-dimensional carotid artery geometry can be captured by inscribing circles or spheres may be an oversimplification of the actual case. The shape of the arterial cross section is important for calculation of flow rate which may be over- or underestimated if the cross section is assumed circular. Analysis of cross-sectional area change along the length of the artery showed that cross-sectional area of the ICA and ECA branches combined was less than area of the CCA before its bifurcation. We speculate that this may be partially due to our disregard of small ECA branches that accommodate part of the ECA flow and allow the ECA lumen to be smaller.
The analysis presented here provides a better understanding of the carotid artery morphology and geometric factors relevant to hemodynamics. Three-dimensional geometry analyzed in this work can be used in combination with flow data obtained on the same patient group [18] in mathematical models. Mathematical models built using the mean geometry described here will more accurately represent the broad patient population than most frequently used simplified geometries and may lead to improved understanding of carotid bifurcation pathophysiology through analysis of atherosclerosis-related mechanical factors and assist in patient selection, preoperative planning, and design of new pros-theses for arterial reconstruction. This mean geometry is available to prospective users upon request.
Acknowledgment
This work was supported in part by NIH Grants No. K08HL079967 and R01AG034995 and by the grants from Nebraska Research Initiative Nanofiber Core Facility, National Science Foundation, and UNL/UNMC Engineering for Medicine initiative.
Contributor Information
Alexey V. Kamenskiy, Department of Mechanical and Materials Engineering, , University of Nebraska-Lincoln, , Lincoln, NE 68588
Iraklis I. Pipinos, Department of Surgery, , University of Nebraska-Medical Center, , Omaha, NE 68198
Jai Bikhchandani, Creighton University Medical Center, , Omaha, NE 68131.
Yuris A. Dzenis, Department of Mechanical and Materials Engineering, , University of Nebraska-Lincoln, , Lincoln, NE 68588 , e-mail: ydzenis@unl.edu.
References
- [1]. Friedman, M. H. , Deters, O. J. , Mark, F. F. , Bargeron, C. B. , and Hutchins, G. , 1983, “Arterial Geometry Affects Hemodynamics. A Potential Risk Factor for Athersoclerosis,” Atherosclerosis, 46(2), pp. 225–231. 10.1016/0021-9150(83)90113-2 [DOI] [PubMed] [Google Scholar]
- [2]. Ku, D. N. , Giddens, D. P. , Zarins, C. K. , and Glagov, S. , 1985, “Pulsatile Flow and Atherosclerosis in the Human Carotid Bifurcation. Positive Correlation Between Plaque Location and Low Oscillating Shear Stress,” Arteriosclerosis, 5(3), pp. 293–302. 10.1161/01.ATV.5.3.293 [DOI] [PubMed] [Google Scholar]
- [3]. Chatzizisis, Y. S. , Coskun, A. U. , Jonas, M. , Edelman, E. R. , Feldman, C. L. , and Stone, P. H. , 2007, “Role of Endothelial Shear Stress in the Natural History of Coronary Atherosclerosis and Vascular Remodeling: Molecular, Cellular, and Vascular Behavior,” J. Am. Coll. Cardiol., 49(25), pp. 2379–2393. 10.1016/j.jacc.2007.02.059 [DOI] [PubMed] [Google Scholar]
- [4]. Malek, A. M. , Alper, S. L. , and Izumo, S. , 1999, “Hemodynamics Shear Stress and its Role in Atherosclerosis,” JAMA, J. Am. Med. Assoc., 282(21), pp. 2035–2042. 10.1001/jama.282.21.2035 [DOI] [PubMed] [Google Scholar]
- [5]. Younis, H. F. , Kaazempur-Mofrad, M. R. , Chan, R. C. , Isasi, A. G. , Hinton, D. P. , Chau, A. H. , Kim, L. A. , and Kamm. R. D., 2004, “Hemodynamics and Wall Mechanics in Human Carotid Bifurcation and its Consequences for Atherosclerosis: Investigation of Inter-Individual Variation,” Biomech. Model Mechanobiol., 3, pp. 17–32. 10.1007/s10237-004-0046-7 [DOI] [PubMed] [Google Scholar]
- [6]. Forster, F. K. , Chikos, P. M. , and Frazier, J. S. , 1985, “Geometric Modeling of the Carotid Bifurcation in Humans: Implications in Ultrasonic Doppler and Radiologic Investigations,” J. Clin. Ultrasound, 13(6), pp. 385–390. 10.1002/jcu.1870130603 [DOI] [PubMed] [Google Scholar]
- [7]. Fisher, M. , and Fieman, S. , 1990, “Geometric Factors of the Bifurcation in Carotid Atherogenesis,” Stroke, 21(2), pp. 267–271. 10.1161/01.STR.21.2.267 [DOI] [PubMed] [Google Scholar]
- [8]. Goubergrits, L. , Affeld, K. , Fernandez-Britto, J. , and Falcon, L. , 2002, “Geometry of the Human Common Carotid Artery. A Vessel Cast Study of 86 Specimens,” Pathol. Res. Pract., 198(8), pp. 543–551. 10.1078/0344-0338-00299 [DOI] [PubMed] [Google Scholar]
- [9]. Syo, D. D. , Franjic, B. D. , Lovricevic, I. , Vukelic, M. , and Palenkic, H. , 2005, “Carotid Bifurcation Position and Branching Angle in Patients With Athero-sclerotic Carotid Disease,” Coll. Antropol., 29(2), pp. 627–632. [PubMed] [Google Scholar]
- [10]. Thomas, J. B. , Jong, L. , Spence, J. D. , Wasserman, B. A. , Rutt, B. K. , and Steinman, D. A. , 2005, “Anthropometric Data for Magnetic Resonance Imaging of the Carotid Bifurcation,” J. Magn. Reson. Imaging, 21, pp. 845–849. 10.1002/jmri.20317 [DOI] [PubMed] [Google Scholar]
- [11]. O'Flynn, P. M. , O'Sullivan, G. , and Pandit, A. S. , 2007, “Methods for Three-Dimensional Geometric Characterization of the Arterial Vasculature,” Ann. Biomed. Eng., 35(8), pp. 1368–1381. 10.1007/s10439-007-9307-9 [DOI] [PubMed] [Google Scholar]
- [12]. Thomas, J. B. , Che, S. L. , Milner, J. S. , Antiga, L. , Rutt, B. K. , Spence, J. D. , and Steinman, D. A. , 2003, “Geometric Characterization of the Normal and Mildly Diseased Human Carotid Bifurcation,” Summer Bioengineering Conference, Sonesta Beach Resort in Key Biscayne, Florida. [Google Scholar]
- [13]. Thomas, J. B. , Antiga, L. , Che, S. L. , Milner, J. S. , Steinman, D. A. H. , Spence, J. D. , Rutt, B. K. , and Steinman, D. A. , 2005, “Variation in the Carotid Bifurcation Geometry of Young Versus Older Adults: Implications for Geometric Risk of Atherosclerosis,” Stroke, 36(11), pp. 2450–2456. 10.1161/01.STR.0000185679.62634.0a [DOI] [PubMed] [Google Scholar]
- [14]. Lee, S.-W. , Antiga, L. , Spence, J. D. , and Steinman, D. A. , 2008, “Geometry of the Carotid Bifurcation Predicts its Exposure to Disturbed Flow,” Stroke, 39(8), pp. 2341–2347. 10.1161/STROKEAHA.107.510644 [DOI] [PubMed] [Google Scholar]
- [15]. Kamenskiy, A. V. , Pipinos, I. I. , Desyatova, A. S. , Salkovskiy, Y. E. , Yu, Kossovich, L. , Kirillova, I. V. , Bockeria, L. A. , Morozov, K. M. , Polyaev, V. O. , Lynch, T. G. , and Dzenis, Y. A. , 2009, “Finite Element Model of the Patched Human Carotid,” Eur. J. Vasc. Endovasc. Surg., 43, pp. 533–541. 10.1177/1538574409345030 [DOI] [PubMed] [Google Scholar]
- [16]. Milner, J. S. , Moore, J. A. , Rutt, B. K. , and Steinman, D. A. , 1998, “Hemodynamics of Human Carotid Artery Bifurcations: Computational Studies With Models Reconstructed From Magnetic Resonance Imaging of Normal Subjects,” J. Vasc. Surg., 28(1), pp. 143–156. 10.1016/S0741-5214(98)70210-1 [DOI] [PubMed] [Google Scholar]
- [17]. Taylor, C. A. , and Humphrey, J. D. , 2009, “Open Problems in Computational Vascular Biomechanics: Hemodynamics and Arterial Wall Mechanics,” Comput. Methods Appl. Mech. Eng., 198(45–46), pp. 3514–3523. 10.1016/j.cma.2009.02.004 [DOI] [PMC free article] [PubMed] [Google Scholar]
- [18]. Kamenskiy, A. V. , Dzenis, Y. A. , MacTaggart, J. N. , Desyatova, A. S. , and Pipinos, I. I. , 2011, “In Vivo Three-Dimensional Blood Velocity Profile Shapes In The Human Common, Internal, and External Carotid Arteries,” J. Vasc. Surg., 54(4), pp. 1011–1020. 10.1016/j.jvs.2011.03.254 [DOI] [PubMed] [Google Scholar]
- [19]. Selzer, R. H. , Hodis, H. N. , Kwong-Fu, H. , Mack, W. J. , Lee, P. L. , Liu, C. R. , and Liu, C. H. , 1994, “Evaluation of Computerized Edge Tracking For Quantifying Intima-Media Thickness of the Common Carotid Artery From B-Mode Ultrasound Images,” Atherosclerosis, 111(1), pp. 1–11. 10.1016/0021-9150(94)90186-4 [DOI] [PubMed] [Google Scholar]
- [20]. Perktold, K. , and Rappitsch, G. , 1995, “Computer-Simulation of Local Blood-Flow and Vessel Mechanics in a Compliant Carotid-Artery Bifurcation Model,” J. Biomech., 28, pp. 845–856. 10.1016/0021-9290(95)95273-8 [DOI] [PubMed] [Google Scholar]
- [21]. Delfino, A. , Stergiopulos, N. , Moore, Jr., J. E. , and Meister, J.-J. , 1997, “Residual Strain Effects on the Stress Field in a Thick Wall Finite Element Model of the Human Carotid Bifurcation,” J. Biomech., 30(8), pp. 777–786. 10.1016/S0021-9290(97)00025-0 [DOI] [PubMed] [Google Scholar]
- [22]. Maurits, N. M. , Loots, G. E. , and Veldman, A. E. P. , 2007, “The Influence of Vessel Wall Elasticity and Peripheral Resistance on the Carotid Artery Flow Wave Form: A CFD Model Compared to In Vivo Ultrasound Measurements,” J. Biomech., 40, pp. 427–436. 10.1016/j.jbiomech.2005.12.008 [DOI] [PubMed] [Google Scholar]
- [23]. Chen, S. Y. , Carroll, J. J. D. , and Messenger, J. C. , 2002, “Quantitative Analysis of Reconstructed 3-D Coronary Arterial Tree and Intracoronary Devices,” IEEE Trans. Med. Imaging, 21(7), pp. 724–740. 10.1109/TMI.2002.801151 [DOI] [PubMed] [Google Scholar]
- [24]. Liao, R. , Chen, S-Y. , Messenger, J. M. , Groves, B. , Burchenal, J. , and Carroll, J. D. , 2002, “Four-Dimensional Analysis of Cyclic Changes in Coronary Artery Shape,” Cathet. Cardiovasc Interv., 55(3), pp. 344–354. 10.1002/ccd.10106 [DOI] [PubMed] [Google Scholar]
- [25]. Puentes, J. , Roux, C. , Garreau, M. , and Coatrieux, J. L. , 1998, “Dynamic Feature Extraction of Coronary Artery Motion Using DSA Image Sequences,” IEEE Trans. Med. Imaging, 17(6), pp. 857–871. 10.1109/42.746619 [DOI] [PubMed] [Google Scholar]
- [26]. Pressley, A. , 2010, Elementary Differential Geometry, Springer, London, p. 395. [Google Scholar]
- [27]. Choi, G. , Cheng, C. P. , Wilson, N. M. , and Taylor, C. A. , 2009, “Methods for Quantifying Three-Dimensional Deformation of Arteries Due to Pulsatile and Nonpulsatile Forces: Implications for the Design of Stents and Stent Grafts,” Ann. Biomed. Eng., 37(1), pp. 14–33. 10.1007/s10439-008-9590-0 [DOI] [PubMed] [Google Scholar]
- [28]. Thomas, J. B. , Milner, J. S. , and Steinman, D. A. , 2002, “On the Influence of Vessel Planarity on Local Hemodynamics at the Human Carotid Bifurcation,” Biorheology, 39(3-4), pp. 443–448. [PubMed] [Google Scholar]
- [29]. Caro, C. G. , Doorly, D. J. , Tarnawski, M. , Scott, K. T. , Long, Q. , and Dumoulin, C. L. , 1996, “Non-Planar Curvature and Branching of Arteries and Non-Planar-Type Flow,” Proc. R. Soc. London, Ser. A, 452(1944), pp. 185–197. 10.1098/rspa.1996.0011 [DOI] [Google Scholar]
- [30]. Berger, S. A. , and Jou, L. D. , 2000, “Flows in Stenotic Vessels,” Annu. Rev. Fluid Mech., 32, pp. 347–384. 10.1146/annurev.fluid.32.1.347 [DOI] [Google Scholar]
- [31]. Bharadvaj, B. K. , Mabon, R. F. , and Giddens, D. P. , “Steady Flow in a Model of the Human Carotid Bifurcation. Part I and II,” J. Biomech., 15, pp. 349–378. 10.1016/0021-9290(82)90057-4 [DOI] [PubMed] [Google Scholar]
- [32]. Smith, R. F. , Rutt, B. K. , Fox, A. J. , Rankin, R. N. , and Holdsworth, D. W. , 1996, “Geometric Characterization of Stenosed Human Carotid Arteries,” Acad. Radiol., 3, pp. 898–911. 10.1016/S1076-6332(96)80297-2 [DOI] [PubMed] [Google Scholar]