

Abstract
Characteristic models of the upper conducting airways are needed to evaluate the performance of existing pharmaceutical inhalers and to develop new respiratory drug delivery strategies. Previous studies have focused on the development of characteristic mouth–throat (MT) geometries for orally inhaled products; however, characteristic upper tracheobronchial (TB) geometries are currently not available. In this study, a new characteristic model of the upper TB airways for an average adult male was developed based on an analysis of new and existing anatomical data. Validated computational fluid dynamics (CFD) simulations were used to evaluate the deposition of monodisperse and realistic polydisperse aerosols from multiple inhalers. Comparisons of deposition results between the new model and a simpler geometry were used to identify the effects of different anatomical features on aerosol deposition. The CFD simulations demonstrated a good match to regional pharmaceutical aerosol deposition from in vitro experiments in the same geometry. The deposition of both monodisperse and pharmaceutical aerosols was increased in the new TB geometry as a result of additional anatomical detail on a regional and highly localized basis. Tracheal features including an accurate coronal angle, asymmetry, and curvature produced a skewed laryngeal jet and significantly increased regional deposition. Branch curvature and realistic cross-sections increased deposition in the remainder of the TB model. A hexahedral mesh style was utilized to provide the best solution. In conclusion, a number of physiological features in the upper TB region were shown to influence deposition and should be included in a characteristic model of respiratory drug delivery.
Keywords: respiratory drug delivery, upper airway model, CFD simulations, in vitro experiments, in vivo–in vitro correlations, IV–IVCs, pharmaceutical inhaler testing, aerosol deposition
1. Introduction
Accurate characteristic models of the TB airways are needed for the development and testing of pharmaceutical inhalers and the evaluation of different respiratory drug delivery approaches. Aerosol deposition within these models can be evaluated using in vitro experiments [1,2], CFD [3,4], or a concurrent in vitro and CFD approach [5–7]. Developing relationships of aerosol deposition, or other variables, between results in living subjects and approximate models is referred to as producing in vivo–in vitro correlations (IV–IVCs) [2,8].
In general, airway models can be classified as simplified, patient-specific, and characteristic. Simplified models of the airways provide some geometric similarity to in vivo conditions but may leave out key details that affect the output variables of interest. Patient-specific models are based on reconstructions from medical images of individual subjects and often attempt to include all geometric details available in the scans. In comparison, characteristic models seek to capture all features that affect the variables of interest, e.g., aerosol deposition, while omitting additional details to make the models as efficient as possible. Unnecessary details may be omitted to improve manufacturability of the model, analysis of the model in experiments, or meshing of the model in CFD simulations. In this study, total, regional, and local deposition for monodisperse and realistic pharmaceutical aerosols are considered as the variables of interest. Ideally, a characteristic model should be as simple as possible to facilitate both computational and in vitro testing, but contain sufficient detail to reproduce these variables consistent with in vivo conditions.
Considering the oropharyngeal region, or MT airways, several characteristic models have been developed. The study of Stapleton et al. [9] was the first to report a characteristic MT model, which was based on simple geometries and retained basic anatomical features from medical scans as well as direct observations of living subjects. This model is referred to as the Alberta MT geometry and has been widely implemented in both numerical and in vitro aerosol deposition studies [1,10–14]. For monodisperse aerosols, Grgic et al. [14] showed good agreement in deposition between the Alberta geometry and the in vivo data of Stahlhofen et al. [15]. Similarly, Zhang et al. [2] showed the Alberta geometry matched in vivo deposition results for a metered dose inhaler (MDI) and dry powder inhaler (DPI). Xi and Longest [16] developed a characteristic MT geometry based on successive simplifications of scan and cast based models that included a noncircular glottis, which is important to accurately capture the laryngeal jet entering the TB airways [17]. Deposition results were shown to be similar to existing in vitro and in vivo data sets for monodisperse aerosols [16,18,19]. Delvadia et al. [20,21] recently reported that the elliptical MT geometry was anatomically similar to mean values reported for a variety of measurements from the oropharyngeal consortium [22] and produced deposition results very similar to in vivo conditions for multiple pharmaceutical inhalers.
Considering the upper TB airways, established characteristic models are currently not available, despite the expectation that local deposition in this region is important for many pharmaceutical aerosols. Simplified models of the upper TB airways have been used by numerous researchers, which often implement either symmetric or in-plane bifurcations [23–30]. However, these studies often do not consider how the missing geometric details may affect particle deposition causing differences from in vivo conditions. A number of recent studies have also proposed patient-specific models of the upper TB airways, with some models extending to approximately the eight respiratory bifurcation and beyond, based on images of human subjects [31–40] and airway casts [32,41,42]. A recent study by Lin et al. [36] proposed patient-specific models of the entire TB airways based on high resolution imaging. In general, these available patient-specific models of the airways either do not compare dimensions with available anatomical data or do not consider aerosol deposition in a manner relevant to the evaluation of pharmaceutical products.
Longest and co-workers recently proposed an idealized upper TB geometry extending to the third bifurcation that connects to the elliptical MT model of Xi and Longest [16] and is referred to as Model C. This geometry was constructed using mathematically defined physiologically realistic bifurcation (PRB) units [43] with geometry data from the studies of Yeh and Schum [44], Horsfield et al. [45], and Hammersley and Olson [46]. The model includes asymmetrical branching, out-of-plane rotation, and cartilaginous rings in the trachea. Based on the use of PRB units and published geometric data, the model is fully documented and reproducible by other researchers, and can be downloaded for free at RDD Online2. Tian et al. [47] implemented this upper airway model to evaluate the size increase of pharmaceutical aerosols during enhanced condensational growth delivery using both CFD simulations and in vitro experiments. Model C was used as the upper airway representation for the newly proposed stochastic individual path (SIP) approach for simulating deposition throughout the conducting airways with CFD analysis [47,48]. Longest et al. [49] then implemented Model C and the SIP approach to explore upper and lower TB delivery of MDI and DPI aerosols based on in vitro experiments and CFD simulations. Delvadia et al. [20] showed that the airway diameters of Model C were consistent with average or mean geometric data of adult airways sampled from anatomical studies. Delvadia et al. [20] then included the elliptical MT and Model C in an in vitro setup to capture MT and total lung deposition, and showed good agreement with in vivo data across a range of subject sizes.
Advantages of Model C include the development of a mathematically described geometry along with a configuration that can, for CFD simulations, be meshed with hexahedral elements. Previous studies have shown that hexahedral elements provide a higher quality solution of aerosol transport and deposition and produce results much faster than easy to generate tetrahedral meshes in simple bifurcating geometries [50,51]. However, implementation of mathematically defined PRB units required the introduction of several geometric simplifications.
The objective of this study is to evaluate and compare two potential characteristic models of the upper airways for average adults to be used in future pharmaceutical aerosol testing studies in terms of flow field dynamics, aerosol transport, and aerosol deposition on a total, regional, and local basis. The previously developed idealized Model C is compared with a new Model D created from a TB scan selected based on agreement with average upper airway characteristics. Dimensions of both models are compared with data sources of upper airway anatomy including a sampling of previously published cast data, scan data, and a new database of TB dimensions developed from multiple adult scans. To evaluate similarities and differences in deposition for pharmaceutical aerosols between Models C and D, commonly prescribed MDI and DPI devices are considered. Model validation is performed in comparison with existing in vitro deposition data for these inhalers in the exact MT and Model C geometries considered in this study. Deposition of monodisperse particles is also considered and compared with available in vitro data in similar upper TB geometries. Furthermore, effects of mesh style on CFD results are considered in order to evaluate the need for constructing higher quality hexahedral meshes compared with quickly created tetrahedral approximations. Results are expected to help delineate conditions for which Model C can be considered characteristic of upper TB deposition and to highlight cases where more exact characteristic geometries are needed, such as the newly proposed Model D.
2. Methods
2.1. Airway Models.
In this study, a previously developed idealized upper TB geometry (Model C) is compared with a model based on scan data and selected to be consistent with dimensions for an average-sized adult. Both models extend to approximately the third respiratory bifurcation (B3, with the trachea and main bronchi representing B1) to provide a consistent number of branches down each flow path. As a result, enclosing the model in a chamber and applying constant negative pressure at the outlets produces a flow through each outlet that is proportional to the outlet diameter. As previously described by Tian et al. [48], Model C is based on the anatomical cast dimensions reported by Yeh and Schum [44] and scaled to a lung volume of 3.5 L (length-scale adjustment factor of 0.86), which is consistent with an average adult male during inhaler use [52]. The individual bifurcation units were generated using the physiologically realistic bifurcation (PRB) parameters reported by Heistracher and Hofmann [43]. However, modifications to the equations reported by Heistracher and Hofmann [43] were required to generate smooth asymmetrical branching. Surface properties of the bifurcations such as the carinal ridge and the branch radii of curvatures were taken from the measurement studies of Horsfield et al. [45] and Hammersley and Olson [46]. These bifurcation units were rotated out of plane to approximate the gravity angles specified by Yeh and Schum [44]. However, the resulting angles in the sagittal and coronal planes sometimes differ from those reported by Sauret et al. [32]. The TB model included one bifurcation in each of the five lung lobes, except for the right middle and lower lobes, which contained one branch each. Cartilaginous rings were included in the Model C trachea, and a D-shaped tracheal cross section was implemented. Dimensions of these geometric features were based on in-house medical scans and the cadaver measurements of Russo et al. [25], as described by Tian et al. [48].
To develop Model D, a patient-specific scan was selected from a dataset of pre-existing images that was consistent with mean airway dimensions for adults. A set of high resolution pre-existing CT scans was obtained from the VCU Medical Center using an approved IRB protocol. Scans were de-identified at the Medical Center prior to analysis. The scans began just below the larynx, had a slice thickness of 1 mm, were obtained using a SIEMENS Sensation 16 scanner, and included the entire left and right lungs. The new dataset of scans consisted of eight subjects with five males and three females, ages ranging from 20 to 60 years, and body heights ranging from 170 to 180 cm. Average upper TB airway dimensions were assessed by considering this dataset, available data from previous airway cast studies, and other publically available scan data. Based on critical dimensions of airway diameters, cross-sectional areas, and branch lengths, a single representative scan was selected from the dataset that provided a reasonable approximation to average data for an adult male. Comparisons of the Model D dimensions are made with available data later in this section. The scan selected for Model D was from a 50 year old male with a body mass of approximately 82 kg and a height of approximately 178 cm. The development of an average female model or a set of models that includes small, medium, and large males and females is left as a future study.
Previous studies of patient-specific models have typically employed custom or commercial translation software to convert the 2D cross-sectional images of medical scans into 3D STL models. However, use of STL geometries requires the implementation of tetrahedral mesh elements. In this study, conversion to a 3D surface file was performed using the commercial software Mimics 14.0 (Materialise, Belgium). Cross-sections were then defined using six to eight points, which were extracted to describe the geometry and imported into solid modeling and mesh generation software Gambit 2.4 (ANSYS Inc, Canonsburg, PA). The imported points were used to create surfaces and volumes that could support a hexahedral mesh using a cross-blocking pattern, as described by Vinchurkar and Longest [50]. This process resulted in some minor smoothing of the airway surfaces. However, comparisons of the original 3D rendered surface and reconstructed model for meshing indicated very similar geometries. Length of the trachea for connection to the MT model was determined based on the previous study of Griscom and Wohl [53]. The length of the trachea is defined here as the distance from the glottis to the carinal ridge. The angle of the trachea relative to the horizontal (or vertical) plane of the body was used directly from the supine CT scan. As with Model C, the geometry extended through the third bifurcation of the airways. The outlet branches were ended at the point where expansion to the next bifurcation began, which was approximately 80% of the length of the fourth bifurcation. Both Model C and D were connected to standard MDI and DPI devices, as described later in this section.
Based on comparison of the geometries (Fig. 1), Model D is observed to correct a number of simplifications present in Model C. Additionally, a comparison of the model dimensions for the trachea, left main bronchus (LMB), right main bronchus (RMB), and main bifurcation (B1) angle is shown in Table 1. The length measurements of the bronchi are taken from the intersection of centerlines at the first bifurcation to the intersection of centerlines at the respective second bifurcation (right or left). The length of the RMB is much shorter with Model D, which is expected anatomically, and curvature is present in both main bronchi of Model D. There is also pronounced curvature of the trachea in the region of the first bifurcation, which is present in other patient-specific models [31] due to the presence of the aorta. Cartilaginous rings were not fully resolved in the CT scan and are, therefore, excluded in the Model D geometry. Other notable differences in Model D include a larger tracheal diameter, a smaller main bifurcation angle, and a significantly longer LMB.
Fig. 1.
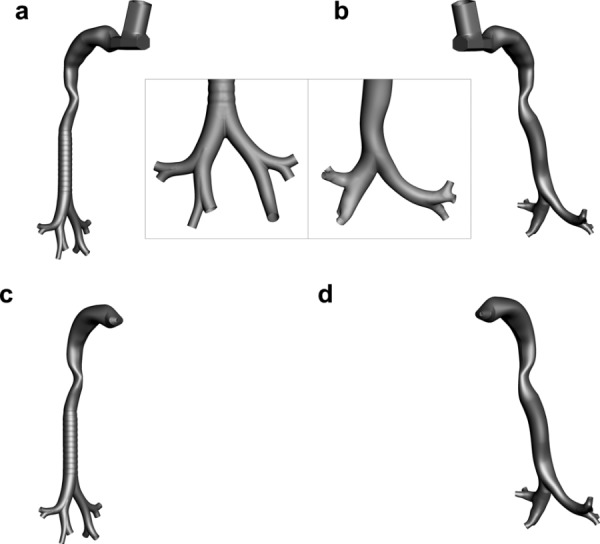
Surface geometries of (a) and (c) Model C compared with (b) and (d) Model D. Each airway was evaluated in combination with an metered dose inhaler (MDI) and dry powder inhaler (DPI). The cases evaluated were: (a) Model C with an MDI, (b) Model D with a MDI, (c) Model C with a DPI, and (d) Model D with a DPI.
Table 1.
Lengths and average diameters (in mm) of trachea and main bronchi for Models C and D. Total angle of the main bifurcation (in degrees) is shown as well.
| Trachea | RMB | LMB | Main Bifurcation Angle | ||||
|---|---|---|---|---|---|---|---|
| L | Davg | L | Davg | L | Davg | ||
| Model C | 137.0 | 16.1 | 34.8 | 14.8 | 34.1 | 12.0 | 66.4 |
| Model D | 131.0 | 19.4 | 23.8 | 14.9 | 55.6 | 11.6 | 57.3 |
Anatomical data of TB dimensions was collected and summarized (Table 2) from the scans used for this study, the Early Lung Cancer Action Program (ELCAP) Public Lung Database3, and other studies. The data is divided into three categories: sets collected from lung casts [45,54,55], patient-specific CT scans, and simplified models [56,57]. The patient-specific data consists of 21 sets in total, including the eight scans collected for this study, 11 scans from ELCAP, and two from other studies [35,37]. The ELCAP scans were obtained from patient screening for early stages of lung cancer, from which 50 sets of data are published and publically available in the database. The scan resolution is 1.25 mm between slices, and nodule locations are provided along with the scan data. For this study, the data sets that were chosen from the ELCAP database did not have any obvious morphological defects. Average diameter measurements were obtained from scans by first taking area measurements along several locations of the relevant airway, averaging those measurements, then finding the diameter based on an approximation of the area as a circle. Length measurements in the main bronchi were taken from the intersection of centerlines on the surface of the airway at the first bifurcation to the relevant second bifurcation intersection. Although the length measurements were desired from the interior of the airways, the software only allowed for surface measurements, which was deemed to provide an accurate estimate. Cast length and diameter measurements are larger than patient-specific measurements in all cases except for tracheal length, which is not surprising given that lung casts are known to expand due to the injection pressure of the cast material. Cast data in Table 2 was not scaled to a corrected lung volume, which is sometimes performed. Tracheal length is difficult to accurately compare between studies due to inconsistencies in the definition of the beginning and end points of the trachea. The main bifurcation angle is observed to have one of the largest standard deviations (SD). Of the 21 scans, five were from adult men and five were from adult women, while the other 11 scans were from the ELCAP database, which does not provide gender information. Additional information on patient characteristics was not available for the complete dataset.
Table 2.
Summary of morphological data reported in the literature for cast-based, patient specific, and simplified models. Patient specific data includes 11 scans from ELCAP Public Lung Database, two from previously published studies, and eight scans from those collected for this study. Mean values of length and diameter are reported in mm while the branching angle is reported in degrees. Mean values are reported along with ± one SD.
| Data | Trachea | RMB | LMB | Main Bifurcation Angle | ||||
|---|---|---|---|---|---|---|---|---|
| Sets | L | Davg | L | Davg | L | Davg | ||
| Cast | 7 | 106.4 ± 20.4 | 19.7 ± 2.2 | 29.5 ± 6.4 | 15.7 ± 2.4 | 57.0 ± 5.9 | 13.1 ± 0.9 | 55.0 ± 10.0 |
| Patient Specific | 21 | NA | 17.5 ± 2.1 | 25.2 ± 5.7 | 14.4 ± 1.8 | 53.8 ± 4.9 | 11.8 ± 1.9 | 73.1 ± 18.5 |
| Simplified | 2 | 112.5 ± 7.3 | 16.9 ± 1.1 | NA | NA | NA | NA | NA |
In comparison with the patient-specific measurements of Table 2, the Model D measurements (Table 1) are all within one standard deviation, except for tracheal length (for which patient-specific data was not available due to the starting location of the scan). It is noted that the length of the LMB in Model D is reported from the interior intersection of centerlines in the first bifurcation to the second bifurcation, as this is considered the more anatomically correct measurement. However, the surface measurement of the LMB length is 59.9 mm, which is just outside of the SD tolerance. Considering the difficulty in obtaining a single scan that fits within all parameters, the match between the Model D measurements and the patient-specific data is very good. The Model D data is also within the SD tolerances of the cast data, except for the tracheal length and the average LMB diameter. In contrast, Model C is well outside of the SD tolerances for the RMB and LMB lengths from the patient-specific measurements as well as the tracheal length. Considering cast measurements, Model D is only outside the standard deviation of the LMB length and tracheal length. Overall, Model D is a better fit with the compiled anatomical TB data compared with Model C and appears to reasonably represent mean airway dimensions for an adult male.
Both upper TB geometries were connected to the previously developed elliptical MT model proposed by Xi and Longest [16]. This model was based on successive simplifications of a realistic geometry from cast and scan data to produce an idealized representation without modifying the deposition characteristics. As indicated in the Sec. 1, Xi and Longest [16] found that a noncircular glottic aperture, as included in the elliptical model, was important to correctly capture the laryngeal jet entering the trachea. Xi et al. [17] previously highlighted the importance of the laryngeal jet on deposition in the upper TB airways. The MT and tracheal models were smoothly connected through a transition region, with lengths from the glottic aperture to the main carina of 137 mm for Model C and 131 mm for Model D, which are consistent with the measurements of Griscom and Wohl [53]. For Model C, there is a transition region below the glottis where the coronal angle is at approximately 22 deg, which then meets with the remainder of the trachea. This lower section of the trachea is vertical (coronal angle of zero), which is not anatomically correct for a typical standing position. The trachea of Model D is connected to the MT model in a more realistic way. As it is known that the trachea follows the upper thoracic region of the spinal column, the coronal angle of the trachea in Model D is set to match the upper thoracic angle of the spine in the selected CT scan. The coronal angle of the upper thoracic spine (T1–T3) in the selected CT scan (30.6 deg) was found to be consistent with the measurements of Kuo et al. [58], who recorded the mean upper thoracic angle for a standing male to be 30.1 deg. Moreover, the measured angle gives confidence that Model D may be used to approximate the upper airway geometry in a standing subject, which is most relevant to the evaluation of inhaler use in ambulatory patients.
2.2. Inhalers.
The commonly prescribed Flovent HFA MDI and Flovent Diskus DPI (both from GlaxoSmithKline, Raleigh, NC) were selected as representative spray and powder devices. Both inhalers delivered fluticasone propionate at a dose of 250 μg. The Flovent MDI is a suspension formulation and has a metered dose of 250 μg and an emitted dose of 220 μg, indicating an approximate 12% drug loss in the device. Micronized fluticasone propionate, which is nonhygroscopic, is suspended in HFA 134a with no other excipients and has a total metered mass of 75 mg per actuation. The Diskus DPI delivers 250 μg as a single dose of micronized fluticasone propionate in a powder blend with 12.5 mg of lactose.
Flow pathways from the site of aerosol formation to the MT geometry were included for both inhalers (Fig. 1). For the MDI, the CFD model included the actuator with airflow around the canister, the internal 0.5 mm spray nozzle that forms the aerosol, and the mouthpiece. For the DPI, the numerical model consisted of the mouthpiece containing a 5 mm orifice through which air and the aerosolized powder enter the MT geometry. Both inhalers were smoothly connected to the MT geometry with further details provided in the study of Longest et al. [49].
2.3. Inlet and Flow Field Conditions.
Based on airflow resistances and typical patient instructions for both devices, characteristic inhalation profiles were previously described and reported in Longest et al. [49]. The associated mean inhalation flow rates for the MDI and DPI were 37 and 75 LPM, respectively. Different flow field conditions were considered for validating the CFD predictions and comparing the model geometries in Sec. 3. For validating the CFD predictions, the inlet flows were selected to match the in vitro experimental conditions as closely as possible. Considering the MDI validation, a steady state flow of 37 LPM was passed through the system and allowed to fully develop. The MDI was then actuated into this flow stream for a spray period of 0.2 s, creating a highly transient simulation. During the MDI actuation period, both HFA 134a vapor and particles entered the flow field through the 0.5 mm nozzle. For the DPI validation simulations, a square waveform with a maximum value of 75 LPM was implemented to approximate the in vitro conditions. However, in the experiments, a true square-wave cannot be achieved as there is some ramp-up time to the maximum velocity. In this study, the ramp-up time was assumed to be the first 0.05 s of flow. DPI particles were injected as a bolus into the transient square wave in the middle of the ramp-up time period. Other studies have suggested ramp-up times of 0.1 s and even higher [59]. However, sensitivity to the ramp-up time employed is not considered to be large.
It is known that transient inhalation profiles affect pharmaceutical aerosol deposition in the upper airways [48]. However, significant computational savings can be gained by considering steady state approximations of the flow field. The main objective of this study was to compare the aerosol transport and deposition behavior in Model C versus Model D for multiple inhaler platforms. To provide a numerically efficient solution, steady state inlet airflow conditions were implemented for comparisons of Models C and D in the results. The simulations of the DPI are then steady state and the MDI simulations remain transient due to the time-dependent actuation of the spray.
For the MDI, initial conditions of the spray were established by assuming isentropic flow through the 0.5 mm nozzle. The formulation exiting the nozzle was assumed to be at the HFA 134a boiling point for atmospheric pressure and traveling at sonic velocity (i.e., choked flow conditions). Conservation of mass was used to estimate an approximate density of the slurry exiting the nozzle. As mentioned above, the particles in the DPI were injected as a single burst for the polydisperse validation, which is released after 0.025 s (the middle of the ramp). Further details of the inlet conditions for both the MDI and DPI are reported in the study of Longest et al. [49].
Options for upper TB model outlet conditions in the CFD simulations are either specified (often constant) pressure or a defined outlet mass–flow distribution. With in vitro experiments, the TB geometry is housed in a chamber and a constant negative pressure is applied to drive the flow [20]. A constant outlet pressure is used in the model to simulate this condition for comparisons to in vitro deposition results. Previous studies on ventilation distribution to different lung lobes have predicted typical mass fraction distributions based on analytical models [60] and imaging techniques [61]. Reasonable consistency among these studies led to the following distribution estimates for each of the five lung lobes: right upper 14%, right middle 7%, right lower 33%, left upper 15%, and left lower 31%. The resulting right and left ventilation proportions were 54 and 46%, respectively. In this study, a constant outlet pressure was used in the validation studies to be consistent with the in vitro experiments, whereas the prescribed mass flow distribution presented above was used for the remaining simulations that compared Model C to Model D performance. For branches extending beyond the five lobar bronchi, symmetric outflow conditions were assumed for each bifurcation.
Based on separate simulation conditions for the validation and comparison studies, four simulation cases are considered, which are summarized in Table 3. It is important to point out that with the MDI solution, steady inhalation was employed; however, transient firing of the inhaler resulted in a transient flow field solution. The effect of the MDI jet on the flow field occurs due to the release of the HFA 134a vapor during inhaler activation, which enters the flow field at sonic velocity conditions, as described above and in previous publications [49]. In the transient solutions, the simulations were continued until a majority (99%) of the particles exited the flow field, which occurred within a standard inhalation time period of 2 s or less.
Table 3.
Summary of CFD simulation conditions
| Simulation | Conditions before particle injection | Particle injection conditions | Flow field time treatment | Outlet boundary conditions |
|---|---|---|---|---|
| 1. MDI Validation | Steady airflow at 37 LPM | Spray period of 0.2 s with HFA 134a vapor and polydisperse particles entering the flow field | Transient solution | Constant pressure (flow proportional to outlet diameter) |
| 2. DPI Validation | Zero velocity and pressure fields | Airflow introduced as a square-wave at 75 LPM with a ramp-up time of 0.05 s | Transient solution | Constant pressure (flow proportional to outlet diameter) |
| Polydisperse particles injected as a bolus at 0.025 s | ||||
| 3. MDI Comparison Study | Steady airflow at 37 LPM | Spray period of 0.2 s with HFA 134a vapor and polydisperse particles entering the flow field | Transient solution | Predetermined mass flow condition at each lung lobe |
| 4. DPI Comparison Study | Steady airflow at 75 LPM | Polydisperse particles evaluated in steady state flow field | Steady state solution | Predetermined mass flow condition at each lung lobe |
2.4. Inlet Particle Size Distribution.
Size distributions of the initial DPI aerosol and fully dried MDI aerosol were previously reported by Longest et al. [49] based on measurements with a Next Generation Impactor (NGI). At a sampling flow rate of 30 L/min, the MDI aerosol had a mass median aerodynamic diameter (MMAD) of 2.64 μm with a SD of 0.1 and a geometric standard deviation (GSD) of 1.51. The drug mass distribution from the DPI was composed of approximately 70% particles greater than 10 μm and 30% smaller particles. The smaller size fraction represents deaggregated drug particles that separated from the larger lactose carrier, whereas the larger fraction represents drug particles still attached to lactose and drug particle agglomerates. With a flow rate of 75 L/min, the MMAD (SD) of the DPI aerosol less than 10 μm based on drug mass was 2.99 μm (0.2) with a GSD of 2.09. The MMADs reported for both the MDI and DPI exclude the drug mass depositing in the preseparator, which is standard convention for reporting pharmaceutical aerosol size. However, the full polydisperse aerosol distribution including the preseparator component was included in the simulations.
For the polydisperse validation of the DPI, the particle distribution was adjusted to take into account the predicted drug mass that deposited in the NGI preseparator. Previous simulations have assumed that only large particles (>12 μm) deposit in the preseparator, leaving the smaller particles free to pass through. However, some fraction of smaller particles is also lost in the preseparator due to turbulence. To determine the fraction of smaller particles lost in the preseparator and correct the inlet particle distribution leaving the inhaler and entering the MT, separate CFD simulations of the NGI preseparator were conducted. The particle injection at the inlet of the preseparator was modeled as an initial burst of 90,000 particles that was released and then tracked over 4 s of continuous flow at 75 L/min, consistent with the experiments. The correction factor used for adjusting the particle distribution was calculated as
| (1) |
where FR is fraction remaining of particle mass at the outlet, and DF< 12μm is the deposition fraction (DF) of particles smaller than 12 μm. This correction factor was then multiplied by the drug mass percentage of each particle size, and mass percentages were then normalized. The FR found for this case was 11.1% and the DF< 12 μm was 16.7%, so the distribution was altered significantly. The new distribution consisted of 51% particles greater than 10 μm and 49% smaller particles with an adjusted MMAD of 3.00 μm.
In the simulations, one-way coupling was assumed where the discrete phase does not influence the mass, momentum, or energy of the continuous phase. With Lagrangian particle tracking, it is not numerically feasible to simulate all particles in the fully delivered dose. Instead, representative groups of particles were considered to simulate size bins of the polydisperse aerosol. Size bins were based on the midpoint diameters of the NGI stages used to measure the aerosol distribution. Within each size bin, 10,000 particles were simulated for the DPI and 8000 for the MDI. Deposition of the representative particles provided the number fraction of each size bin depositing in the model. Mass of drug deposition was calculated based on the number fraction of deposited particles in each size bin and the initial mass distribution of the aerosol measured in the experiments. Increasing the number of particles per size bin by a factor of 2 had a negligible effect on predicted drug mass deposition fractions. Deposition enhancement factor predictions were based on monodisperse simulations using the MMAD of each inhaler aerosol.
2.5. CFD Simulations.
The flow fields generated by the two inhalers considered differ substantially and require separate solution approaches. For the MDI, the flow field is transient, temperature-dependent, compressible, turbulent, and contains multiple species (air and propellant vapor, HFA134a). In comparison, the flow field of the DPI is assumed to be at steady state, isothermal, incompressible, and turbulent for the comparisons made in this study. Hygroscopic growth of the DPI aerosol was not simulated, so water vapor is not included and only air is modeled as the gas phase. CFD models of spray inhalers (like the MDI) and dry powder devices have been presented in our previous studies [47–49,62]. A brief summary of the modeling approach used in the current study is presented here.
Based on its effectiveness, the low Reynolds number (LRN) k–ω turbulence model was used to simulate transitional and turbulent flow associated with both inhalers. This model has previously been well tested, and found to provide good estimates of aerosol transport and deposition in upper airway geometries [17,63]. In addition to monodisperse particle deposition studies, the LRN k–ω approach has also been shown to provide good estimates of transport and deposition for pharmaceutical aerosols generated with a DPI [48] and spray devices including a MDI and softmist inhalers [6,62,64]. To evaluate the variable temperature and species concentration fields for the MDI, interconnected relations governing the transport of heat and mass (HFA 134a) were also included. These governing equations were previously presented in detail by Longest and Xi [65] and Longest et al. [62].
A Lagrangian particle tracking model was employed to determine the trajectories of individual particles, turbulent dispersion, and deposition. This model was implemented using a previously developed combination of a commercial code (Fluent 12, ANSYS, Inc.) and user functions. User routines were employed to better model near-wall conditions and to simulate aerosol deposition in the complex three-dimensional multiscale flow field. Previous studies have shown that the isotropic turbulence approximation, which is assumed with the LRN k–ω model, can over predict aerosol deposition [12]. As a result, a user routine was employed to account for anisotropic near-wall turbulence, as previously described by Longest et al. [62]. Other additions to the particle tracking model included (i) a correction to better predict the Brownian motion of submicrometer aerosols and (ii) improved near-wall interpolation of fluid velocities [66].
Considering heat and mass exchange between the particles and air, the DPI aerosol was considered stable due to the nonhygroscopic nature of fluticasone propionate. In contrast, MDI droplets composed of liquid HFA 134a and suspended drug particles are known to rapidly evaporate [67]. Knowledge of the droplet size distribution near the spray nozzle is very difficult to obtain due to rapid change and small time scales. It is expected that the aerosol size distribution measured at the NGI is for dry particles containing only fluticasone propionate. As a method to predict MDI deposition without accurate knowledge of the initial droplet diameters, the final dried particle size distribution was assumed to exit the MDI nozzle in the CFD simulations. The particles were then modeled without considering size change. The adequacy of this assumption was demonstrated by comparing numerical predictions with experimental deposition results in the previous study of Longest et al. [49].
2.6. Mesh Development.
The computational mesh for each model was created with Gambit 2.4 (ANSYS, Inc.), using primarily hexahedral cells, which are expected to produce more accurate results than a mesh consisting of tetrahedral elements [50,51]. The mesh density in each model was greater in the MT region than the TB region due to the presence of inlet jets from each inhaler that require a finer mesh to properly resolve. Additionally, a structured hexahedral mesh with a butterfly blocking pattern was used in the MT region of the MDI models due to the presence of compressible supersonic flow [50]. Elsewhere, an unstructured hexahedral mesh with a cross blocking pattern was deemed adequate for resolving the flow in the MT region of the DPI models and in the TB regions of all models. Due to the use of different blocking patterns in the MDI models and variable mesh densities in all models, the MT and TB regions were impossible to join using hexahedral blocks. For the DPI model, this issue was resolved by using an interpolation feature of the CFD software, with only a small discontinuity in velocity visible in the solution. However, the transient compressible MDI simulations showed a large discontinuity when using this feature, so a small region of tetrahedral cells was used to join the MT and TB regions, consisting of ∼4% of the total number of elements.
Grid convergence was previously established for the DPI and MDI Model C geometries for meshes with 1.4 × 10⁶ and 1.8 × 10⁶ elements, respectively [49]. Considering the similarities in the Model C and D geometries, approximately similar numbers of control volumes (CV) were implemented. In this study, the MDI mesh was adjusted to provide similar distances to the first near-wall CV height consistent with the DPI mesh. The resulting MDI mesh consisted of approximately 1 × 10⁶ cells. Reduction of the MDI grid resolution also allowed for the compressible, transient, multispecies solution to run in a more efficient manner with only a small increase in grid resolution error. For both DPI models, a mesh of ∼1.4 × 10⁶ elements was used. The average distances and range of distances to the first near-wall control volume height are summarized in Table 4 for both models and inhalers.
Table 4.
Mean height of the first wall adjacent control volume in the MT and TB regions of Model C and Model D, for the MDI and DPI meshes. Also included in parentheses are the ranges of control volume height values in each region.
|
MDI |
DPI |
|||
|---|---|---|---|---|
| MT | TB | MT | TB | |
| Model C | 0.147 | 0.101 | 0.126 | 0.101 |
| (0.0467–0.271) | (0.0673–0.188) | (0.0515–0.358) | (0.0673–0.188) | |
| Model D | 0.140 | 0.096 | 0.142 | 0.096 |
| (0.0467–0.242) | (0.0376–0.229) | (0.0534–0.36) | (0.0376–0.229) | |
The y+ values of the meshes were considered to assess the applicability of the k–ω turbulence model. The nondimensional variable y+ provides an estimate of the which turbulence zone (laminar sublayer, transition, fully turbulent) a near wall node is within, and is calculated with the equation
| (2) |
where τw is the shear stress at the wall, y is the distance from the node to the wall, ρ is the local density, and υ is the local kinematic viscosity. Since the y+ values depend on shear, density, and kinematic viscosity, they are solution dependent and must be checked after running the simulations. Theoretically, ideal y+ values for use with the k–ω model are greater than 30, or less than 5 (with the Low Reynolds number feature that has been utilized in this study), though y+ values between 5 and 11.2 are considered accurate as well.
The simulations used for this study were checked for their y+ values, and it was found that while most of the of the y+ values (>90%) in each simulation were within the acceptable ranges, there were a few localized areas of y+ values between 11.2 and 17. Finer hexahedral meshes of the MDI and DPI versions of Model C, each consisting of ∼1.8 × 10⁶ cells, were used to compare depositional changes associated with y+ values. Tetrahedral meshes were not considered as the near wall height of cells were virtually identical in those simulations, while Model D was not considered because the y+ values for both models were similar with both the MDI and DPI. It was found that change in total DF was small (<7% relative difference for the MDI, < 2% relative difference for the DPI), and that the finer mesh did not provide a consistent improvement in deposition predictions compared with the in vitro results. Therefore, it was determined that the original meshes (consisting of 1 × 10⁶ and 1.4 × 10⁶ cells, respectively) offered enough accuracy to provide a meaningful comparison of Model C and Model D.
As an additional component of this study, the effect of mesh style on solution performance was also considered. Based on previous studies, hexahedral elements are expected to provide the most accurate solution for biofluid-type simulations [51]. However, hexahedral meshes cannot always be generated for complex bifurcating airway geometries. In this study, CFD solutions in Models C and D were also conducted using a similar tetrahedral mesh. The primary condition on the tetrahedral mesh size was an equal height of the first near-wall control volume compared with the hexahedral mesh. For the MDI and DPI geometries, the resulting tetrahedral meshes contained 4.0 × 10⁶ and 3.3 × 10⁶ cells, respectively. As with the hexahedral meshes, a spatial grading was applied to the tetrahedral meshes such that smaller elements were used in the near-wall locations to better resolve regions of high velocity gradients. Tetrahedral cell counts were similar for Models C and D. These tetrahedral meshes were considered to be the largest computational meshes that could be evaluated in a practical amount of time on a current single computational workstation.
2.7. Deposition Factors.
Deposition within regions of the respiratory tract can be reported as either a fraction or efficiency. The DF for the ith region based on drug mass is calculated as
| (3) |
The corresponding deposition efficiency (DE) for region i is calculated as
| (4) |
To determine a total deposition fraction, DFi values in individual regions (e.g., MT and TB) can be directly summed. The use of deposition efficiency is an effective method to report the deposition characteristics of an individual section of the respiratory tract without the influence of upstream aerosol losses. In addition, the fraction remaining, FRi, represents the fraction of aerosol remaining at the inlet of the i region (e.g., inlet to a lung lobe).
Localized deposition can be presented in terms of a deposition enhancement factor (DEF), which quantifies local deposition as a fraction of the total or regional deposition efficiency. A DEF, similar to the enhancement factor suggested by Balashazy et al. [68], for local region j can be defined as
| (5) |
where the summation is performed over the region of interest, i.e., the upper airway model. In this study, the local area Aj is assumed to be a region with a diameter of 1600 μm and 2500 μm for DPI and MDI simulations, respectively, or approximately 160–250 lung epithelial cells in length.
2.8. Calculation of Deposition Efficiency for Monodisperse Particle Predictions.
The monodisperse deposition of particles ranging from 0.93–30 μm at an inhalation flow rate of 30 L/min was predicted for both Model C and Model D and compared with the empirical formulations of Zhou and Cheng [69] based on in vitro experiments of polystyrene latex particles. In this study, the geometric regions of the upper TB airways are defined in Model C based on the PRB units and in Model D based on similar bifurcation definitions. Monodisperse numerical predictions of DE were compared with the empirical results of Zhou and Cheng [69]. The general empirical formulation used by Zhou and Cheng [69] is
| (6) |
where Stk is the Stokes number and a and b are empirical constants. Stokes number is defined in Zhou and Cheng [69] as
| (7) |
where d is the particle aerodynamic diameter, V is the average velocity, μ is the dynamic viscosity, and R0 is the average radius of the parent branch in the region of interest. The empirical constants differ according to the airway of interest; for the trachea, they are constants (a is 6.4 and b is 1.19), but for bifurcations B1–B3, the constant a is a function of branching angle and the daughter to parent branch radius ratio.
For the numerical simulations, an open mouth inlet (2 cm wide) was employed with a blunt particle inlet profile. Calculation of the monodisperse DE for each airway is found by dividing the number of depositing particles in each section by the number of entering particles.
3. Results
3.1. Comparisons of CFD Predictions and in vitro Data for Monodisperse Particles.
The DE in the trachea, first, second, and third bifurcations for Models C and D are shown in Figs. 2 and 3, respectively. The airway regions of interest are clearly illustrated in Figs. 2 and 3 for both models. The Model C trachea and first bifurcation data provide a close fit to the Zhou and Cheng [69] data, particularly for particles smaller than 10 μm (Fig. 2). The DE for the second and third bifurcations shows a similar trend as the empirical data, though it is consistently underpredicted, which appears to be explained by the significantly wider airways (∼40–50% increase in diameter) in Model C versus the patient-specific cast model used by Zhou and Cheng [69] (Fig. 2). Comparing the boundaries illustrated in Fig. 2 with the boundaries implemented by Zhou and Cheng [69] also reveals some discrepancies, which are partially responsible for differences between the predictions and experimental results.
Fig. 2.
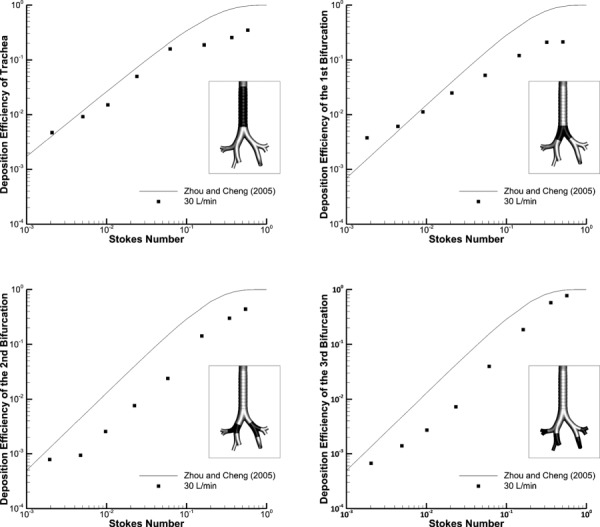
Deposition efficiency (DE) of monodisperse aerosols in Model C using the Zhou and Cheng [69] empirical formulations compared to CFD predictions at 30 L/min within different regions of the upper TB airways. The regions of interest are highlighted for each case.
Fig. 3.
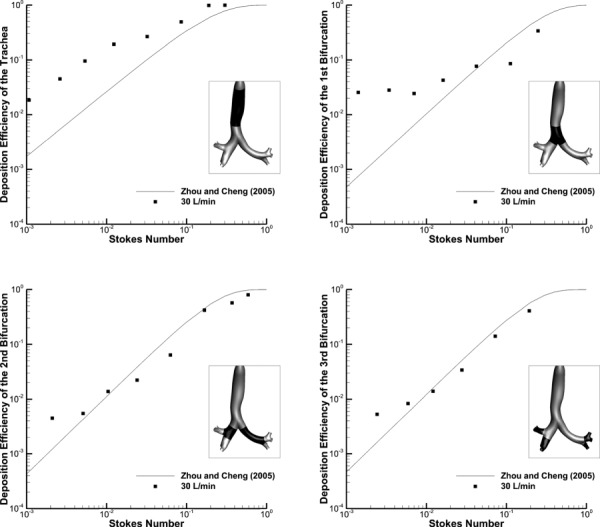
Deposition efficiency (DE) of monodisperse aerosols in Model D using Zhou and Cheng [69] empirical formulations compared to CFD predictions at 30 L/min within different regions of the upper TB airways. The regions of interest are highlighted for each case.
Considering Model D, DE in the trachea is overpredicted, which is most likely due to the curvature of the trachea around the aorta that is absent in the Zhou and Cheng [69] model. The Zhou and Cheng [69] model was based on a cast, which is known to expand and may have removed the tracheal curvature around the aorta. The differences in the first generation bifurcation DE may be explained by a different definition of what physically constitutes this bifurcation. For the Zhou and Cheng [69] study, it begins at the point where the centerlines of the daughter branches meet and extends until the airways bifurcate again. However, the first bifurcation for Model D, as defined for the comparison with the Zhou and Cheng [69] model, begins at a higher location that is consistent with the PRB units employed in Model C so that the tracheal lengths of both the Zhou and Cheng [69] model and Model D would be equivalent. In addition, the first bifurcation in the Zhou and Cheng [69] model extends further than in Model D. The DE for the second and third generations is remarkably similar, despite the relatively larger size of the Model D airways, and differences in the bifurcation definition region. In contrast with Model C, agreement between the Model D and Zhou and Cheng [69] data in the second and third bifurcations implies that including irregular cross-sections and bronchi curvature in this region is important.
In summary of the monodisperse comparisons, large differences are observed between the results of Model C versus D and between the computational predictions and experimental results of Zhou and Cheng [69] on a regional basis. It is noted that the Zhou and Cheng [69] geometry is different from the airway model considered here and some differences in regional definitions exist. Higher deposition in the trachea of Model D highlights the importance of tracheal curvature, the laryngeal jet, and potential differences between the experimental and CFD model. Good agreement between Model D predictions and the experimental data in the second and third bifurcations indicates the importance of including realistic irregular bronchi cross-sections and curvature in this region. The additional geometric features included in Model D appear to have a significant impact on the regional deposition of monodisperse aerosols.
3.2. Validation of Simulations with in Vitro Data for Pharmaceutical Aerosols.
The regional DFs of polydisperse particles were predicted for Model C using CFD and compared with previous in vitro results for an MDI inhaler and a DPI inhaler in the exact same geometry. A full description of the experimental setup and methods are provided in previous publications for both the MDI [49] and DPI [48]. For the MDI, the total DF (experimental 50.3% versus CFD 48.7%) provided a good match, though some regional differences were found (Fig. 4). The results for the MDI inhaler show a close match in the MT region (4% relative difference), while the mouthpiece (MP) and TB regions are not as close (42% relative difference in the MP region; 233% in the TB region) (Fig. 4(a)). The differences in these regions may be explained by the omission of evaporation and two-way coupling effects in the model, both of which would greatly increase the computational time required. An evaporating aerosol would increase deposition in the inhaler and decrease deposition in the TB region. However, considering the focus of the study is to provide a comparison between Model C and Model D, the predictions were deemed adequately close to the experimental results. For comparison with previous in vivo results, MT deposition was not found in the literature for the Flovent HFA MDI. However, a similar MDI using HFA 134a as the propellant was reported to produce 29 ± 18% deposition in the MT in vivo, which is similar to the results shown in Fig. 4(a) [70]. It is noted that the aerosol considered in the in vivo study is known to have a smaller MMAD than the Flovent HFA MDI, which is likely responsible for the lower deposition.
Fig. 4.
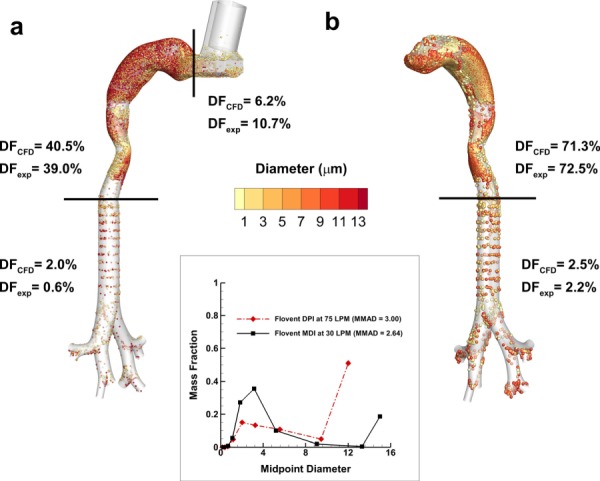
CFD predictions of deposition fraction (DF) for polydisperse pharmaceutical aerosols in Model C with both the (a) DPI and (b) MDI as compared with existing experimental data in the same geometry. The experimentally determined polydisperse particle profiles for both the DPI and MDI are shown as figure inserts. The DPI profile was corrected for deposition in the preseparator based on additional CFD simulations.
For the case of the DPI aerosol, the CFD predictions do an excellent job of matching the in vitro experiments on a total and regional basis (Fig. 4(b)). Specifically, the relative differences between the experiments and model for total deposition, MT deposition, and upper TB deposition are 1%, 2%, and 14%, respectively. This good agreement is impressive considering the complexity of the system, which includes a polydisperse pharmaceutical aerosol, a high velocity turbulent jet into the MT, turbulent to laminar transition, multiple system outlets, and multiple aerosol deposition mechanisms. As with the MDI, in vivo deposition data for the Diskus inhaler could not be found in the literature. However, approximately 70% MT deposition is consistent with most commercial DPIs [20,21,71,72].
3.3. Flow Fields.
Flow velocity fields for both Model C and Model D are shown in Figs. 5 and 6, for the MDI and DPI solutions, respectively. Sagittal velocity contours with midplane vector fields are displayed for all cases, along with selected axial cross-sectional contours and inplane streamlines. As described for model comparisons, the inlet flow condition for the MDI is steady state at 37 LPM with a transient 0.2 s spray producing a time-dependent solution. The MDI results shown in Fig. 5 are for 0.1 s after spray actuation. For the DPI and model comparisons (Fig. 6), the inlet flow is constant in time at 75 LPM producing a steady state solution. Contours, vector fields, and streamlines in the MDI (Fig. 5) and DPI (Fig. 6) cases are somewhat similar for both models, except for the increase in magnitude that comes from a higher flow rate (75 LPM) with the DPI as opposed to the MDI (37 LPM).
Fig. 5.
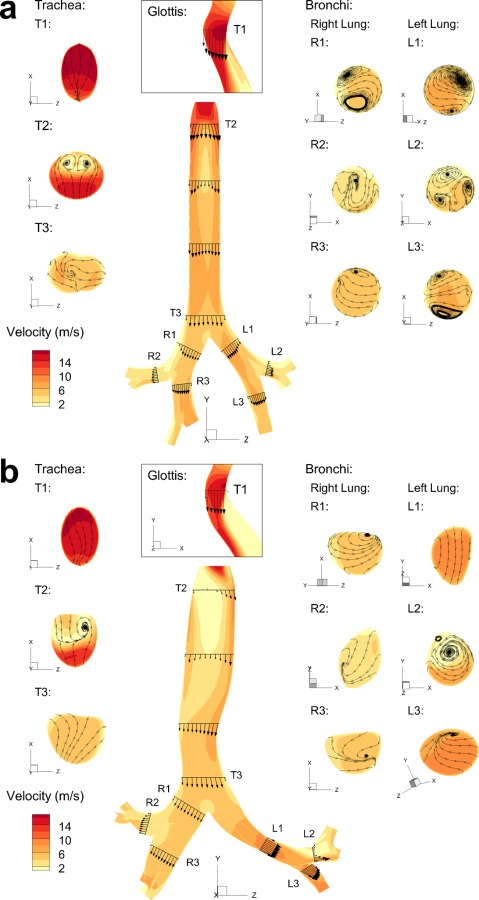
Sagittal plane velocity contours with midplane vector fields, along with selected axial cross-sectional contours and streamlines, in (a) Model C and (b) Model D for the MDI
Fig. 6.
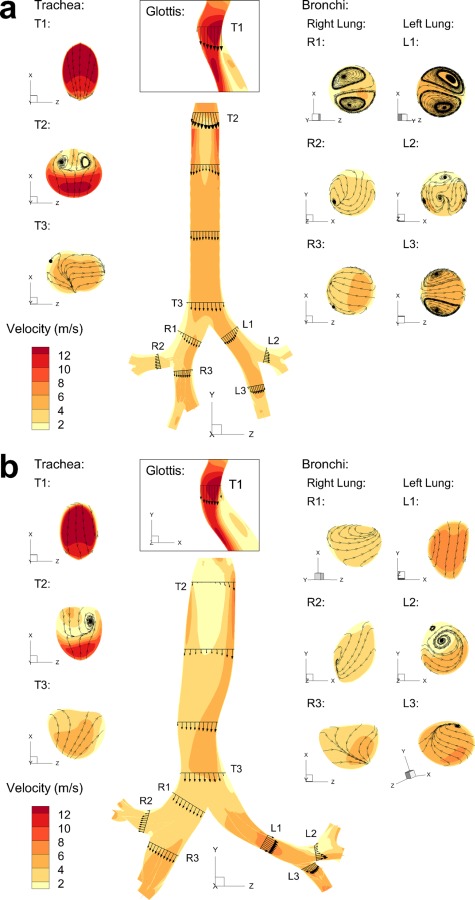
Sagittal plane velocity contours with midplane vector fields, along with selected axial cross-sectional contours and streamlines, in (a) Model C and (b) Model D for the DPI
One major difference between the flow fields of both models is that the laryngeal jet of Model C is symmetric whereas the jet of Model D is skewed to the anatomical left side of the trachea. This phenomena is observed with Model D for both inhalers and is enhanced with the higher velocity field of the DPI (Fig. 6(b)) compared with the MDI (Fig. 5(b)). The occurrence of a skewed laryngeal jet was previously reported by Xi et al. [17] using a cast-based CFD representation of the upper airways and was postulated to enhance gas mixing (reducing the effect of anatomical dead space) and enhance upper airway particle filtration. In the current study, this asymmetrical laryngeal jet is observed to create some flow recirculation in the upper part of the trachea. The skewed laryngeal jet travels along the left side of the trachea and along the curvature created by the aorta. As the flow separates on the downstream side of the aortic curvature, the associated negative pressure helps to pull the flow into the left main bronchi. Although the average diameters of the bronchi in both Model C and Model D are similar, the velocity magnitude in the left bronchi of Model D is significantly larger than that of Model C, which again may be explained by the curvature caused by the presence of the aorta. It appears to direct the flow towards the left lung, whereas in Model C the flow strikes the carina almost directly. This shift in flow may create the vortices in the main bronchi of Model C that are absent in Model D. A combination of the skewed laryngeal jet, recirculating tracheal flow, and interaction of the laryngeal jet with the tracheal walls likely accounts for the significantly enhanced tracheal deposition of monodisperse aerosols for Model D compared with Model C observed in Fig. 3 versus Fig. 2.
3.4. Deposition of Drug Mass.
Predictions of DF along with FR and mass median aerodynamic diameter (MMAD) exiting B3 and entering each of the five lung lobes for both models are displayed in Fig. 7, including data for the MDI (Figs. 7(a) and 7(b)) and DPI (7(c) and 7(d)) simulations. The lung lobes are denoted right upper (RU), right middle (RM), right lower (RL), left upper (LU) and left lower (LL) in the figure. Total DFs including both the MT and upper TB components are similar between Models C and D for both the MDI (48.7% versus 47.2%) and DPI (91.7% versus 89.9%). However, this similarity is largely due to the MT geometries being almost identical between Models C and D coupled with the fact that most of the deposition occurs in the MT. Small differences in MT deposition between Models C and D are due to differences in the connecting region between the glottic aperture and upper trachea. Larger differences in deposition between Models C and D are observed in the TB portion of the models. For both inhalers, TB deposition for Model D is higher than with Model C. Specifically, Model D produces a 160% relative increase in deposition with the MDI and a 533% relative increase for the DPI compared with Model C. Reasons for this increased deposition include the skewed laryngeal jet, recirculation in the upper trachea, interaction of the jet with the curved tracheal walls, and increased velocity in the LMB. Fractions of aerosol remaining at the outlet of each lung lobe and exiting MMADs appear similar between Models C and D for both inhalers. One exception is the RM outlet, which has an FR in Model D that is two to three times larger than with Model C.
Fig. 7.
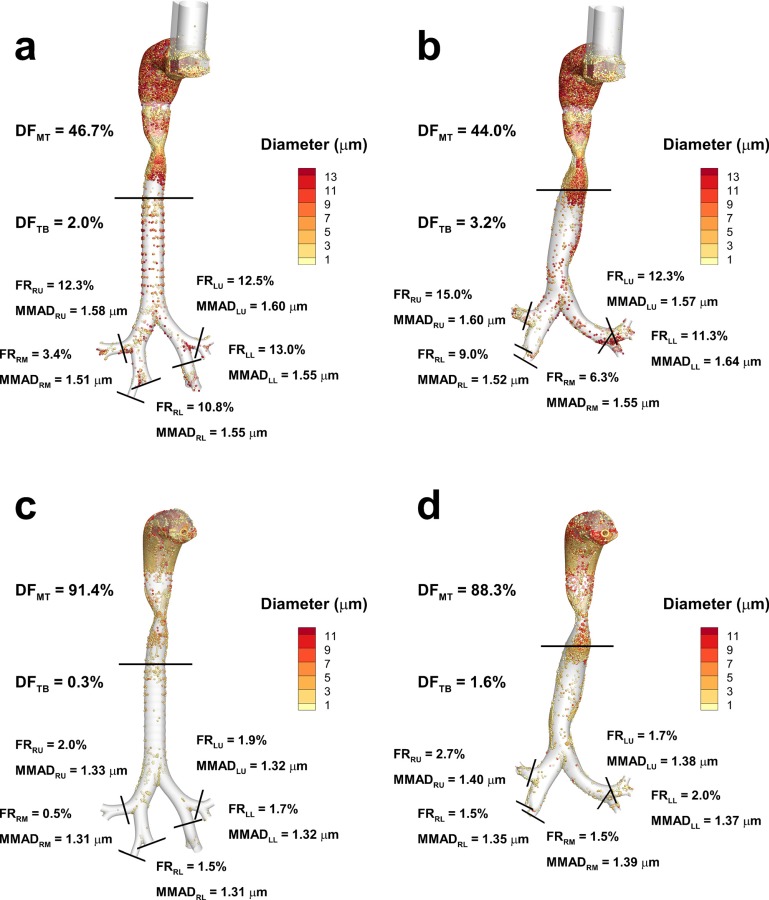
Deposition fraction (DF) in the mouth-throat (MT) and tracheobronchial (TB) airways for the MDI used in (a) Model C and (b) Model D, and for the DPI used in (c) Model C and (d) Model D. Also shown at the five lobar outlets are the fractions remaining (FR) and the mass median aerodynamic diameter (MMAD) of the remaining aerosol.
Differences in deposited drug mass between Model C and Model D are further highlighted in Fig. 8, which presents DFs in the trachea, first, second, and third bifurcations. For both inhalers, higher deposition is consistently observed for Model D in the trachea and the second and third bifurcations. These differences in deposition are increased with the higher flow rate of the DPI aerosol. As with the monodisperse aerosol, it appears that the skewed laryngeal jet, tracheal curvature, branch curvature, and more realistic cross-sectional profiles contribute to increased deposition in these three TB regions. The only departure from this trend is the higher deposition noted for Model C in the first bifurcation with the MDI. The leftward shift in the velocity field in the first bifurcation due to the skewed laryngeal jet and the tracheal curvature is likely responsible for the reduction of deposition (60% relative difference) in B1 of Model D, as the flow is channeled away from directly striking the carina, as it does in Model C.
Fig. 8.
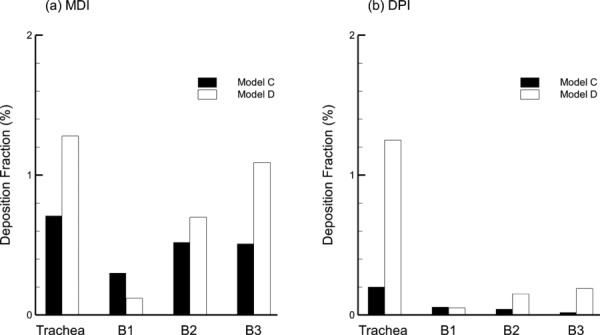
Regional deposition fraction (DF) in the TB airways through the third bifurcation (B3) for Model C and Model D with the (a) MDI and (b) DPI. Deposition in B2 and B3 represents the total DF among multiple bifurcations in the TB model.
Highly localized deposition in the airways can affect the dissolution of drug molecules, uptake, and airway irritation. The DEF parameter captures highly localized deposition as a proportion of the total surface-area-averaged deposition. DEF values are compared for Models C and D with both inhalers in Fig. 9. Maximum values of DEF are reported directly on the figure for the MT and upper TB regions. In general, DEF values are higher with Model D compared with Model C. One exception is the MT maximum of Model D with the DPI (Fig. 9(d)). This local value of deposition may be lower than the Model C case due to differences in total surface area of the geometries as well as different deposition patterns in the MT arising from differences in the downstream pressure profiles in the glottic region. The maximum DEF value less than 1 in the TB region of Model C with the DPI (Fig. 9(c)) is due to much higher DEF values in the MT region and evaluation of the entire MT and upper TB model together for calculating local deposition values.
Fig. 9.
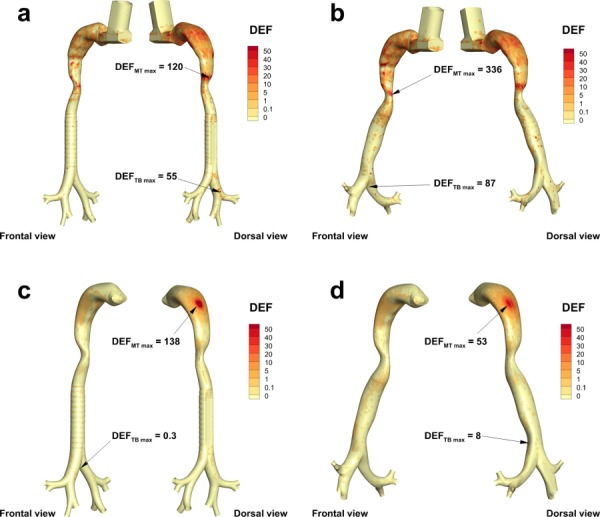
Deposition enhancement factor (DEF) for the MDI used in (a) Model C and (b) Model D, and the DPI used in (c) Model C and (d) Model D
3.5. Effects of Mesh Style on CFD Predictions.
Deposition characteristics in tetrahedral meshes of Model C and Model D are displayed in Fig. 10, with the results from the hexahedral meshes (shown in Fig. 7) under the same flow conditions for comparison. For both models with the MDI, the DF in the tetrahedral meshes is significantly underpredicted in the MP and the MT regions, but greatly overpredicted in the TB region as compared to the hexahedral results. Also shown with the MDI results of Model C (Fig. 10) are the in vitro experimental results previously shown in Fig. 4 of this study (originally from Longest et al. [49]). For Model C and the MDI, the tetrahedral DF predictions are 45% less in the MT region and 80% less in the MP region, while they are 680% greater in the TB region compared with the in vitro results. As a result, the predictions from the tetrahedral mesh are considered inadequate for the simulation of both models with the MDI. Also problematic is the increased computation time for the tetrahedral MDI simulations (Fig. 11) of both models, due to the increased number of cells required by the tetrahedral mesh to maintain the same distance to the first near-wall control volume and complexity of the MDI solution. Similarly for the DPI inhaler, simulations with a tetrahedral mesh underpredict MT deposition, overpredict TB deposition, and significantly increase solution time compared with the more accurate hexahedral approach (results not shown).
Fig. 10.
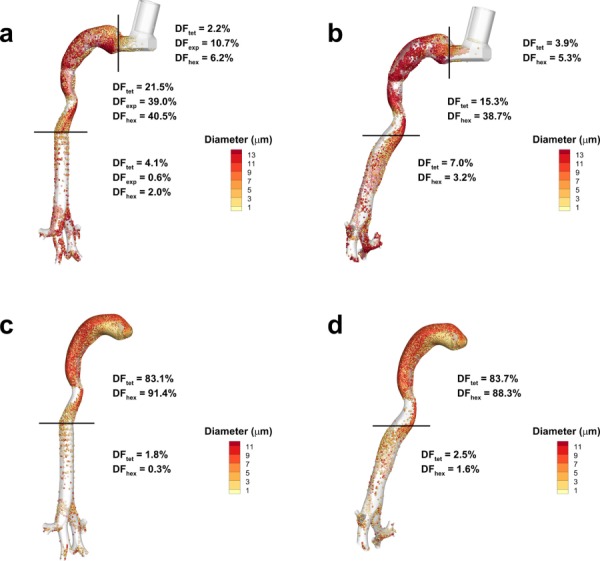
Deposition fraction (DF) in tetrahedral mesh as compared with hexahedral mesh results for the MDI used in (a) Model C and (b) Model D. Experimental values of DF are also included with Model C data based on identical inlet flow conditions.
Fig. 11.
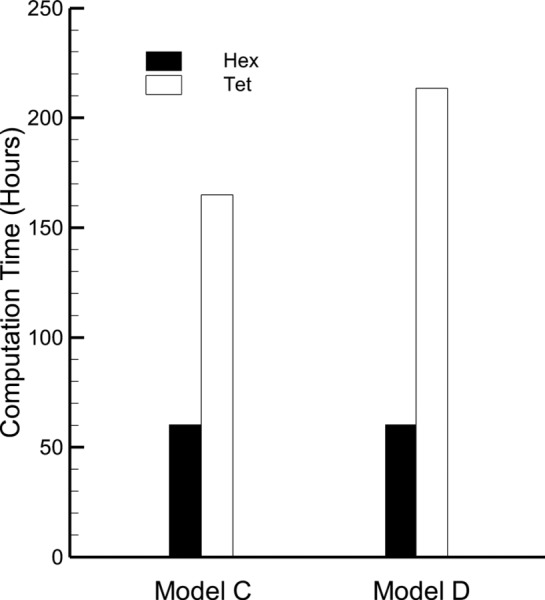
Computation time for tetrahedral and hexahedral meshes of Model C and Model D with the MDI
4. Discussion
A key feature of this study is the use of a CT scan to create a characteristic TB model that was verified through comparisons of the relevant dimensions of the model to average measurements reported in the literature and new measurements. The scan selected for use in the construction of the model, titled Model D, was shown to provide a good match to the average length and diameter measurements of the trachea and main bronchi obtained from an adult data set derived from 21 CT scans. As the scan selected for use was from an adult male, and because the measurements were within the range of average values, the model was considered to represent an average-sized adult male based on a limited dataset. For Model C, it was shown that while the diameters of the main bronchi fell within the range of average values, the lengths of the main bronchi were somewhat different. Model D was designed to include realistic characteristics that Model C lacked, including curvature in the asymmetrical trachea that accounts for the presence of the aorta, an accurate tracheal gravity angle, curvature in the main bronchi, and irregular cross-sections (as opposed to the circular cross-sections of the connecting branches in Model C).
Comparisons between monodisperse Model C and D results with the Zhou and Cheng [69] data provided very good agreement in some regions. However, observed differences in other areas are likely due to differences between the computational and experimental geometries as well as differences in regional definitions. Comparisons with the Zhou and Cheng [69] dataset for a single geometry are not intended to validate the selection of a characteristic model or the CFD predictions. Instead, these comparisons highlight variability associated with different geometries in predicting regional deposition as well as the effects of different regional definitions. A consistent method of defining and reporting deposition results within the upper TB airways appears to be needed.
CFD predictions of polydisperse deposition in Model C for both the MDI and DPI were first used to validate the model with existing in vitro data, and found to provide a good match using experimentally similar flow conditions, which provided confidence that the CFD methods employed produced a realistic approximation of the multiple deposition mechanisms for the polydisperse aerosol. Comparisons of Model C and D deposition results indicated that total deposition was similar, mainly due to the use of identical MT geometries. In contrast, both regional and highly localized deposition was consistently higher in the TB portion of Model D, except for the first bifurcation where a reduction was noted. The comparisons showed a leftward shift in particle deposition from Model C to Model D, apparently due to the inclusion of geometric features that produced a realistic skewed inlet laryngeal jet. This leftward shift in the TB deposition pattern was also reflected in the DEF values. These results suggest that both models may be considered characteristic for cases where only total DF is considered, but in cases where more specific information is required, Model D is preferable due to its inclusion of realistic features that are absent in Model C.
It appears that most of the realistic features included in Model D had an effect on the TB deposition. Both the asymmetric trachea and accurate tracheal angle related to gravity contributed to the laryngeal jet shifting sharply to the anatomical left side of the airway. This finding is similar to the CFD TB model of Xi et al. [17], who demonstrated instability in the laryngeal jet and a tendency to shift away from the tracheal center. In the current study, a combination of the laryngeal jet, recirculation in the trachea, and interaction of the tracheal flow with wall curvature caused by the aorta increased tracheal deposition compared with Model C. As a result, Model D tracheal deposition was much larger than observed with Model C for both inhalers, even in the absence of tracheal rings. The skewed tracheal flow, curvature of the bronchi, and irregular cross-sections of the connecting branches all influenced and increased deposition in Model D. This increase was observed for both monodisperse particles and polydisperse realistic pharmaceutical aerosols from inhalers. As a result of these observations, all of the new features included in Model D are considered necessary in a characteristic upper TB model for evaluating pharmaceutical aerosol delivery.
The leftward skew of deposition observed in Model D was also noted by Lambert et al. [31], who predicted polydisperse deposition at 20 L/min in a patient-specific geometry that extended to the seventh bifurcation and included tracheal curvature due to the presence of the aorta, an LMB that is significantly longer than the RMB, and pronounced curvature in the LMB. The left-to-right ratio of deposition was 1.01–1.60, depending on the particle size (2.5–30 μm), which was greater for larger particles. This leftward shift was observed in spite of greater ventilation to the right side (50.6% of the airflow went to the right). Although the ratio discussed in this study includes the sum of all particle size contributions, and in Lambert et al. [31] the data is presented on an individual particle size basis, both studies show a bias in deposition toward the anatomical left hand side. Moreover, this trend is noted in both studies in spite of greater ventilation to the right (54% to the right for this study). Although both Xi et al. [17] and this study observed a skewed laryngeal jet, Xi et al. [17] noted a laryngeal jet that was shifted to the right, as opposed to the leftward shift observed in Model D. The tracheal curvature of Model D causes the left side of the trachea to be closer to the center line of the glottis, which may induce the Coandă effect, a phenomenon whereby an unsteady jet is known to attach to the closest surface. The cast-based model of Xi et al. [17] lacks the tracheal curvature due to the presence of the aorta that is present in Model D, which results in a trachea that is closer to symmetric. In addition to the effect that tracheal curvature may have on the direction of the laryngeal jet, the greater right lung ventilation of Xi et al. [17] as compared to this study (60% versus 54%) may have contributed to the rightward bias in that model.
The type of mesh style selected is important for evaluating aerosols within the characteristic models. Previous studies demonstrated that hexahedral results are superior to tetrahedral solutions due to improved grid convergence, reduced numerical error, and faster solution times. However, a vast majority of studies on transport and deposition in the airways employ a tetrahedral mesh solution. The original motivation behind the Model C geometry was a mathematically reproducible model that could support a highly accurate hexahedral mesh, at the expense of some geometric realism. The current study illustrates the development of a hexahedral mesh starting with the inhaler and continuing through the third respiratory bifurcation. Comparisons of the hexahedral and tetrahedral solutions (with approximately three times more control volumes) demonstrated large differences in deposition predictions. As a result, both realistic geometric models and high quality hexahedral mesh solutions appear to be important for generating the best CFD predictions. Conversely, a highly realistic geometry that requires a tetrahedral mesh and does not sufficiently resolve the flow field may not improve the realism of the solution compared with in vitro and in vivo conditions.
One potential limitation of the current study is the simulation of constant flow rate inhalation compared with a more realistic transient inhalation profile. Previous studies with a DPI and the Model C geometry demonstrated that transient inhalation increased deposition in the MT and upper TB regions whereas deposition in the TB region beyond approximately B3 was unchanged compared with steady state conditions [48]. The study of Longest et al. [49] demonstrated that correct versus incorrect transient inhalation profiles with inhalers had little effect on MT deposition for both the MDI and DPI, but had a significant impact on deposition in the upper TB region. Regarding the findings of this study, transient inhalation will influence the overall deposition in the TB region. However, the relative differences observed between Model C and D arising from geometry changes are expected to remain the same with transient inhalation. Considering the skewed laryngeal jet, Xi et al. [17] documented a symmetric jet entering the trachea through approximately 10% of the inhalation time cycle, which then quickly attached to the tracheal side wall and remained skewed for the remainder of the inhalation breath cycle. As a result, the laryngeal jet pattern observed in this study is not expected to largely change with transient inhalation.
In addition to steady state inhalation, limitations of the study include the exclusion of cartilaginous rings, the size of the CT scan data set, and the lack of models from other gender and age demographics. The CT scan lacked sufficient resolution to include cartilaginous rings in Model D. It is known that cartilaginous rings of a certain size will increase tracheal deposition [25,26]. However, results of this study indicate an even larger increase in tracheal deposition associated with the skewed inlet jet, inclusion of tracheal curvature, and an accurate tracheal gravity angle. Although Model D has been shown to fit within average adult dimensions, it is obtained from an adult male and the trachea is in the upper range of average dimensions. Models of other age and gender demographics are desirable for the prediction of aerosol deposition among a larger segment of the population, and development of these models is left to future studies. Although the size of the scan data set (21 individuals) was deemed satisfactory for this study, a larger data set would provide even greater confidence that the dimensions of Model D are characteristic.
This study has produced an upper airway TB model (Model D) that includes a number of key anatomical and physiological characteristics, which were proven to influence deposition, and falls within the limits of average dimensions for an adult male. When compared with a previously existing model (Model C), the total deposition of realistic polydisperse pharmaceutical aerosols (MDI and DPI) was found to be similar, but the additional realistic features of Model D were found to significantly affect regional and local deposition with both the MDI and the DPI. This led to the conclusion that both models may be considered characteristic for predictions of total deposition of polydisperse aerosols, but Model D has clear advantages for evaluating regional and local deposition. The use of a hexahedral mesh versus a tetrahedral mesh was considered for both models with both inhalers, and it was found that a hexahedral mesh was preferable in all situations. Unfortunately, branch-averaged or bifurcation scale deposition results are not available from living subjects for test or pharmaceutical aerosols. Considering pharmaceutical aerosols, in vivo data is available that compares central lung to peripheral lung deposition, forming a C/P ratio [73]. Future studies will seek correlations between results with Model D and C/P ratios based on in vivo studies with pharmaceutical aerosols. Other recent studies have just begun to report highly localized deposition of test aerosols from nebulizers within the airways [74], which will serve as an additional source of in vivo model verification. Overall, Model D appears to be useful for studying the deposition of polydisperse aerosols in the upper TB airways of an adult male, and provides a template from which other characteristic upper TB airway models may be constructed.
Acknowledgment
This study was supported by Award U01 FD004570 from the US FDA and Award R01 HL107333 from the National Heart, Lung, and Blood Institute. The content is solely the responsibility of the authors and does not necessarily represent the official views of the US FDA, the National Heart, Lung, and Blood Institute or the National Institutes of Health.
Dr. Kelley Dodson and Dr. Joshua Yelverton of the VCU Department of Otolaryngology - Head and Neck Surgery are gratefully acknowledged for assistance with identifying the CT scans used in this study.
Footnotes
See http://www.rddonline.com (accessed Nov. 15, 2012).
See www.via.cornell.edu/databases/lungdb.html (accessed on Dec. 5, 2012).
Contributor Information
Ross L. Walenga, e-mail: walengarl@vcu.edu
Geng Tian, e-mail: tiang@mymail.vcu.edu; Department of Mechanical and , Nuclear Engineering, , Virginia Commonwealth University, , Richmond, VA 23284.
P. Worth Longest, Department of Mechanical and , Nuclear Engineering, , Virginia Commonwealth University, , Richmond, VA 23284; , Department of Pharmaceutics, , Virginia Commonwealth University, , Richmond, VA 23284 , e-mail: pwlongest@vcu.edu.
References
- [1]. Grgic, B. , Finlay, W. H. , and Heenan, A. F. , 2004, “Regional aerosol deposition and Flow Measurements in an Idealized Mouth and Throat,” J. Aerosol Sci., 35, pp. 21–32. 10.1016/S0021-8502(03)00387-2 [DOI] [Google Scholar]
- [2]. Zhang, Y. , Gilbertson, K. , and Finlay, W. H. , 2007, “In Vivo-In Vitro Comparison of Deposition in Three Mouth-Throat Models With Qvar and Turbuhaler Inhalers,” J. Aerosol Med., 20(3), pp. 227–235. 10.1089/jam.2007.0584 [DOI] [PubMed] [Google Scholar]
- [3]. Ilie, M. , Matida, E. A. , and Finlay, W. H. , 2008, “Asymmetrical Aerosol Deposition in an Idealized Mouth with a DPI Mouthpiece Inlet,” Aerosol Sci. Technol., 42, pp. 10–17. 10.1080/02786820701777440 [DOI] [Google Scholar]
- [4]. Kleinstreuer, C. , Shi, H. , and Zhang, Z. , 2007, “Computational Analyses of a Pressurized Metered Dose Inhaler and an New Drug-Aerosol Targeting Methodology,” J. Aerosol Med., 20(3), pp. 294–309. 10.1089/jam.2006.0617 [DOI] [PubMed] [Google Scholar]
- [5]. Zhang, Y. , Chia, T. L. , and Finlay, W. H. , 2006, “Experimental Measurement and Numerical Study of Particle Deposition in Highly Idealized Mouth-Throat Models,” Aerosol Sci. Technol., 40, pp. 361–372. 10.1080/02786820600615055 [DOI] [Google Scholar]
- [6]. Longest, P. W. , and Hindle, M. , 2009, “Evaluation of the Respimat Soft Mist Inhaler Using a Concurrent CFD and In Vitro Approach,” J. Aerosol Med. Pulm. Drug Deliv., 22(2), pp. 99–112. 10.1089/jamp.2008.0708 [DOI] [PubMed] [Google Scholar]
- [7]. Longest, P. W. , and Hindle, M. , 2009, “Quantitative Analysis and Design of a Spray Aerosol Inhaler. Part 1: Effects of Dilution Air Inlets and Flow Paths,” J. Aerosol Med. Pulm. Drug Deliv., 22(3), pp. 271–283. 10.1089/jamp.2008.0739 [DOI] [PubMed] [Google Scholar]
- [8]. Byron, P. R. , Hindle, M. , Lange, C. F. , Longest, P. W. , McRobbie, D. , Oldham, M. J. , Olsson, B. , Thiel, C. G. , Wachtel, H. , and Finlay, W. H. , 2010, “In Vivo-In Vitro Correlations: Predicting Pulmonary Drug Deposition From Pharmaceutical Aerosols,” J. Aerosol Med. Pulm. Drug Deliv., 23, pp. S59–S69. [DOI] [PubMed] [Google Scholar]
- [9]. Stapleton, K. W. , Guentsch, E. , Hoskinson, M. K. , and Finlay, W. H. , 2000, “On the Suitability of K-Epsilon Turbulence Modeling for Aerosol Deposition in the Mouth and Throat: A Comparison With Experiment,” J. Aerosol Sci., 31(6), pp. 739–749. 10.1016/S0021-8502(99)00547-9 [DOI] [Google Scholar]
- [10]. Wang, Z. L. , Grgic, B. , and Finlay, W. H. , 2006, “A Dry Powder Inhaler With Reduced Mouth-Throat Deposition,” J. Aerosol Med., 19(2), pp. 168–174. 10.1089/jam.2006.19.168 [DOI] [PubMed] [Google Scholar]
- [11]. DeHaan, W. H. , and Finlay, W. H. , 2001, “In Vitro Monodisperse Aerosol Deposition in a Mouth and Throat With Six Different Inhalation Devices,” J. Aerosol Med., 14(3), pp. 361–367. 10.1089/089426801316970321 [DOI] [PubMed] [Google Scholar]
- [12]. Matida, E. A. , Finlay, W. H. , and Grgic, L. B. , 2004, “Improved Numerical Simulation of Aerosol Deposition in an Idealized Mouth-Throat,” J. Aerosol Sci., 35, pp. 1–19. 10.1016/S0021-8502(03)00381-1 [DOI] [Google Scholar]
- [13]. Zhang, Y. , Finlay, W. H. , and Matida, E. A. , 2004, “Particle Deposition Measurements and Numerical Simulations in a Highly Idealized Mouth-Throat,” J. Aerosol Sci., 35, pp. 789–803. 10.1016/j.jaerosci.2003.12.006 [DOI] [Google Scholar]
- [14]. Grgic, B. , Finlay, W. H. , Burnell, P. K. P. , and Heenan, A. F. , 2004, “In Vitro Intersubject and Intrasubject Deposition Measurements in Realistic Mouth-Throat Geometries,” J. Aerosol Sci., 35(8), pp. 1025–1040. 10.1016/j.jaerosci.2004.03.003 [DOI] [Google Scholar]
- [15]. Stahlhofen, W. , Rudolf, G. , and James, A. C. , 1989, “Intercomparison of Experimental Regional Aerosol Deposition Data,” J. Aerosol Med., 2(3), pp. 285–308. 10.1089/jam.1989.2.285 [DOI] [Google Scholar]
- [16]. Xi, J. , and Longest, P. W. , 2007, “Transport and Deposition of Micro-Aerosols in Realistic and Simplified Models of the Oral Airway,” Ann. Biomed. Eng., 35(4), pp. 560–581. 10.1007/s10439-006-9245-y [DOI] [PubMed] [Google Scholar]
- [17]. Xi, J. , Longest, P. W. , and Martonen, T. B. , 2008, “Effects of the Laryngeal Jet on Nano- and Microparticle Transport and Deposition in an Approximate Model of the Upper Tracheobronchial Airways,” J. Appl. Physiol., 104, pp. 1761–1777. 10.1152/japplphysiol.01233.2007 [DOI] [PubMed] [Google Scholar]
- [18]. Zhou, Y. , Sun, J. , and Cheng, Y. S. , 2011, “Comparison of Deposition in the USP and Physical Mouth-Throat Models with Solid and Liquid Particles,” J. Aerosol Med. Pulm. Drug Deliv., 24(6), pp. 277–284. 10.1089/jamp.2011.0882 [DOI] [PMC free article] [PubMed] [Google Scholar]
- [19]. Longest, P. W. , Hindle, M. , Das Choudhuri, S. , and Xi, J. , 2008, “Comparison of Ambient and Spray Aerosol Deposition in a Standard Induction Port and More Realistic Mouth-Throat Geometry,” J. Aerosol Sci., 39, pp. 572–591. 10.1016/j.jaerosci.2008.03.008 [DOI] [Google Scholar]
- [20]. Delvadia, R. Longest, P. W. and Byron, P. R. , 2012, “In Vitro Tests for Aerosol Deposition. I. Scaling a Physical Model of the Upper Airways to Predict Drug Deposition Variation in Normal Humans,” J. Aerosol Med., 25(1), pp. 32–40. 10.1089/jamp.2011.0905 [DOI] [PubMed] [Google Scholar]
- [21]. Delvadia, R. , Hindle, M. , Longest, P. W. , and Byron, P. R. , 2012, “In Vitro Tests for Aerosol Deposition. II: IVIVCs for Different Dry Powder Inhalers in Normal Adults,” J. Aerosol Med. Pulm. Drug Deliv., (in press). 10.1089/jamp.2011.0905 [DOI] [PubMed] [Google Scholar]
- [22]. Burnell, P. K. P. , Asking, L. , Borgstrom, L. , Nichols, S. C. , Olsson, B. , Prime, D. , and Shrubb, I. , 2007, “Studies of the Human Oropharyngeal Airspaces Using Magnetic Resonance Imaging IV-The Oropharyngeal Retention Effect for Four Inhalation Delivery Systems,” J. Aerosol Med., 20(3), pp. 269–281. 10.1089/jam.2007.0566 [DOI] [PubMed] [Google Scholar]
- [23]. Zhang, Z. , Kleinstreuer, C. , and Kim, C. S. , 2009, “Comparison of Analytical and CFD Models With Regard to Micron Particle Deposition in a Human 16-Generation Tracheobronchial Airway Model,” J. Aerosol Sci., 40, pp. 16–28. 10.1016/j.jaerosci.2008.08.003 [DOI] [Google Scholar]
- [24]. Isaacs, K. K. , Schlesinger, R. B. , and Martonen, T. B. , 2006, “Three-Dimensional Computational Fluid Dynamics Simulations of Particle Deposition in the Tracheobronchial Tree,” J. Aerosol Med., 19(3), pp. 344–352. 10.1089/jam.2006.19.344 [DOI] [PubMed] [Google Scholar]
- [25]. Russo, J. , Robinson, R. , and Oldham, M. J. , 2008, “Effects of Cartilage Rings on Airflow and Particle Deposition in the Trachea and Main Bronchi,” Med. Eng. Phys., 30, pp. 581–589. 10.1016/j.medengphy.2007.06.010 [DOI] [PubMed] [Google Scholar]
- [26]. Zhang, Y. , and Finlay, W. H. , 2005, “Measurement of the Effect of Cartilaginous Rings on Particle Deposition in a Proximal Lung Bifurcation Model,” Aerosol Sci. Technol., 39, pp. 394–399. 10.1080/027868290945785 [DOI] [Google Scholar]
- [27]. Kleinstreuer, C. and Zhang, Z. , 2009, “An Adjustable Triple-Bifurcation Unit Model for Air-Particle Flow Simulations in Human Tracheobronchial Airways,” ASME J. Biomech. Eng., 131, p. 021007. 10.1115/1.3005339 [DOI] [PubMed] [Google Scholar]
- [28]. Walters, D. K. , and Luke, W. H. , 2011, “Computational Fluid Dynamics Simulations of Particle Deposition in Large-Scale Multigenerational Lung Models,” ASME J. Biomech. Eng., 133, p. 011003. 10.1115/1.4002936 [DOI] [PubMed] [Google Scholar]
- [29]. Zhang, Z. , Kleinstreuer, C. , Donohue, J. F. , and Kim, C. S. , 2005, “Comparison of Micro- and Nano-Size Particle Depositions in a Human Upper Airway Model,” J. Aerosol Sci., 36(2), pp. 211–233. 10.1016/j.jaerosci.2004.08.006 [DOI] [Google Scholar]
- [30]. Jin, H. H. , Fan, J. R. , Zeng, M. J. , and Cen, K. F. , 2007, “Large Eddy Simulation of Inhaled Particle Deposition Within the Human Upper Respiratory Tract,” J. Aerosol Sci., 38, pp. 257–268. 10.1016/j.jaerosci.2006.09.008 [DOI] [Google Scholar]
- [31]. Lambert, A. R. , O’Shaughnessy, P. T. , Tawhai, M. H. , Hoffman, E. A. , and Lin, C.-L. , 2011, “Regional Deposition of Particles in an Image-Based Airway Model: Large-Eddy Simulation and Left-Right Lung Ventilation Asymmetry,” Aerosol Sci. Technol., 45, pp. 11–25. 10.1080/02786826.2010.517578 [DOI] [PMC free article] [PubMed] [Google Scholar]
- [32]. Sauret, V. , Halson, P. M. , Brown, I. W. , Fleming, J. S. , and Bailey, A. G. , 2002, “Study of the Three-Dimensional Geometry of the Central Conducting Airways in Man Using Computed Tomographic (CT) Images,” J. Anat., 2002, pp. 123–134. [DOI] [PMC free article] [PubMed] [Google Scholar]
- [33]. Robinson, R. J. , Russo, J. , and Doolittle, R. L. , 2009, “3D Airway Reconstruction Using Visible Human Data Set and Human Casts With Comparison to Morpometric Data,” Anat. Rec., 292, pp. 1028–1044. 10.1002/ar.20898 [DOI] [PubMed] [Google Scholar]
- [34]. Montesantos, S. , Fleming, J. S. , and Tossici-Bold, L. , 2010, “A Spatial Model of the Human Airway Tree: The Hybrid Conceptual Model,” J. Aerosol Med. Pulm. Drug Deliv., 23(1), pp. 59–68. 10.1089/jamp.2009.0765 [DOI] [PubMed] [Google Scholar]
- [35]. Lin, C.-L. , Tawhai, M. H. , McLennan, G. , and Hoffman, E. A. , 2007, “Characteristics of the Turbulent Laryngeal Jet and its Effect on Airflow in the Human Intra-Thoracic Airways,” Resp. Physiol. Neurobiol., 157, pp. 295–309. 10.1016/j.resp.2007.02.006 [DOI] [PMC free article] [PubMed] [Google Scholar]
- [36]. Lin, C.-L. , Tawhai, M. H. , McLennan, G. , and Hoffman, E. A. , 2009, “Multiscale Simulation of Gas Flow in Subject-Specific Models of the Human Lung,” IEEE Eng. Med. Biol. Mag., 28, pp. 25–33. [DOI] [PubMed] [Google Scholar]
- [37]. Choi, J. , Tawhai, M. , Hoffman, E. A. , and Lin, C. L. , 2009, “On Intra- and Intersubject Variabilities of Airflow in the Human Lungs,” Phys. Fluids, 21, p. 101901. 10.1063/1.3247170 [DOI] [PMC free article] [PubMed] [Google Scholar]
- [38]. Ma, B. , and Lutchen, K. R. , 2009, “CFD Simulations of Aerosol Deposition in an Anatomically Based Human Large-Medium Airway Model,” Ann. Biomed. Eng., 37(2), pp. 271–285. 10.1007/s10439-008-9620-y [DOI] [PubMed] [Google Scholar]
- [39]. Inthavong, K. , Choi, L.-T. , Tu, J. , Diang, S. , and Thien, F. , 2010, “Micron Particle Deposition in a Tracheobronchial Airway Model Under Different Breathing Conditions,” Med. Eng. Phys., 32, pp. 1198–1212. 10.1016/j.medengphy.2010.08.012 [DOI] [PubMed] [Google Scholar]
- [40]. De Backer, J. W. , Vos, W. G. , Vinchurkar, S. C. , Claes, R. , Drollmann, A. , Wulfrank, D. , Parizel, P. M. , Germonpre, P. , and De Backer, W. , 2010, “Validation of Computational Fluid Dynamics in CT-based Airway Models With SPECT/CT,” Radiology, 257(3), pp. 854–862. 10.1148/radiol.10100322 [DOI] [PubMed] [Google Scholar]
- [41]. Xi, J. , and Longest, P. W. , 2008, “Evaluation of a Novel Drift Flux Model for Simulating Submicrometer Aerosol Dynamics in Human Upper Tracheobronchial Airways,” Ann. Biomed. Eng., 36(10), pp. 1714–1734. 10.1007/s10439-008-9552-6 [DOI] [PubMed] [Google Scholar]
- [42]. Longest, P. W. , and Hindle, M. , 2011, “Condensational Growth of Combination Drug-Excipient Submicrometer Particles: Comparison of CFD Predictions With Experimental Results,” Pharm. Res. (in press). [DOI] [PMC free article] [PubMed] [Google Scholar]
- [43]. Heistracher, T. , and Hofmann, W. , 1995, “Physiologically Realistic Models of Bronchial Airway Bifurcations,” J. Aerosol Sci., 26(3), pp. 497–509. 10.1016/0021-8502(94)00113-D [DOI] [Google Scholar]
- [44]. Yeh, H. C. and Schum, G. M. , 1980, “Models of Human Lung Airways and Their Application to Inhaled Particle Deposition,” Bull. Math. Biol., 42, p. 461–480. 10.1007/BF02460796 [DOI] [PubMed] [Google Scholar]
- [45]. Horsfield, K. , Dart, G. , Olson, D. E. , Filley, G. F. , and Cumming, G. , 1971, “Models of the Human Bronchial Tree,” J. Appl. Physiol., 31, pp. 207–217. [DOI] [PubMed] [Google Scholar]
- [46]. Hammersley, J. R. , and Olson, D. E. , 1992, “Physical Models of the Smaller Pulmonary Airways,” J. Appl. Physiol., 72, pp. 2402–2414. [DOI] [PubMed] [Google Scholar]
- [47]. Tian, G. , Longest, P. W. , Su, G. , and Hindle, M. , 2011, “Characterization of Respiratory Drug Delivery with Enhanced Condensational Growth (ECG) Using an Individual Path Model of the Entire Tracheobronchial Airways,” Ann. Biomed. Eng., 39(3), pp. 1136–1153. 10.1007/s10439-010-0223-z [DOI] [PMC free article] [PubMed] [Google Scholar]
- [48]. Tian, G. , Longest, P. W. , Su, G. , Walenga, R. L. , and Hindle, M. , 2011, “Development of a Stochastic Individual Path (SIP) Model for Predicting the Tracheobronchial Deposition of Pharmaceutical Aerosols: Effects of Transient Inhalation and Sampling the Airways,” J. Aerosol Sci., 42, pp. 781–799. 10.1016/j.jaerosci.2011.07.005 [DOI] [Google Scholar]
- [49]. Longest, P. W. , Tian, G. , Walenga, R. L. , and Hindle, M. , 2012, “Comparing MDI and DPI Aerosol Deposition Using In Vitro Experiments and a New Stochastic Individual Path (SIP) Model of the Conducting Airways,” Pharm. Res., 29, pp. 1670–1688. 10.1007/s11095-012-0691-y [DOI] [PubMed] [Google Scholar]
- [50]. Vinchurkar, S. , and Longest, P. W. , 2008, “Evaluation of Hexahedral, Prismatic and Hybrid Mesh Styles for Simulating Respiratory Aerosol Dynamics,” Comput. Fluids, 37, pp. 317–331. 10.1016/j.compfluid.2007.05.001 [DOI] [Google Scholar]
- [51]. Longest, P. W. , and Vinchurkar, S. , 2007, “Effects of Mesh Style and Grid Convergence on Particle Deposition in Bifurcating Airway Models With Comparisons to Experimental Data,” Med. Eng. Phys., 29(3), pp. 350–366. 10.1016/j.medengphy.2006.05.012 [DOI] [PubMed] [Google Scholar]
- [52]. ICRP, 1994, Human Respiratory Tract Model for Radiological Protection, Elsevier Science Ltd., New York. [Google Scholar]
- [53]. Griscom, N. T. , and Wohl, M. E. B. , 1986, “Dimensions of the Growing Trachea Related to Age and Gender,” Am. J. Roentgenol., 146(2), pp. 233–237. 10.2214/ajr.146.2.233 [DOI] [PubMed] [Google Scholar]
- [54]. Phalen, R. F. , Oldham, M. J. , Beaucage, C. B. , Crocker, T. T. , and Mortensen, J. D. , 1985, “Postnatal Enlargement of Human Tracheobronchial Airways and Implications for Particle Deposition,” Anat. Rec., 212, pp. 368–380. 10.1002/ar.1092120408 [DOI] [PubMed] [Google Scholar]
- [55]. Raabe, O. G. , Yeh, H. C. , Schum, G. M. , and Phalen, R. F. , 1976, “Tracheobronchial Geometry: Human, Dog, Rat, Hamster”, Report No. LF-53. Available at: http://hdl.handle.net/123456789/71 [Google Scholar]
- [56]. Soong, T. T. , Nicolaides, P. , Yu, C. P. , and Soong, S. C. , 1979, “A Statistical Description of the Human Tracheobronchial Tree Geometry,” Respir. Physiol., 37(2), pp. 161–172. 10.1016/0034-5687(79)90068-9 [DOI] [PubMed] [Google Scholar]
- [57]. Weibel, E. R. , 1963, Morphometry of the Human Lung, Springer-Verlag, Berlin. [Google Scholar]
- [58]. Kuo, Y. , Tully, E. A. , and Galea, M. P. , 2009, “Video Analysis of Sagittal Spinal Posture in Healthy Young and Older Adults,” J. Manipulative Physiol. Ther., 32(3), pp. 210–215. 10.1016/j.jmpt.2009.02.002 [DOI] [PubMed] [Google Scholar]
- [59]. Martin, G. P. , Marriott, C. , and Zhang, X. M. , 2007, “Influence of Realistic Inspiratory Flow Profiles on Fine Particle Fractions of Dry Powder Aerosol Formulations,” Pharm. Res., 24(2), pp. 361–369. 10.1007/s11095-006-9156-5 [DOI] [PubMed] [Google Scholar]
- [60]. Asgharian, B. , and Price, O. T. , 2006, “Airflow Distribution in the Human Lung and its Influence on Particle Deposition,” Inhal. Toxicol., 18, pp. 795–801. 10.1080/08958370600748687 [DOI] [PubMed] [Google Scholar]
- [61]. Yin, Y. , Choi, J. , Hoffman, E. A. , Tawhai, M. H. , and Lin, C.-L. , 2010, “Simulation of Pulmonary Air Flow With a Subject-Specific Boundary Condition,” J. Biomech., 43, pp. 2159–2163. 10.1016/j.jbiomech.2010.03.048 [DOI] [PMC free article] [PubMed] [Google Scholar]
- [62]. Longest, P. W. , Hindle, M. , Das Choudhuri, S. , and Byron, P. R. , 2007, “Numerical Simulations of Capillary Aerosol Generation: CFD Model Development and Comparisons With Experimental Data,” Aerosol Sci. Technol., 41, pp. 952–973. 10.1080/02786820701607027 [DOI] [Google Scholar]
- [63]. Longest, P. W. , and Vinchurkar, S. , 2007, “Validating CFD Predictions of Respiratory Aerosol Deposition: Effects of Upstream Transition and Turbulence,” J. Biomech., 40, pp. 305–316. 10.1016/j.jbiomech.2006.01.006 [DOI] [PubMed] [Google Scholar]
- [64]. Longest, P. W. , Hindle, M. , Das Choudhuri, S. , and Byron, P. R. , 2008, “Developing a Better Understanding of Spray System Design Using a Combination of CFD Modeling and Experiment,” Proceedings of Respiratory Drug Delivery 2008, Dalby R. N., Byron P. R., Peart J. Suman J. D., Farr S. J., and Young P. M., eds, Davis Healthcare International Publishing, Illinois, pp. 151–163. [Google Scholar]
- [65]. Longest, P. W. , and Xi, J. , 2008, “Condensational Growth May Contribute to the Enhanced Deposition of Cigarette Smoke Particles in the Upper Respiratory Tract,” Aerosol Sci. Technol., 42, pp. 579–602. 10.1080/02786820802232964 [DOI] [Google Scholar]
- [66]. Longest, P. W. , and Xi, J. , 2007, “Effectiveness of Direct Lagrangian Tracking Models for Simulating Nanoparticle Deposition in the Upper Airways,” Aerosol Sci. Technol., 41, pp. 380–397. 10.1080/02786820701203223 [DOI] [Google Scholar]
- [67]. Stein, S. W. , and Myrdal, P. B. , 2006, “The Relative Influence of Atomization and Evaporation on Metered Dose Inhaler Drug Delivery Efficiency,” Aerosol Sci. Technol., 40, pp. 335–347. 10.1080/02786820600612268 [DOI] [Google Scholar]
- [68]. Balashazy, I. , Hofmann, W. , and Heistracher, T. , 1999, “Computation of Local Enhancement Factors for the Quantification of Particle Deposition Patterns in Airway Bifurcations,” J. Aerosol Sci., 30, pp. 185–203. 10.1016/S0021-8502(98)00040-8 [DOI] [Google Scholar]
- [69]. Zhou, Y. , and Cheng, Y. S. , 2005, “Particle Deposition in a Cast of Human Tracheobrochial Airways,” Aerosol Sci. Technol., 39, pp. 492–500. 10.1080/027868291001385 [DOI] [Google Scholar]
- [70]. Leach, C. L. , Davidson, P. J. , and Bouhuys, A. , 1998, “Improved Airway Targeting With the CFC-Free HFA-Beclomethasone Metered-Dose Inhaler Compared With CFC-Beclomethasone,” Eur. Respir. J., 12, pp. 1346–1353. 10.1183/09031936.98.12061346 [DOI] [PubMed] [Google Scholar]
- [71]. Newman, S. P. , and Busse, W. W. , 2002, “Evolution of Dry Powder Inhaler Design, Formulation, and Performance,” Respir. Med., 96, pp. 293–304. 10.1053/rmed.2001.1276 [DOI] [PubMed] [Google Scholar]
- [72]. Islam, N. , and Cleary, M. J. , 2012, “Developing an Efficient and Reliable Dry Powder Inhaler for Pulmonary Drug Delivery—A Review for Multidisciplinary Researchers,” Med. Eng. Phys., 34, pp. 409–427. 10.1016/j.medengphy.2011.12.025 [DOI] [PubMed] [Google Scholar]
- [73]. Newman, S. P. , Pitcairn, G. R. , Hirst, P. H. , Bacon, R. E. , O’Keefe, E. , Reiners, M. , and Hermann, R. , 2000, “Scintigraphic Comparison of Budesonide Deposition From Two Dry Powder Inhalers,” Eur. Respir. J., 16(1), pp. 178–183. 10.1034/j.1399-3003.2000.16a29.x [DOI] [PubMed] [Google Scholar]
- [74]. Conway, J. , Fleming, J. , Majoral, C. , Katz, I. , Perchet, D. , Peebles, C. , Tossici-Bolt, L. , Collier, L. , Caillibotte, G. , Pichelin, M. , Sauret-Jackson, V. , Martonen, T. , Apiou-Sbirlea, G. , Muellinger, B. , Kroneberg, P. , Gleske, J. , Scheuch, G. , Texereau, J. , Martin, A. , Montesantos, S. , and Bennett, M. , 2012, “Controlled, Parametric, Individualized, 2-D and 3-D Imaging Measurements of Aerosol Deposition in the Respiratory Tract of Healthy Human Subjects for Model Validation,” J. Aerosol Sci., 52, pp. 1–17. 10.1016/j.jaerosci.2012.04.006 [DOI] [Google Scholar]