Abstract
Although microdamage is known to accumulate in trabecular bone with overloading and aging, the tissue-level stresses and strains associated with local bone failure are not well known. Local correlation of microdamage with microstructural stresses and strains requires methods to accurately register histological sections with micro-computed tomography (micro-CT) based finite element models. In addition, the resolution of correlation (i.e., grid size) selected for analysis may affect the observed results. Therefore, an automated, repeatable, and accurate image registration algorithm was developed to determine the range of local stresses and strains associated with microdamage initiation. Using a two-dimensional rigid registration algorithm, bone structures from histology and micro-CT imaging were aligned. Once aligned, microdamaged regions were spatially correlated with local stresses and strains obtained from micro-CT based finite element analysis. Using this more sophisticated registration technique, we were able to analyze the effects of varying spatial grid resolution on local stresses and strains initiating microdamage. The results indicated that grid refinement to the individual pixel level (pixel-by-pixel method) more precisely defined the range of microdamage initiation compared to manually selected individual damaged and undamaged trabeculae. Using the pixel-by-pixel method, we confirmed that trabecular bone from younger cows sustained higher local strains prior to microdamage initiation compared to older bone.
Keywords: trabecular bone, microdamage, microcomputed tomography, finite element analysis, image registration
Introduction
Trabecular bone is a complex arrangement of interconnected rods and plates. This structure possesses a high bone surface area effective at dissipating and absorbing loads transmitted from joints. However, during normal aging or disease conditions, an accumulation of unrepaired microdamage combined with continual bone loss weakens trabecular bone to a state where ordinary physical activity may cause spontaneous osteoporotic fractures. In the United States alone, osteoporosis affects 17 million people resulting in over 47 billion dollars in annual medical services to treat osteoporotic fractures [1].
While the importance of microdamage is well established, the relationship between the local stresses and the onset of trabecular bone microdamage is not well understood. A better understanding of local mechanisms of bone failure is important to the assessment of bone quality and the development of therapies for bone fragility diseases such as osteoporosis. Local stresses and strains in trabecular bone have been accurately estimated using sophisticated image-based finite element models [2,3]. Recently, bone micro-damage has been detected through promising histological methods such as fluorescent calcium chelation [4]. In order to establish a relationship between local stresses and microdamage, image registration of bone structures between these two modalities is necessary. There have been a few studies to develop image registration algorithms specifically for trabecular bone. All of these studies have focused on algorithms to register a series of bone images taken from the same modality (computed tomography [CT] or magnetic resonance imaging [MRI]) during longitudinal studies [5–7]. These images were aligned using rigid body transformation (composed of translation and rotation). In our previous study, local stresses and strains initiating microdamage were obtained by manually aligning histology and micro-CT images and subsequently selecting individual damaged and undamaged trabeculae for analysis [8]. Although this first attempt provided good correlations, manual techniques were time-consuming and incorporated possible human error. In this study, the objective was to develop an automated, repeatable, and accurate registration algorithm that would provide refined regional correlations of microdamage with local stresses/strains down to the image pixel level (pixel-by-pixel analysis). Using this technique, the goal of this study was to determine whether the local stresses/strains initiating microdamage are affected by grid refinement.
Materials and Methods
Specimen Preparation, Micro-CT Imaging, and Mechanical Testing.
Trabecular bone specimens 18 mm in length and 5 mm in diameter were extracted from the proximal tibia of skeletally mature cows approximately 2 and 10 years old. The ends of the specimens were attached with stainless steel endcaps to minimize the effects of end artifacts on mechanical testing data [9]. Cylindrical reduced-section samples were created from these cores to produce specimens with a 5 mm gauge length and 4 mm diameter. All specimens were micro-CT imaged (μCT 40, Scanco Medical, Basserdorf, Switzerland) at a voxel resolution of 20 μm. In these gray scale images, trabecular bone was distinguished from background through histogram analysis and remained consistent throughout all evaluations. Using a standard mechanical testing system (Mini Bionix 858, MTS Corp.), specimens (n = 3 per age group) were compressed to 1.1% (approximately the yield strain as determined by preliminary testing) and held for 3 h. Specimens were immersed in 0.9% physiologic saline throughout mechanical testing.
Labeling Microdamage.
Microdamage was detected using a sequential fluorescent labeling technique. This technique was developed to differentiate preexisting damage from damage sustained by in vitro mechanical testing [10,11]. The damage detection protocol used in this study has been previously described in detail [8] and is briefly described here. Prior to mechanical testing, specimens were stained with 0.02% alizarin complexone to label preexisting microdamage. Postmechanical testing, specimens were stained with 0.005% calcein to label microdamage incurred from mechanical testing. After staining, specimens were secured in custom alignment fixtures to facilitate registration of histological sections to corresponding micro-CT sections for the same specimen. Specimens were then embedded in methyl methacrylate and sectioned into 150–200 μm thick longitudinal slices. Test-induced microdamage was assessed under green epifluorescence using a 4 × objective (0.84 μm/pixel) in the central four histology sections from each sample.
Finite Element Analysis.
Micro-CT images were used to create three-dimensional high-resolution finite element (FE) models for estimating the local stress and strain distributions (FEA software, Scanco Medical, Basserdorf, Switzerland). After thresholding the micro-CT images, individual voxels within the images were directly converted into 1–3 million hexahedral finite elements by assigning nodal connectivity and bone tissue properties. A conjugate gradient solver with an element-by-element matrix vector multiplication scheme allowed for the estimation of tissue-level stresses and strains [3]. A homogeneous linear isotropic analysis was utilized with a local Young's modulus of 11.5 MPa (2 years old) and 25.2 GPa (10 years old) with a Poisson's ratio of 0.3. The tissue modulus was backcalculated to match the apparent modulus obtained during testing of the specimens [12]. Uniaxial compressive strains were imposed on the top face of models to replicate boundary conditions from the mechanical test. Strain energy density (SED), von Mises equivalent stresses and strains, and maximum compressive principal stresses and strains were the mechanical parameters extracted from the FE analysis.
Image Registration.
An automated two-dimensional rigid registration algorithm was developed and implemented in MATLAB (MathWorks, USA) to spatially align bone structures in histology and micro-CT image slices (Fig. 1). Two-dimensional gray scale histology images were thresholded twice, once for bone structure and another for damage distribution. Histogram analysis and visual inspection were used to distinguish trabecular bone structure from background. The 3D micro-CT image of bone structure was extracted into a series of 2D sections (20 μm section thickness). Eight to ten micro-CT sections corresponding to the same region from the histology section were combined together into a single 2D image using a logical OR operation applied pixelwise. Since the histology image resolution (0.8 μm/pixel) was greater than the micro-CT image resolution (20.7 μm/pixel), the histology image was subsampled to equal the resolution of the micro-CT image. Next, the algorithm rigidly aligned bone structures in histology and micro-CT image slices. Histology images were iteratively rotated in 0.5 deg and translated in 50 μm increments. The mean-squared difference (MSD) image similarity measure was utilized to quantitatively compare alignment of bone structures between histology and micro-CT images. MSD is calculated from spatial differences in pixel intensities between images according to
Fig. 1.
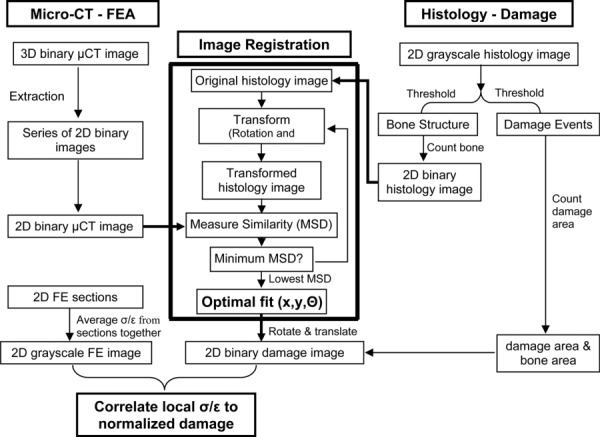
Flow chart for automated two-dimensional spatial correlations of microdamage (histology) to local stress/strain (micro-CT/finite element analysis)
In this equation, N is the total number of pixels, H(x,y) is pixel intensity at the coordinates (x,y) in the binary histology image, and CT(x,y) is the pixel intensity at the coordinates (x,y) in the binary micro-CT image. Optimal alignment corresponded to the rotation angle and translations with the lowest MSD value. Registration accuracy was determined by locating the centerlines of the trabecular network in both histology and micro-CT sections (Fig. 2). These “skeletonized” images were then superimposed to determine whether centerlines of the trabecular structures corresponded.
Fig. 2.
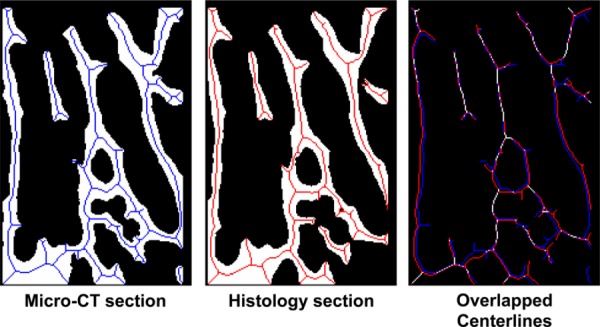
Representation section displaying centerlines (“skeletons”) of trabecular bone structure in both micro-CT (left) and histology (middle) sections. Aligned centerlines are displayed in white (right).
Microdamage Initiation.
Once registered, each image was divided into spatial grids of decreasing area from 0.42 mm2 (6 × 6 grid), 0.10 mm2 (12 × 12 grid), and 0.03 mm2 (24 × 24 grid) (Fig. 3). To identify ranges of stresses/strains associated with micro-damage initiation, microdamaged and undamaged grids were identified and correlated with the corresponding average stress/strain within the grid. In addition, further grid refinement was performed to the individual pixel level (0.0004 mm2) (Fig. 4). This condition, pixel by pixel (PP), is the limiting case for grid refinement in which every registered damaged and undamaged pixel in the histology section is used to determine the range of microdamage initiation. Stresses and strains associated with microdamage initiation for different grid sizes were compared to the manual individual trabeculae (IT) extraction technique used in our previous studies [8]. In the automated method, grids selected for analysis must contain bone pixel(s) in both micro-CT and histology sections (white regions shown in Fig. 5). As a result, the PP method contained approximately 900 damaged and 90,000 undamaged pixels in each age group. In contrast, the IT method extracted 20 distinctly damaged and undamaged trabeculae per age group from histology sections. With the IT method, damaged trabeculae were chosen as the most severely damaged trabeculae and less damaged trabeculae were excluded from the IT analysis. Therefore the PP method is more sensitive than the IT approach since the data would represent all the microdamaged and undamaged pixels in sections rather than individually selected trabeculae. This more sensitive technique may allow for improved detection of age-related changes to local stresses/strains initiating trabecular microdamage.
Fig. 3.
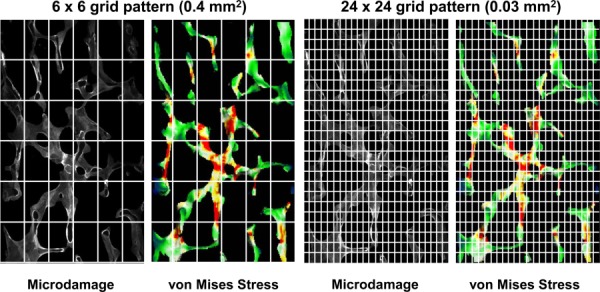
Example of grid arrangements for correlations between microdamage and local stresses. Images were divided into various grid sizes ranging from 0.42 mm2 to 0.03 mm2 for each grid. A 6 × 6 arrangement is displayed on the left and a 24 × 24 arrangement on the right.
Fig. 4.
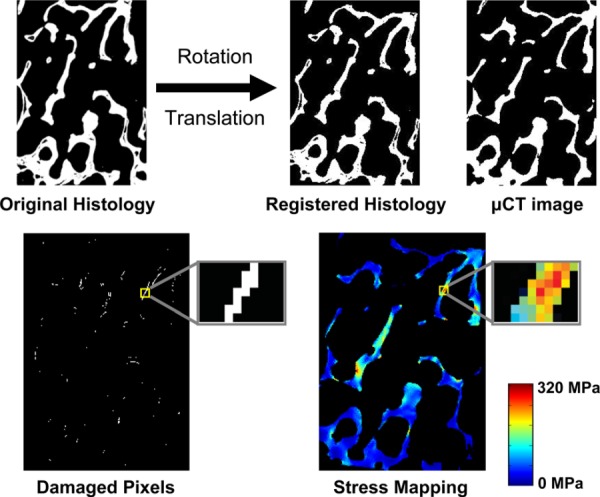
Example of two-dimensional automated image registration (top). Histology section is iteratively rotated and translated to optimally align with the micro-CT section. Once registered, the pixel-by-pixel method was used to analyze the stresses/ strains in microdamaged and undamaged pixels (bottom).
Fig. 5.
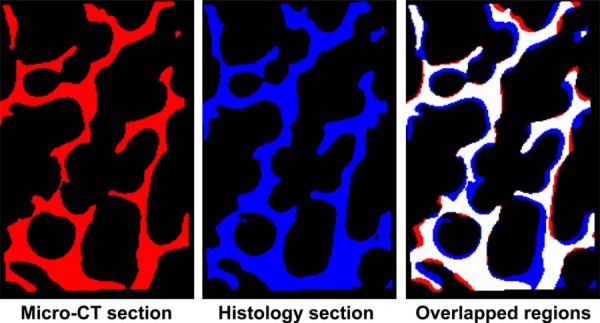
Using automated image registration, only overlapping regions were used to calculate the range of microdamage initiation. Registered trabecular bone structures in both micro-CT (left) and histology (middle) sections. Overlapped images (right) showing registered regions are in white. Only regions in white were utilized for analysis.
Statistics.
Tukey's pairwise comparisons (Minitab, Minitab Inc., USA) were performed to determine statistical significance for microdamage and mechanical parameters between different age groups.
Results
To improve on the previously used individual trabeculae analysis, an automated image registration and correlation algorithm was developed to more precisely estimate the local stresses and strains associated with microdamage initiation. Using this technique, we were able to refine our analysis regions down to individual pixels. With a coarse 6 × 6 grid (0.42 mm2 grid area), the maximum compressive principal stress (88.8 ± 2.6 MPa) and strain (0.78 ± 0.02%) in microdamaged regions of 2 year old specimens were significantly lower compared to stress (144.1 ± 7.2 MPa) and strain (1.24 ± 0.06%) values from the IT analysis (Fig. 6). However, with grid refinement to the pixel level (0.0004 mm2 area), the maximum compressive principal stress (135.7 ± 2.7 MPa) and strain (1.21 ± 0.02%) in microdamaged regions of 2 year old specimens increased to similar stress and strain values obtained from the IT analysis. Correspondingly, with a 6 × 6 grid, the maximum compressive principal stress (78.8 ± 2.4 MPa) and strain (0.69 ± 0.02%) in undamaged pixels of 2 year old specimens were significantly lower compared to stress (99.6 ± 5.7 MPa) and strain (0.86 ± 0.05%) values from the IT analysis. However, with grid refinement to the pixel level, maximum compressive principal stress (91.6 ± 0.2 MPa) and strain (0.82 ± 0.002%) in undamaged pixels of 2 year old specimens were slightly lower, but similar to stress and strain values from the IT analysis.
Fig. 6.
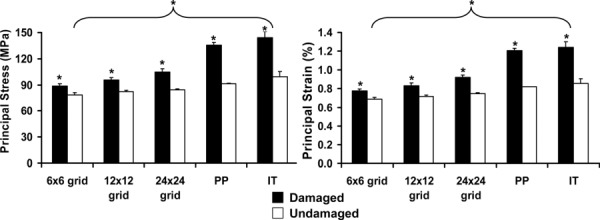
Average local compressive principal stresses and strains for damaged and undamaged grids ranging from 0.42 mm2 (6 × 6 grid) to 0.0004 mm2 (PP) within young (2 year old) bovine trabecular bone. Individual trabeculae analysis obtained in a previous study is displayed for comparison purposes. Pairwise comparisons: An asterisk indicates significant difference (p < 0.01).
With a coarse 6 × 6 grid, the maximum compressive principal stress (87.2.5 ± 4.7 MPa) and strain (0.33 ± 0.02%) in microdam-aged pixels of 10 year old specimens were much lower than stress (219.2 ± 20.5 MPa) and strain (0.86 ± 0.08%) values from the IT analysis (Fig. 7). With grid refinement down to PP, the maximum compressive principal stress (110.5 ± 4.7 MPa) and strain (0.64 ± 0.03%) in microdamaged pixels of 10 year old specimens increased, but remained significantly lower than stress and strain values from the IT analysis. Similarly, with a 6 × 6 grid, the maximum compressive principal stress (52.8 ± 4.0 MPa) and strain (0.19 ± 0.02%) in undamaged pixels of 10 year old specimens were significantly lower to stress (89.2 ± 18.6 MPa) and strain (0.34 ± 0.07%) values estimated from the IT analysis. With grid refinement to individual pixels, the maximum compressive principal stress (81.1 ± 0.4 MPa) and strain (0.38 ± 0.002%) in undamaged pixels of 10 year old specimens were slightly lower, but similar to stress and strain values from the IT analysis. For all grid sizes analyzed, damaged pixels were found to have significantly higher principal stresses and strains than undamaged pixels (p < 0.01). The average von Mises effective stresses/strains and SED followed the same trends as maximum compressive principal stresses and strains, respectively (data not shown).
Fig. 7.

Average local compressive principal stresses and strains for damaged and undamaged grids ranging from 0.42 mm2 (6 × 6 grid) to 0.0004 mm2 (PP) within older (10 year old) bovine trabecular bone. Individual trabeculae analysis obtained in a previous study is displayed for comparison purposes. Pairwise comparisons: An asterisk indicates significant difference (p < 0.01).
Discussion
Although microdamage is known to accumulate in bone with overloading and aging, the local stresses and strains associated with microdamage initiation in trabecular bone are not well understood. In this study, we developed an automated two-dimensional image registration algorithm to correlate small regions of micro-damage to local stresses/strains.
We defined the initiation of microdamage to occur in the range between the average stress/strain for undamaged trabeculae and damaged trabeculae (Fig. 8). For 2 year old specimens, the range of microdamage initiation using the more sensitive PP approach (92–136 MPa and 0.82–1.21%) was very similar to the IT method (99–144 MPa and 0.86–1.24%). However, the range of microdamage initiation in 10 year old trabecular bone was more precise with the PP method (81–110 MPa and 0.38–0.64%) compared to the IT method (89–219 MPa and 0.34–0.86%). A key advantage to the PP method is incorporation of both severely and moderately damaged regions in the analysis. The IT analysis utilizes the most severely damaged trabeculae and less damaged trabeculae are excluded. Thus, the PP analysis will estimate a more realistic range of stresses/strains for microdamage initiation in specimens with a mix of both severely and moderately damaged trabeculae. This is observed in 10 year old specimens where both severe linear microcracks (high stress/strain) and moderate diffuse damage (lower stress/strain) were present resulting in a more narrow microdamage initiation range with the PP method compared to the IT method. In contrast, 2 year old specimens contained predominantly severe linear microcracks resulting in similar microdamage initiation ranges from both methods. Therefore, the PP method is a more sensitive technique as it integrates multiple types of damage resulting in improved detection of age-related changes to local stresses/strains initiating trabecular microdamage.
Fig. 8.

Comparison of microdamage initiation ranges between IT and PP approaches for both young (2 year old) and older (10 year old) bovine trabecular bone. Compared to the IT method, the PP analysis more precisely defined the range of microdamage initiation.
In this study, we were able to better define the local stress and strain range of microdamage initiation; however, there were some limitations to this approach that prevented further precision. Although comparison of skeletonized images demonstrated good alignment between micro-CT and histology sections (Fig. 2), perfect registration was not observed throughout sections as some centerlines were 1–3 pixels away from overlapping. These imperfect registration regions were due to artifacts that occurred during histological processing. Histological distortions in the tissue may have occurred from preparation of sections including dehydration, clearing, infiltration, embedding, and sectioning. In addition, any minor misalignment during sectioning increased difficulty in exactly locating 2D histology sections within 3D micro-CT images. More sophisticated techniques such as nonrigid registration using linear or nonlinear transformations may provide improved alignment of bone structures. Another limitation is that micro-CT based FE models used in this study do not capture local heterogeneity in mineralization or microstructural features such as resorption cavities. Resorption cavities in particular act as stress raisers and may play a critical role in microdamage formation [13].
In this study we developed an automated method to correlate microdamage with local stresses and strains. Using a two-dimensional rigid registration algorithm, bone structures from histology and micro-CT imaging were aligned. Once aligned, microdamaged regions detected through fluorescent labeling were spatially correlated with local stresses and strains obtained from micro-CT based finite element analysis. We demonstrated that the range of microdamage initiation is more precisely defined using a pixel-by-pixel technique. Using this approach, our previous finding that trabecular bone from younger bovine samples sustained higher local strains prior to microdamage initiation was even more evident. Current work is focused on applying this technique to human premenopausal and postmenopausal trabecular bone.
Acknowledgment
This work was supported by NIH Grant No. AG027249. This work made use of ERC Shared Facilities supported by the National Science Foundation under Award No. EEC-9731643. The micro-CT system was provided by an NSF Major Research Instrumentation Award (9977551).
Contributor Information
Srinidhi Nagaraja, Woodruff School of Mechanical Engineering, , Georgia Institute of Technology, , Atlanta, GA 30332, , Petit Institute for Bioengineering and Biosciences, , Georgia Institute of Technology, , Atlanta, GA 30332.
Oskar Skrinjar, Coulter Department of Biomedical Engineering, , Georgia Institute of Technology, , Atlanta, GA 30332.
Robert E. Guldberg, Woodruff School of Mechanical Engineering, , Georgia Institute of Technology, , Atlanta, GA 30332;; Petit Institute for Bioengineering and Biosciences, , Georgia Institute of Technology, , Atlanta, GA 30332; Coulter Department of Biomedical Engineering, , Georgia Institute of Technology, , Atlanta, GA 30332 , e-mail: robert.guldberg@me.gatech.edu
References
- [1]. AAOS. Osteoporosis and Bone Health. In: Burden of Musculoskeletal Diseases in the United States: Prevalence, Societal and Economic Cost. 1st ed: American Academy of Orthopaedic Surgeons; 2008, pp. 97–121. [Google Scholar]
- [2]. Keaveny, T. M. , Morgan, E. F. , Niebur, G. I. , and Yeh, O. C. , 2001, “Biomechanics of Trabecular Bone,” Annu. Rev. Biomed. Eng., 3, pp. 307–333. 10.1146/annurev.bioeng.3.1.307 [DOI] [PubMed] [Google Scholar]
- [3]. Van Rietbergen, B. , Weinans, H. , and Huiskes, R. , 1996, “Computational Strategies for Iterative Solutions of Large FEM Applications Employing Voxel Data,” Int. J. Numer. Methods Eng., 39, pp. 2743–2767. [DOI] [Google Scholar]
- [4]. Lee, T. C. , Mohsin, S. , Taylor, D. , Parkesh, R. , Gunnlaugsson, T. , O'Brien, F. J. , Giehl, M. , and Gowin, W. , 2003, “Detecting Microdamage in Bone,” J. Anat., 203, pp. 161–172. 10.1046/j.1469-7580.2003.00211.x [DOI] [PMC free article] [PubMed] [Google Scholar]
- [5]. Lynch, J. A. , Grigoryan, M. , Fierlinger, A. , Guermazi, A. , Zaim, S. , MacLean, D. B. , and Genant, H. K. , 2004, “Measurement of Changes in Trabecular Bone at Fracture Sites Using X-Ray CT and Automated Image Registration and Processing,” J. Orthop. Res., 22, pp. 362–367. 10.1016/S0736-0266(03)00197-9 [DOI] [PubMed] [Google Scholar]
- [6]. Newitt, D. C. , van Rietbergen, B. , and Majumdar, S. , 2002, “Processing and Analysis of In Vivo High-Resolution MR Images of Trabecular Bone for Longitudinal Studies: Reproducibility of Structural Measures and Micro-Finite Element Analysis Derived Mechanical Properties,” Osteoporosis Int., 13, pp. 278–287. 10.1007/s001980200027 [DOI] [PubMed] [Google Scholar]
- [7]. Waarsing, J. H. , Day, J. S. , van der Linden, J. C. , Ederveen, A. G. , Spanjers, C. , De Clerck, N. , Sasov, A. , Verhaar, J. A. , and Weinans, H. , 2004, “Detecting and Tracking Local Changes in the Tibiae of Individual Rats: A Novel Method to Analyse Longitudinal In Vivo Micro-CT Data,” Bone, 34, pp. 163–169. 10.1016/j.bone.2003.08.012 [DOI] [PubMed] [Google Scholar]
- [8]. Nagaraja, S. , Lin, A. S. , and Guldberg, R. E. , 2007, “Age-Related Changes in Trabecular Bone Microdamage Initiation,” Bone, 40, pp. 973–980. 10.1016/j.bone.2006.10.028 [DOI] [PubMed] [Google Scholar]
- [9]. Keaveny, T. M. , Wachtel, E. F. , Ford, C. M. , and Hayes, W. C. , 1994, “Differences Between the Tensile and Compressive Strengths of Bovine Tibial Trabecular Bone Depend on Modulus,” J. Biomech., 27, pp. 1137–1146. 10.1016/0021-9290(94)90054-X [DOI] [PubMed] [Google Scholar]
- [10]. Lee, T. C. , Arthur, T. L. , Gibson, L. J. , and Hayes, W. C. , 2000, “Sequential Labelling of Microdamage in Bone Using Chelating Agents,” J. Orthop. Res., 18, pp. 322–325. 10.1002/jor.1100180222 [DOI] [PubMed] [Google Scholar]
- [11]. O'Brien, F. J. , Taylor, D. , and Lee, T. C. , 2002, “An Improved Labelling Technique for Monitoring Microcrack Growth in Compact Bone,” J. Biomech., 35, pp. 523–526. 10.1016/S0021-9290(01)00200-7 [DOI] [PubMed] [Google Scholar]
- [12]. Van Rietbergen, B. , Weinans, H. , Huiskes, R. , and Odgaard, A. , 1995, “A New Method to Determine Trabecular Bone Elastic Properties and Loading Using Micromechanical Finite-Element Models,” J. Biomech., 28, pp. 69–81. 10.1016/0021-9290(95)80008-5 [DOI] [PubMed] [Google Scholar]
- [13]. McNamara, L. M. , Van der Linden, J. C. , Weinans, H. , and Prendergast, P. J. , 2006, “Stress-Concentrating Effect of Resorption Lacunae in Trabecular Bone,” J. Biomech., 39, pp. 734–741. 10.1016/j.jbiomech.2004.12.027 [DOI] [PubMed] [Google Scholar]


