

Abstract
Background:
This study aimed to investigate the role of aryl hydrocarbon receptor (AhR) and STAT3 gene during the differentiation of cluster of differentiation (CD)4+ T cells into T helper (Th)17 and T regulatory (Treg) cells.
Methods:
First, CD4+ T cells were isolated from the spleen of BALB/c mice. Then, stable CD4+ T cells expressing STAT3 shRNA were constructed. CD4+ T cells were assigned to one of the following treatments: Th17 group: antibodies against CD3 and CD28, 2.5 ng/mL transforming growth factor β (TGF-β)1, 30 ng/mL interleukin (IL)-6, and 30 ng/mL IL-23; 6-formylindolo[3,2-b]carbazole (FICZ) group: antibodies against CD3 and CD28, 2.5 ng/mL TGF-β1, 30 ng/mL IL-6, 30 ng/mL IL-23, and 100 nM FICZ; FICZ + STAT3 RNAi group (shSTAT3 group): antibodies against CD3 and CD28, 2.5 ng/mL TGF-β1, 30 ng/mL IL-6, 30 ng/mL IL-23, 100 nM FICZ, and STAT3 RNAi; naphthoflavone group: antibodies against CD3 and CD28, 2.5 ng/mL TGF-β1, 30 ng/mL IL-6, 30 ng/mL IL-23, and 3 μM naphthoflavone; 5) no antibodies were added in the control group. Later, the proportions of Th17 and Treg cells in each group were measured by flow cytometry; phospho-STAT3 and -STAT5 levels were measured by western blotting; and AhR, STAT3, STAT5, receptor-related orphan nuclear receptor γt (RORγt), FOXP3, T-cell receptor (TCR), CD25, IL-6R, IL-10, and IL-17 mRNA levels were also measured by real-time PCR.
Result:
Th17 cells showed a rise and Treg cells showed a decrease in the FICZ group, but revised in the shSTAT3 group and the naphthoflavone group. Significant differences were observed in CD25, IL-6R, IL-10, and IL-17 mRNA levels among different groups.
Conclusion:
STAT3 may cooperate with AhR to regulate the differentiation of both Th17 and Treg cells.
Keywords: aryl hydrocarbon receptor, CD4+ T cells differentiation, STAT3 gene, Th17 cells, Treg cells
1. Introduction
Naive cluster of differentiation (CD)4+ T cells can differentiate into T helper (Th) cells (e.g., Th1, Th2, and Th17 lineages) and T regulatory (Treg) cells.[1] The former typically expresses interleukin-17 (IL-17),[2] and the latter specifically expresses transcription factor Foxp3[3,4] and the α chain of the IL-2 receptor CD25.[5] Activation of retinoic acid receptor-related orphan nuclear receptor γt (RORγt), a transcription factor, by IL-6 and transforming growth factor β (TGFβ) is considered to be critical for the differentiation into Th17 cells.[6] Zhou et al[7] have further reported that IL-21 and IL-23 pathways are involved in IL-6-programmed Th-17 cell differentiation. Abnormal immune response had been proved to be involved in various inflammatory disease.[8] Thus, it is necessary to investigate the differentiation of CD4+ T cells into Th17 and Treg cells.
The aryl hydrocarbon receptor (AhR) is a transcription factor responding to environmental stimuli.[9] The activation of AhR can induce various toxic effects, such as immune regulation, tumor progression, and cell differentiation.[10] Recent study has shown that AhR can regulate the differentiation of CD4+ T cells,[11] and the differentiation of CD4+ T cells into Th17 or Treg cells depends upon the ligand of AhR.[12] Similarly, Quintana et al[13] have also clarified that AhR regulates the differentiation of both Treg and Th17 cells in a ligand-depending manner in mice, namely activation by its ligand 2,3,7,8-tetrachlorodibenzo-p-dioxin promotes the differentiation of functional Treg cells, whereas activation by 6-formylindolo[3,2-b]carbazole (FICZ) enhances the differentiation of Th17 cells. STAT3 encodes signal transducer and activator of transcription 3, a member of the STAT transcription factor family. Its involvement in various immune function-related biological processes has been confirmed.[14,15] Previously, STAT1 has been reported to negatively regulate the differentiation of inflammatory (Th17) T cell lineage,[16] whereas STAT4 or STAT6 were not.[17] However, it is still unclear whether STAT3 can influence the differentiation of T cells regulated by AhR.
In the present study, we used AhR agonist FICZ and antagonist naphthoflavone to investigate the role of AhR during the differentiation of CD4+ T cells into Th17 and Treg cells, and used RNA interference to uncover the role of STAT3 in this process, with the aim to further understand the mechanisms underlying this process.
2. Materials and methods
2.1. Ethical approval
The animal experiments were approved by the Ethics Committee of Tongji Medical College.
2.2. Isolation of CD4+ T cells
BALB/c mice (SLAC laboratory animals Co., Ltd, Shanghai, China) were sacrificed by cervical dislocation and spleen was taken out, followed by grinding with 2 mL syringe needle in a pre-cooled culture dish until cell suspension was obtained. Then the cell suspension was collected and connective tissue was removed by filtering. Repeat twice until no mass was seen. Next, transfer the cell suspension into 15 centrifuge tube, followed by centrifugation at 1600 rpm for 4 minutes, 4°C (L-500, Xiangyi Centrifuge Co., Ltd, Changsha, China). The precipitate was retained, followed by addition of red cell lysate, and the mixture was then shaken and then allowed to stand for 1 minutes, followed by centrifugation at 1600 rpm for 4 minutes, 4°C (L-500, Xiangyi Centrifuge Co., Ltd, Changsha, China). Then precipitate was retained and precooled phosphate buffered saline (PBS) was added, followed by centrifugation again to collect the precipitate, which was finally prepared into suspension by adding precooled PBS. Next, 1.0 × 10⁸ cells were transferred into a 15 mL BD tube and centrifuged at 1000 rpm 4°C for 5 minutes (L-500, Xiangyi Centrifuge Co., Ltd, Changsha, China). The precipitate was retained and suspended in 5 mL buffer (PBS+3% fetal calf serum), followed by addition of 100 μL of biotin–antibody cocktail. The mixture was then blended and allowed to stand for 45 minutes at 4°C. Finally, 300 μL of buffer and 200 μL anti-biotin MicroBeads were added and mixed, followed by standing at 4°C for 30 minutes. Afterwards, the mixture was centrifuged at 1000 rpm for 5 minutes 4°C (L-500, Xiangyi Centrifuge Co., Ltd, Changsha, China) and the precipitate was collected and resuspended in 500 μL buffer. The suspension was flown into LS column (Miltenyi Biotec, Bergisch Gladbach, Germany) and the filtrate was collected. The column was washed repeatedly to collect the filtrate. The filtrate was diluted, suspended, and finally saved in ice.
2.3. Construction of STAT3 shRNA and transformation into E coli DH5α
The sequence of STAT3 shRNA was TAACTTCAGACCCGTCAACAAATTCAAGAGATTTGTTGACGGGTCTGAAGTTTTTTTTC targeting NM_139276 with reference to Li et al.[18]Escherichia coli DH5α was thaw in ice, followed by incubation on ice after addition of 1 μL of (50 ng) pLKO-1-puro vector carrying STAT3 shRNA. Then, 800 μL of LB medium was added, followed by shaking gently at 37°C for 50 minutes. Afterward, colonies were grown on a plate containing ampicillin to identify whether shRNA was successfully transformed. Next, the successfully transformed bacteria were incubated by shaking culture at 250 r/min for 14 hours and bacterial culture was sent to Sangon Biotech. Co., Ltd (Shanghai, China) for sequencing.
2.4. Construction of stable CD4+ T cells expressing STAT3 shRNA
A total of 293 T cells were seeded at 2.5 × 10⁶ per dish (60 × 15 mm) in DMEM media without antibiotics and incubated until the cells grown to 80% confluency. Lentiviral particles were constructed by mixing 4 μg of pLKO-1-puro shRNA vector, 3 μg of psPAX2 package plasmid, and 1 μg of envelope plasmid pMD2.G in 600 μL opti-MEM for 5 minutes, followed by addition of 20 μL of lipofectamin 2000 for 20 minutes. Then, the mixture was added into the dish and the cells were then incubated in 5% CO2 at 37°C and 100% humidity. After 6 hours, the mixture was transferred into complete medium. After 48 h, the supernatant was collected for the first time; after incubation for another 24 hours following addition of 4 mL fresh complete medium, the supernatant was collected for the second time. The supernatant was mixed together and filtered, followed by concentration and conservation at –80°C.
2.5. Transfection of CD4+ T cells with STAT3 shRNAs and validation of STAT3 knockdown
First, 1 × 10⁵ CD4+ T cells were seeded in a 24-well plate added with RPMI 1640 media. Then, lentiviral particle solution was added, together with polybrene to obtain a final concentration of 8 μg/mL, followed by incubation for 2 hours in 5% CO2 at 37°C and 100% humidity (SERIES II, Thermo Fisher Scientific Inc., MA). Afterwards, centrifugation was performed at 1000 rpm for 10 minutes (L-500, Xiangyi Centrifuge Co.,Ltd, Changsha, China). The precipitate was obtained, followed by addition of 10% fresh fetal bovine serum and incubation for another 72 hours.
Total RNA was extracted from the CD4+ T cells expressing STAT3 shRNAs and the control CD4+ T cells, respectively. Reverse transcription was carried out using a 10 μL system containing 2 μL 5 × PrimeScript RT Master Mix, 2 μL total RNA and RNase Free dH2O added to the final 10 μL. Quantitative real-time PCR was performed in a 20 μL system containing 10 μL SYBR Green Master Mix (2×), 0.4 μL of forward primer and reverse primer each, and cDNA and RNase free dH2O added to the final 20 μL on ViiA7 instrument (Thermo Fisher Scientific Inc., MA). The protocol consisted of an initial annealing at 95°C for 10 minutes, followed by 40 cycles of 95°C for 15 seconds, 60 °C for 60 seconds, and final dissociation of 95°C for 15 seconds, 60°C for 60 seconds, and 95°C for 15 seconds.
2.6. Cell grouping and treatments
CD4+ T cells were seeded in a 12-well plate and then assigned to one of the following treatment: Th17 group: antibodies against CD3 and CD28, 2.5 ng/mL TGF-β1, 30 ng/mL IL-6, and 30 ng/mL IL-23; FICZ (AhR agonist) group: antibodies against CD3 and CD28, 2.5 ng/mL TGF-β1, 30 ng/mL IL-6, 30 ng/mL IL-23, and 100 nM FICZ; FICZ+STAT3 RNAi group (shSTAT3 group): antibodies against CD3 and CD28, 2.5 ng/mL TGF-β1, 30 ng/mL IL-6, 30 ng/mL IL-23, 100 nM FICZ, and STAT3 RNAi; naphthoflavone (AhR antagonist) group: antibodies against CD3 and CD28, 2.5 ng/mL TGF-β1, 30 ng/mL IL-6, 30 ng/mL IL-23, and 3 μM naphthoflavone; no antibodies were added in the control group. Each was treatment was maintained for 4 days, followed by addition of 25 ng/mL of PMA, 1 μg/mL of ionomycin, and 10 μg/mL brefeldin A. Next, the cells in each group were stained simultaneously with anti-CD4-FITC and anti-IL-17-PE or anti-Foxp3-PE (BD Biosciences, San Jose, CA), and the percentage of positive cells in each group was measured by flow cytometry (FACSCalibur, BD Biosciences, San Jose, CA).
2.7. Measurement of phospho-STAT3 (p-STAT3) and phospho-STAT5 expression by western blot assay
Cell culture in each group was first treated with 1000 μL containing protease inhibitor and phenylmethylsulfonyl fluoride. Then, the lysate was centrifugated at 12,000 rpm for 10 minutes (L-500, Xiangyi Centrifuge Co., Ltd, Changsha, China). The supernatant was retained, followed by measurement of protein concentration using the bicinchoninic acid method. Next, the protein extract was resolved on a 10% sodium dodecyl sulfate polyacrylamide gel electrophoresis, and blotted onto a polyvinylidenefluoride film. After blocking at 37°C with 5% milk in PBS containing 0.1% Tween-20 for 2 hours, the film was incubated with aniti-p-STAT3 antibodies (1:2000, Abcam (Hong Kong) Ltd, China), anti-p-STAT5 antibodies (1:1000, Abcam (Hong Kong) Ltd, China), and anti-GAPDH antibodies (1:1000, Abcam (Hong Kong) Ltd, China) overnight. After extensive washing, the film was incubated with appropriate secondary antibodies (1:10,000, Jackson ImmunoResearch Laboratories, West Grove, PA) for 2 hours, followed by development using the electrogenerated chemiluminescence method (Millipore, Billerica, MA).
2.8. Measurement of mRNA expression levels of AhR, STAT3, STAT5, RORγt, FOXP3, TCR, CD25, IL-6R, IL-10, and IL-17 by real-time PCR
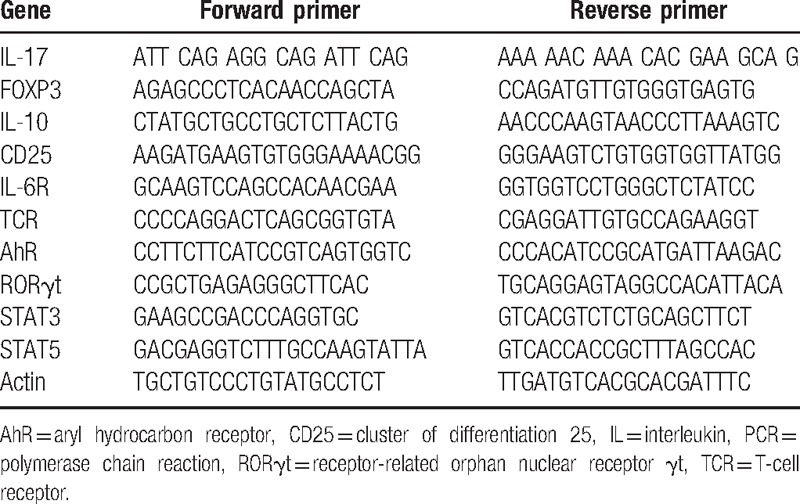
Total RNA was extracted from in each group. Next, reverse transcription and quantitative real-time PCR was performed as described above. AhR, STAT3, STAT5, RORγt, FOXP3, T-cell receptor (TCR), CD25, IL-6R, IL-10, and IL-17 genes were amplified using specific oligonucleotide primers and house-keeping gene, ß-actin, was used as internal standard. The sequences of the primers described in Table 1. Data were normalized with β-actin gene. Relative quantification and calculations were done with the comparative threshold (Ct) cycle method (2−ΔΔCt).
Table 1.
The primers used in the real-time PCR.
2.9. Statistical analysis
SPSS17.0 was used for the statistical analysis. Data were represented as mean ± SD. One-way ANOVA was used for comparison between groups, and LSD (least-significant difference) method was used for multiple comparison. P <.05 was considered to be statistically significant.
3. Result
3.1. Validation of STAT3 knockdown
As shown in Fig. 1, the STAT3 mRNA level in the CD4+ T cells expressing STAT3 shRNA was markedly lower than that in the control cells (P <.01), thus, STAT3 knockdown was considered successful.
Figure 1.
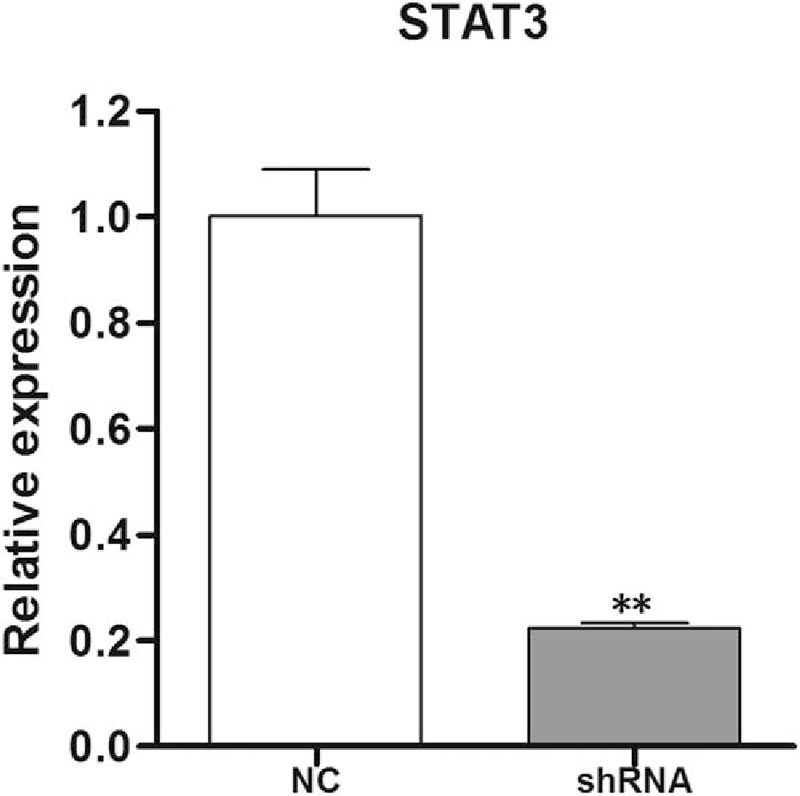
Validation of STAT3 knockdown in the CD4+ T cells expressing STAT3 shRNAs. The mRNA level of STAT3 was detected in CD4+ T cells expressing STAT3 shRNAs (shRNA) and the control CD4+ T cells (NC) by real-time PCR. Three independent experiments were conducted. ∗∗P <.01 versus NC. CD = cluster of differentiation, PCR = polymerase chain reaction.
3.2. Effects of different treatments on the percentages of Th17 and Treg cells
The percentages of Th17 and Treg cells were detected by flow cytometry assay (Fig. 2). Compared with the control group, the percentage of Th17 cells was significantly increased in the Th17 and FICZ groups (P <.05), and the percentage of Th17 cells was remarkably higher in the FICZ group than that in the Th17 group (P <.05). After treatment with shSTAT3 or naphthoflavone, the percentage of Th17 cells was obviously reduced compared with the Th17 or FICZ groups (P <.05). Meanwhile, the percentage of Treg cells was markedly decreased in the FICZ group compared with the Th17 group, whereas increased in shSTAT3 group and naphthoflavone group, respectively (P <.05).
Figure 2.
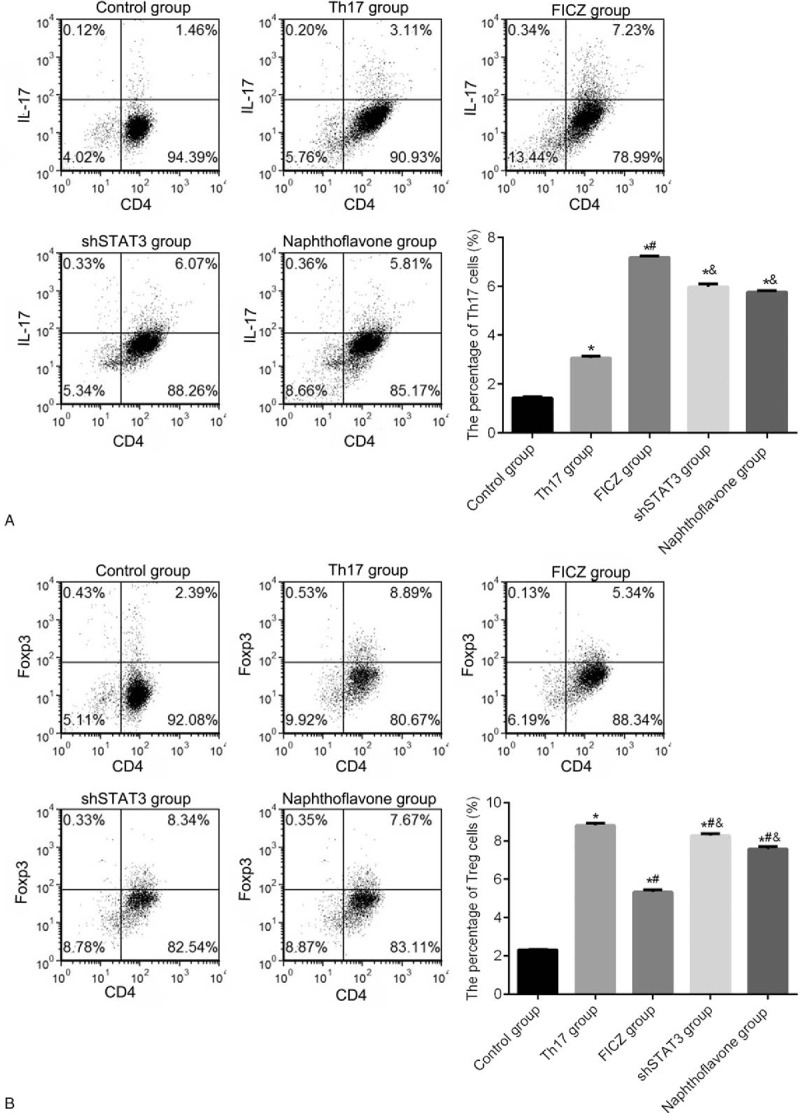
AhR activation and STAT3 knockdown influenced the differentiation of both Th17 and Treg cells. (A) Proportion of Th17 cells in the control, Th17, FICZ, naphthoflavone, and shSTAT3 groups using the flow cytometry assay. (B) Proportion of Treg cells in the control, Th17, FICZ, naphthoflavone, and shSTAT3 groups using the flow cytometry assay. Three independent experiments were conducted. ∗P <.05 versus control group; #P <.05 versus Th17 group; &P <.05 versus FICZ group; $P <.05 versus shSTAT3 group. AhR = aryl hydrocarbon receptor, IL = interleukin, FICZ = 6-formylindolo[3,2-b]carbazole, Th17 = T helper 17, Treg = T regulatory.
3.3. Comparison of p-STAT3 and p-STAT5 protein levels
Cells in the control group had a lower p-STAT3 protein level than that in either Th17 or FICZ group (P <.01, Fig. 3), whereas the p-STAT3 level was significantly reduced in the shSTAT3 group and naphthoflavone group compared with the control, Th17, or FICZ groups (P <.01, Fig. 3). Moreover, the p-STAT3 level was obviously lower in the naphthoflavone group than that in the shSTAT3 group (P <.01, Fig. 3). Compared with the control and Th17 groups, p-STAT5 protein level was markedly increased in the FICZ, naphthoflavone, and shSTAT3 groups, whereas cells in the naphthoflavone group had a higher p-STAT5 level than that in the FICZ group (P <.01, Fig. 3). In addition, the level of p-STAT5 was remarkably decreased in the shSTAT3 group compared with the naphthoflavone group (P <.01, Fig. 3).
Figure 3.
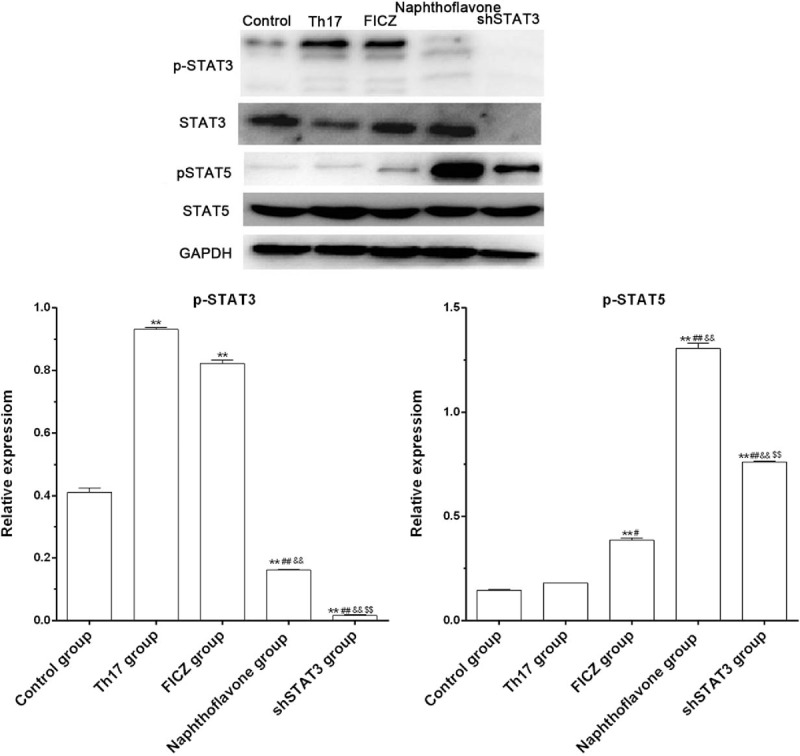
AhR activation influenced the expressions of phospho-STAT3 (p-STAT3) and p-STAT5 in CD4+ T cells. The protein expressions of p-STAT3 and p-STAT5 in the control, Th17, FICZ, naphthoflavone, and shSTAT3 groups by the western blot assay. Three independent experiments were conducted. ∗P <.05 versus control group; #P <.05 versus Th17 group; &P <.05 versus FICZ group; $P <.05 versus shSTAT3 group. AhR = aryl hydrocarbon receptor, CD = cluster of differentiation, FICZ = 6-formylindolo[3,2-b]carbazole, Th17 = T helper 17.
3.4. Expression of AhR, STAT3, STAT5, RORγt, FOXP3, TCR, CD25, IL-6R, IL-10, and IL-17 mRNA levels
The real-time PCR results revealed that there was no significant difference in the levels of AhR, STAT3, STAT5, RORγt, TCR, and IL-10 mRNA among these different groups (Fig. 4). Compared with the control group, CD25 had a significantly higher mRNA level in each of the other groups (P <.01, Fig. 4). The mRNA level of IL-6R was significantly increased in the naphthoflavone and shSTAT3 groups compared with the control, Th17, or FICZ groups (P <.01, Fig. 4). Compared with the control group, IL-17 level was obviously increased in the other four groups (P <.01, Fig. 4), whereas cells in the naphthoflavone and shSTAT3 groups had lower level of IL-17 than that in the FICZ group (P <.01, Fig. 4). FoxP3 had the highest level in the shSTAT3 group, each being significantly higher than that in the other groups (P <.01, Fig. 4).
Figure 4.
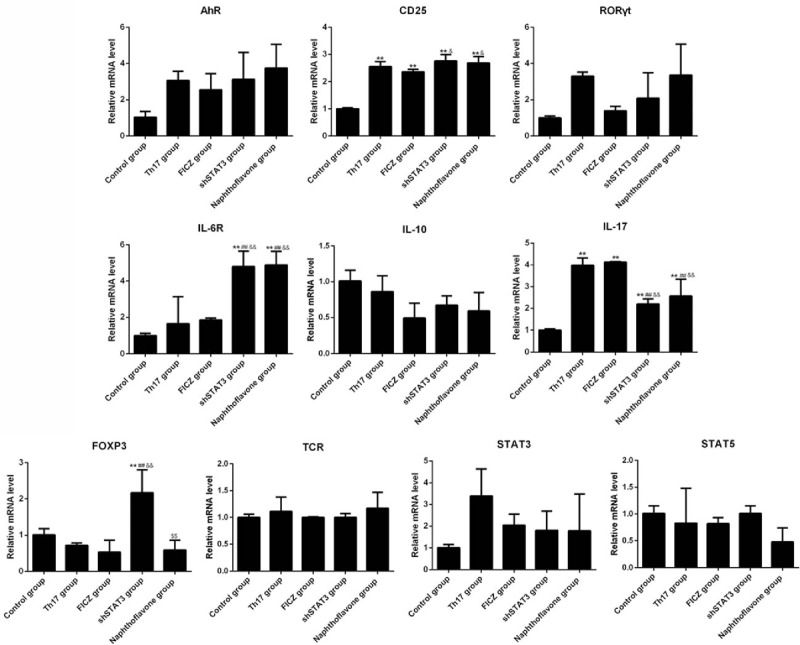
AhR activation and STAT3 knockdown influenced the mRNA levels of CD25, IL-6R, IL-17, and FOXP3 in CD4+ T cells. The mRNA levels of differentiation related cytokines in the control, Th17, FICZ, naphthoflavone, and shSTAT3 groups by real-time PCR. Three independent experiments were conducted. ∗P <.05 versus control group; #P <.05 versus Th17 group; &P <.05 versus FICZ group; $P <.05 versus shSTAT3 group. AhR = aryl hydrocarbon receptor, CD = cluster of differentiation, FICZ = 6-formylindolo[3,2-b]carbazole, IL = interleukin, PCR = polymerase chain reaction, RORγt = retinoic acid receptor–related orphan nuclear receptor γt, TCR = T-cell receptor, Th17 = T helper 17.
4. Discussion
In the present study, we investigated the role of AhR and STAT3 during the differentiation of CD4+ T cells into Th17 and Treg cells.
Here, either Th17 cells percentage was increased, whereas Treg cells percentage was decreased in the group treated with AhR agonist FICZ, especially the Th17 cells proportion, indicating that AhR activation greatly accelerates the differentiation of Th17 cells. As either cell proportion was decreased when AhR antagonist naphthoflavone was used to treat CD4+ T cells, indicating that AhR activation is necessary for the differentiation of both cells, which agrees with most previous findings. Veldhoen et al[19,20] have confirmed that AhR promotes the differentiation of Th17 cells. Apetoh et al[21] have also reported that AhR is in synergy with c-Maf in promoting the development of type 1 Treg cells. However, Quintana et al[13] have implied a more complex role of AhR during this differentiation process. They found that when AhR was activated by its ligand 2,3,7,8-tetrachlorodibenzo-p-dioxin, the differentiation of functional Treg cells was promoted, whereas when activated by FICZ, Treg cell development was suppressed and Th17 cell differentiation was enhanced. As the roles of different AhR ligands were not explored here, we preliminarily concluded that AhR activation is necessary for the differentiation of Th17 cells.
Noticeably, when the gene STAT3 in CD4+ T cells was knockdown by RNA interference method in the group treated with AhR agonist FICZ, the percentage of either Th17 cells showed a sharp decrease, whereas Treg cells showed a significant increase as compared to the FICZ group, indicating that this gene is indispensable for the functioning of AhR in the differentiation of CD4+ T cells. The case was similar in the naphthoflavone group. This gene has been assumed to have a role in IL-27-mediated proliferation of CD4+ T cells.[22] Additionally, it has been reported to be activated by IL-6R/gp130 to exert a proinflammatory effect and by IL-10R to exert an anti-inflammatory effect.[23] Here, IL-6R had a significantly higher level in the shSTAT3 group and naphthoflavone group; however, no significant differences were observed in STAT3 mRNA levels among different groups. Thus, the relationship between STAT3 and IL-6R is unclear.
Further western blotting showed higher phospho-STAT3 levels in the Th17 and FICZ groups compared with the control group, as well as lower phospho-STAT3 levels in the naphthoflavone group and shSTAT3 group, especially in the shSTAT3 group, confirming the importance of phospho-STAT3 in the differentiation of CD4+ T cells, as there was an opposite trend in the concentration between phospho-STAT3 and phospho-STAT5 levels.
Taken together, STAT3 may cooperate with AhR to regulate the differentiation of Th17 and Treg cells. However, the mRNA levels of various interleukin and other factors showed no significant differences among different groups, thus it is hard to estimate their roles in this process, which should be further addressed.
Footnotes
Abbreviations: AhR = Aryl hydrocarbon receptor, CD = cluster of differentiation, FICZ = 6-formylindolo[3,2-b]carbazole, Foxp3 = forkhead box P3, IL-17 = interleukin-17, PBS = phosphate buffered saline, RORγt = retinoic acid receptor–related orphan nuclear receptor γt, STAT3 = signal transducer and activator of transcription 3, TGFβ = transforming growth factor β, Th = T helper, Treg = T regulatory.
XL and HH are co-first authors.
Funding: This work was supported by the National Nature Science Foundation of China (No. 81273908).
The authors have no conflicts of interest to disclose.
References
- [1].Constant S, Pfeiffer C, Woodard A, et al. Extent of T cell receptor ligation can determine the functional differentiation of naive CD4+ T cells. J Exp Med 1995;182:1591–6. [DOI] [PMC free article] [PubMed] [Google Scholar]
- [2].Korn T, Bettelli E, Oukka M, et al. IL-17 and Th17 cells. Ann Rev Immunol 2009;27:485–517. [DOI] [PubMed] [Google Scholar]
- [3].Fontenot JD, Gavin MA, Rudensky AY. Foxp3 programs the development and function of CD4+ CD25+ regulatory T cells. Nat Immunol 2003;4:330–6. [DOI] [PubMed] [Google Scholar]
- [4].Hori S, Nomura T, Sakaguchi S. Control of regulatory T cell development by the transcription factor Foxp3. Science 2003;299:1057–61. [DOI] [PubMed] [Google Scholar]
- [5].Sakaguchi S, Sakaguchi N, Asano M, et al. Immunologic self-tolerance maintained by activated T cells expressing IL-2 receptor alpha-chains (CD25). Breakdown of a single mechanism of self-tolerance causes various autoimmune diseases. J Immunol 1995;155:1151–64. [PubMed] [Google Scholar]
- [6].Ivanov II, McKenzie BS, Zhou L, et al. The orphan nuclear receptor RORγt directs the differentiation program of proinflammatory IL-17+ T helper cells. Cell 2006;126:1121–33. [DOI] [PubMed] [Google Scholar]
- [7].Zhou L, Ivanov II, Spolski R, et al. IL-6 programs TH-17 cell differentiation by promoting sequential engagement of the IL-21 and IL-23 pathways. Nat Immunol 2007;8:967–74. [DOI] [PubMed] [Google Scholar]
- [8].Ricklin D, Lambris JD. Complement in immune and inflammatory disorders: pathophysiological mechanisms. J Immunol 2013;190:3831–8. [DOI] [PMC free article] [PubMed] [Google Scholar]
- [9].Stockinger B, Meglio PD, Gialitakis M, et al. The aryl hydrocarbon receptor: multitasking in the immune system. Ann Rev Immunol 2014;32:403–32. [DOI] [PubMed] [Google Scholar]
- [10].Puga A, Tomlinson CR, Xia Y. Ah receptor signals cross-talk with multiple developmental pathways. Biochem Pharmacol 2005;69:199–207. [DOI] [PubMed] [Google Scholar]
- [11].Marshall NB, Kerkvliet NI. Dioxin and immune regulation: emerging role of aryl hydrocarbon receptor in the generation of regulatory T cells. Ann N Y Acad Sci 2010;1183:25–37. [DOI] [PMC free article] [PubMed] [Google Scholar]
- [12].Quintana FJ, Basso AS, Iglesias AH, et al. “Control of T(reg) and T(H)17 cell differentiation by the aryl hydrocarbon receptor”. Nature 2008;453:65–71. [DOI] [PubMed] [Google Scholar]
- [13].Quintana FJ, Basso AS, Iglesias AH, et al. Control of Treg and TH17 cell differentiation by the aryl hydrocarbon receptor. Nature 2008;453:65–71. [DOI] [PubMed] [Google Scholar]
- [14].Laouar Y, Welte T, Fu X-Y, et al. STAT3 is required for Flt3L-dependent dendritic cell differentiation. Immunity 2003;19:903–12. [DOI] [PubMed] [Google Scholar]
- [15].Panopoulos AD, Zhang L, Snow JW, et al. STAT3 governs distinct pathways in emergency granulopoiesis and mature neutrophils. Blood 2006;108:3682–90. [DOI] [PMC free article] [PubMed] [Google Scholar]
- [16].Harrington LE, Hatton RD, Mangan PR, et al. Interleukin 17–producing CD4+ effector T cells develop via a lineage distinct from the T helper type 1 and 2 lineages. Nat Immunol 2005;6:1123–32. [DOI] [PubMed] [Google Scholar]
- [17].Park H, Li Z, Yang XO, et al. A distinct lineage of CD4 T cells regulates tissue inflammation by producing interleukin 17. Nat Immunol 2005;6:1133–41. [DOI] [PMC free article] [PubMed] [Google Scholar]
- [18].Li G-H, Wei H, Lv S-Q, et al. Knockdown of STAT3 expression by RNAi suppresses growth and induces apoptosis and differentiation in glioblastoma stem cells. Int J Oncol 2010;37:103–10. [PubMed] [Google Scholar]
- [19].Veldhoen M, Hirota K, Christensen J, et al. Natural agonists for aryl hydrocarbon receptor in culture medium are essential for optimal differentiation of Th17 T cells. J Exp Med 2009;206:43–9. [DOI] [PMC free article] [PubMed] [Google Scholar]
- [20].Veldhoen M, Hirota K, Westendorf AM, et al. The aryl hydrocarbon receptor links TH17-cell-mediated autoimmunity to environmental toxins. Nature 2008;453:106–9. [DOI] [PubMed] [Google Scholar]
- [21].Apetoh L, Quintana FJ, Pot C, et al. The aryl hydrocarbon receptor interacts with c-Maf to promote the differentiation of type 1 regulatory T cells induced by IL-27. Nat Immunol 2010;11:854–61. [DOI] [PMC free article] [PubMed] [Google Scholar]
- [22].Kamiya S, Owaki T, Morishima N, et al. An indispensable role for STAT1 in IL-27-induced T-bet expression but not proliferation of naive CD4+ T cells. J Immunol 2004;173:3871–7. [DOI] [PubMed] [Google Scholar]
- [23].Yoshimura T, Takeda A, Hamano S, et al. Two-sided roles of IL-27: induction of Th1 differentiation on naive CD4+ T cells versus suppression of proinflammatory cytokine production including IL-23-induced IL-17 on activated CD4+ T cells partially through STAT3-dependent mechanism. J Immunol 2006;177:5377–85. [DOI] [PubMed] [Google Scholar]