Supplemental Digital Content is available in the text
Keywords: classification model, functional pathways, lung adenocarcinoma, prediction
Abstract
We aimed to find some specific pathways that can be used to predict the stage of lung adenocarcinoma.
RNA-Seq expression profile data and clinical data of lung adenocarcinoma (stage I [37], stage II 161], stage III [75], and stage IV [45]) were obtained from the TCGA dataset. The differentially expressed genes were merged, correlation coefficient matrix between genes was constructed with correlation analysis, and unsupervised clustering was carried out with hierarchical clustering method. The specific coexpression network in every stage was constructed with cytoscape software. Kyoto Encyclopedia of Genes and Genomes pathway enrichment analysis was performed with KOBAS database and Fisher exact test. Euclidean distance algorithm was used to calculate total deviation score. The diagnostic model was constructed with SVM algorithm.
Eighteen specific genes were obtained by getting intersection of 4 group differentially expressed genes. Ten significantly enriched pathways were obtained. In the distribution map of 10 pathways score in different groups, degrees that sample groups deviated from the normal level were as follows: stage I < stage II < stage III < stage IV. The pathway score of 4 stages exhibited linear change in some pathways, and the score of 1 or 2 stages were significantly different from the rest stages in some pathways. There was significant difference between dead and alive for these pathways except thyroid hormone signaling pathway.
Those 10 pathways are associated with the development of lung adenocarcinoma and may be able to predict different stages of it. Furthermore, these pathways except thyroid hormone signaling pathway may be able to predict the prognosis.
1. Introduction
Lung adenocarcinoma, the most common subtype of nonsmall cell lung cancer, is the leading cause of cancer-related death worldwide.[1,2] It is responsible for more than 500,000 deaths annually worldwide.[2] The all-stage 5-year survival rate for lung cancer is only 15% despite of some improvements in therapeutic method.[3,4] It is reported that tumor, node, metastasis stage is the most important factor to predict the prognosis in lung cancer, including lung adenocarcinoma.[5] In spite of the complete resection by lymph node dissection, the survival rates for the lung adenocarcinoma patients were 73% (stage IA) and 58% (stage IB).[6] Thus, it is necessary and important to identify patients with lung adenocarcinoma in early stage, and then implement appropriate treatments.
Understanding of the molecular mechanisms underlying lung adenocarcinoma may provide good options for the identification of patients with lung adenocarcinoma. Takeuchi et al[7] indicated that transcription termination factor, RNA polymerase I was a marker for lung adenocarcinoma. Yoshizawa et al[8] believed that molecular testing for epidermal growth factor receptor and kirsten rat sarcoma viral oncogene homolog mutations was helpful for predicting prognosis among patients with resectable lung cancer. Furthermore, 1 study suggested that multiple therapies targeted against alterations in the RTK/RAS/RAF pathway advanced the treatment of lung adenocarcinoma.[9] Inhibition of the Notch pathway may be an appropriate target for the treatment of lung adenocarcinoma.[10] Besides, some drugs play roles in lung adenocarcinoma via some specific pathways. Such as, curcumin can induce the autophagy of lung adenocarcinoma via AMP-activated protein kinase signaling pathway, and angiotensin-(1–7) inhibits the migration and invasion of A549 human lung adenocarcinoma cells via inactivation of the phosphatidylinositol 3-kinase/Akt and mitogen-activated protein kinase signaling pathways.[11,12] Some important pathways associated with lung adenocarcinoma have been researched, but that is not enough to clarify the molecular mechanisms of this disease.
In our present study, we used RNA-Seq expression profile data and clinical data of lung adenocarcinoma to perform gene correlation analysis, coexpression network analysis, and pathway enrichment analysis. Furthermore, classification model was constructed. We aimed to find some specific pathways that can be used to predict the stage of lung adenocarcinoma.
2. Materials and methods
2.1. Data remodeling and grouping
RNA-Seq expression profile data (LUAD_rnaseqv2__illuminahiseq_rnaseqv2.txt) and clinical data (nationwidechildrens.org_clinical_patient_luad.txt) of lung adenocarcinoma were obtained from the TCGA dataset. The platform for expression profile data was illuminahiseq_rnaseqv2 Level 3. The expression profile data samples were grouped into stage I, stage II, stage III, and stage IV based on clinical information. The sample size was 37, 161, 75, and 45 for stage I, stage II, stage III, and stage IV, respectively.
Our present study was a secondary analysis of RNA-Seq expression profile data downloaded from TCGA database. Thus, the ethical approval was not necessary.
2.2. Data normalization
The stage I was used as control group, and the mean and standard deviation of each gene in the control group were calculated. Then, Z-score normalization[13] for all samples was performed, and the expressions of genes in the samples were subject to standardized normal distribution with mean value = 0 and the variance = 1.
2.3. Gene correlation analysis
We performed difference test for any 2 different stage lung adenocarcinoma samples by using Student t test, and the significant P value is set to .01. The genes differentially expressed compared with other stage were set as specific genes of this stage. The interaction between genes was changed in the process of lung adenocarcinoma development from one stage to next stage. The 2 interrelated genes have common biological effect in a nondisease state, cooperate with each other in biological terms, and show coexpression relationship on the expression level.[14] In the disease state, the function of genes is abnormal, and subsequently this coexpression relationship will be changed. Thus, we examined the expression correlation of genes in every disease state with Pearson correlation coefficient. It was considered as positive correlation when correlation coefficient above 0.5 and negative correlation when correlation coefficient below −0.5.
Then, all the differentially expressed genes were merged, correlation coefficient matrix between genes was constructed with correlation analysis, and unsupervised clustering of samples and genes was carried out with hierarchical clustering method (hclust function in R package).[15]
2.4. Coexpression network analysis
The specific network in every stage was constructed based on the coexpression relationship between genes with cytoscape software, and there were edges between genes if coexpression relationship existed between 2 genes. We analyzed coexpression network by average shortest path length (ASLP), betweenness coefficient (BC), clustering coefficient (CC), degree, eccentricity (EC), and topological coefficient (TC). ASLP measured the distance between any 2 nodes in the network, and the mean value of distance set was obtained. The shorter the ASLP was, more closer the network was, and the higher the efficiency was. BC was used to assess the connected property of other gene pass through 1 gene. The higher the BC was the more obvious the roles of this gene as bridge. Degree was the number of edges connected to a node. The higher the degree was, the more obvious the proximity relationship of nodes was, and the higher the importance was. EC was the degree of node from the network core. The higher the EC was, the looser the network was. TC assessed the modularity of the network. Higher TC indicated more functional specificity, and lower TC indicated deficiency of functional specificity. If the edge of network was missing (the coexpression relationship was lost), ASLP, BC, CC, degree, EC, and TC would decrease, and the transmission efficiency of network signal would decrease.
2.5. Pathway enrichment analysis
Students t test was performed for any 2 groups, and genes differentially expressed in any 2 groups were regarded as specific gene of this group (P = .01). We merged 4 group specific genes and took the union to carry out the functional analysis. Kyoto Encyclopedia of Genes and Genomes pathway enrichment analysis was performed with KOBAS database and Fisher exact test.[16]
2.6. Functional pathway score
The genes that are functionally related to each other were enriched in the same pathway. We used Euclidean distance algorithm[17] to calculate total deviation score.
 |
The P pathway contains n enrichment genes, mean is expression mean of any gene (Gi) in the stage I group. Higher score (P) suggests that the pathway is obviously deviate from the normal level; lower score (P) suggests that the pathway is close to the normal level of stage I group.
2.7. Construction of classification model
Support vector machines, a supervised machine learning algorithm, can calculate the geometric hyperplane by combining characteristics in multidimensional data, and achieve the greatest degree of classification for 2 groups.[18] The diagnostic model was constructed with support vector machines algorithm, and pathway deviation score of every sample was regarded as characteristic value. The stage I and stage II were combined into early benign group, and stage IV and stage III were combined into advanced malignant group, and the risks were predicted for 2 combined samples. Parameter is linear kernel, penalty coefficient = 1, and gamma = 0. Receiver-operating characteristic (ROC) curve was drawn and classification efficiency of model was assessed with precision, recall, f1-score, and 5-fold cross-validation.
2.8. Correlation between the identified 10 pathway and patients’ prognosis
In order to further verify the identified 10 pathway and predict patients’ prognosis, we compared the correlation between the pathway and patients’ prognosis.
3. Results
3.1. Gene correlation analysis
Totally 18 specific genes were obtained by getting intersection of 4 group differentially expressed genes. The heat map for stage I, stage II, stage III, and stage IV (supplement Fig. 1) showed that there were significant correlations between the 18 genes and formed significant correlation module. These positively related genes or negatively related genes were not completely consistent in different stage, which suggests that the expression correlation between genes was changed with the development of lung adenocarcinoma. The change of expression correlation might be the reason of functional difference.
The results of hierarchical clustering (supplement Fig. 2) showed that almost all of the stage III and stage IV samples were clustered together, and stage I and stage II samples were clustered together. Thus, we concluded that there was significant difference among sample groups of different risks at the molecular level, and early benign group (stage I–stage II) samples tended to have higher similarity and advanced malignant group (stage III–stage IV) samples tended to have higher similarity.
3.2. Coexpression network analysis
The coexpression networks for 4 stages are shown in Fig. 1A–D. The results of network analysis are shown in Fig. 2. From stage I to stage IV, ASLP gradually increased, CC and degree gradually decreased, and there was no significant difference for BC, EC, and TC. The increase of ASLP indicated that in the whole network the average distance between any 2 nodes was increased, the network connectivity was decreased, and the signal transmission efficiency was reduced. The decrease of CC and degree indicated that the degree of network dispersion was increased, and the structure was loose.
Figure 1.
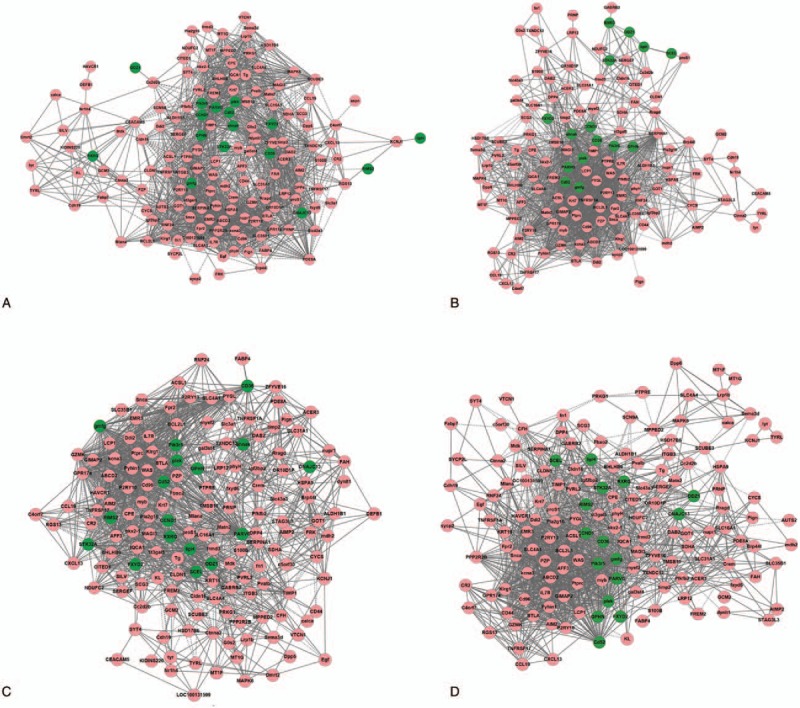
The coexpression networks for 4 stages (A: stage I, B: stage II, C: stage III, and D: stage IV).
Figure 2.
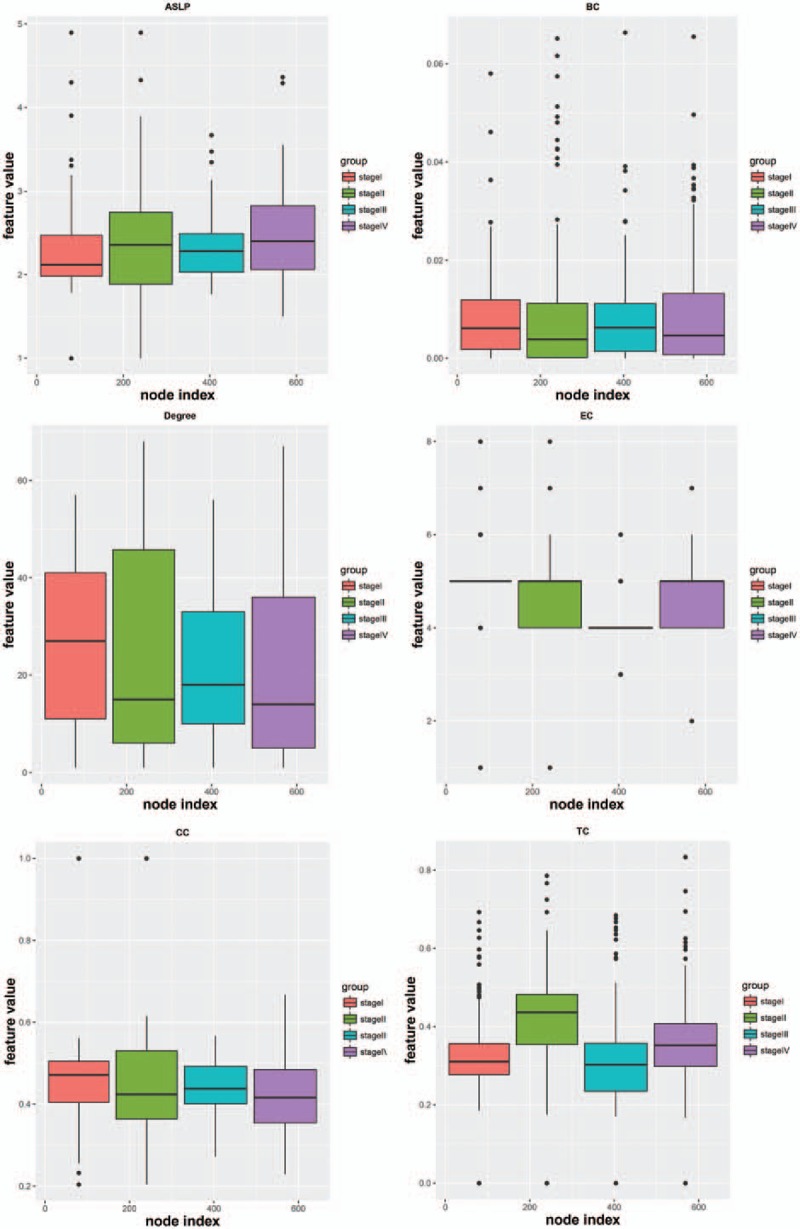
The results of network analysis.
3.3. Pathway enrichment analysis
Totally 10 significantly enriched pathways are obtained (Table 1). It showed that genes associated with malignant degree of lung adenocarcinoma were enriched in mineral absorption, aldosterone-regulated sodium reabsorption, adipocytokine signaling pathway, and thyroid hormone signaling pathway, in addition to several cancer pathways (small cell lung cancer, endometrial cancer, nonsmall cell lung cancer, and pancreatic cancer). It indicated that lack of trace elements, sodium ion concentration, adipocyte activity, as well as changes in hormone levels were important factors affecting different malignant progression of lung adenocarcinoma.
Table 1.
Significantly enriched pathways by differentially expressed genes.

3.4. Functional pathway score
Figure 3 is the distribution map of 10 pathways score in different groups. From the deviation level, degrees that sample groups deviated from the normal level were as follows: stage I < stage II < stage III < stage IV.
Figure 3.
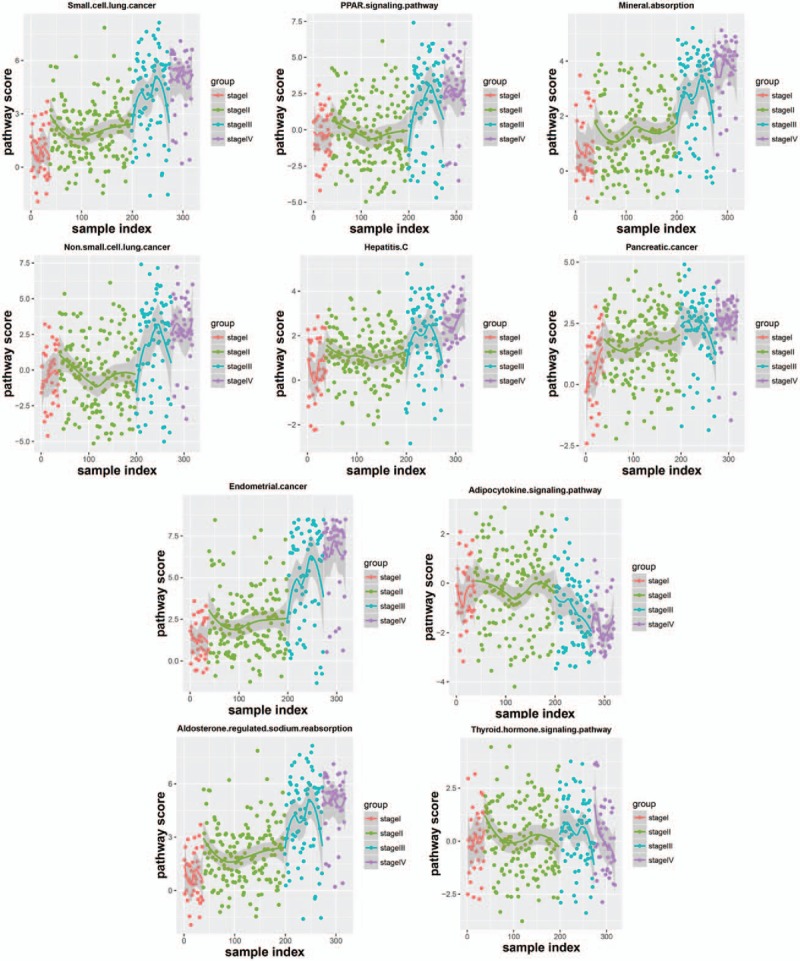
The distribution map of 10 pathways score in different groups.
The boxplot of 10 pathway score in different stages (Fig. 4) showed that the score of 4 stages exhibited linear change in some pathways, and the score of 1 or 2 stages were significantly different from the rest stages in some pathways. It demonstrated that these pathways showed different functional level in different stage, and these pathways could be used to classify lung adenocarcinoma samples of different malignancy degrees.
Figure 4.
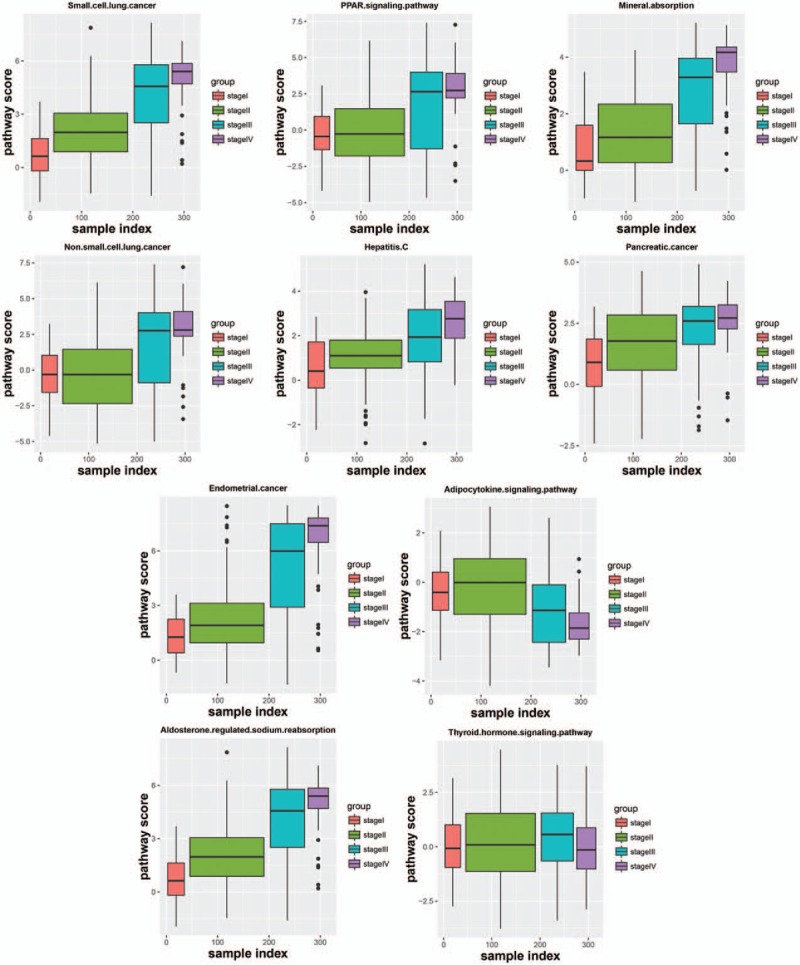
The boxplot of 10 pathway score in different stages.
3.5. Construction of classification model
The ROC curve is shown in Fig. 5. The mean ROC was 0.84. Lung adenocarcinoma with different disease stage could be distinguished effectively by using stage specific pathway of lung adenocarcinoma as characteristic. Using stage specific pathway of lung adenocarcinoma as characteristic had more advantages compared with serological markers or genes as characteristic, such as pathways could show synergistic action of multiple associated genes systematically and had more robustness. Classification reports for early stage and late stage are shown in Table 2. The average precision and recall for early stage was both higher than that for late stage, but the prediction effect for early stage alone was not as good as that for late stage. It suggested that our model had higher sensitivity for predicting patients with advanced lung adenocarcinoma. At the same time, it explained again that these10 pathways had significantly different functional levels in different lung adenocarcinoma stage. Furthermore, these pathways might provide new ideas for explaining risk and prognosis of lung adenocarcinoma at different stages and realization of personalized therapy.
Figure 5.
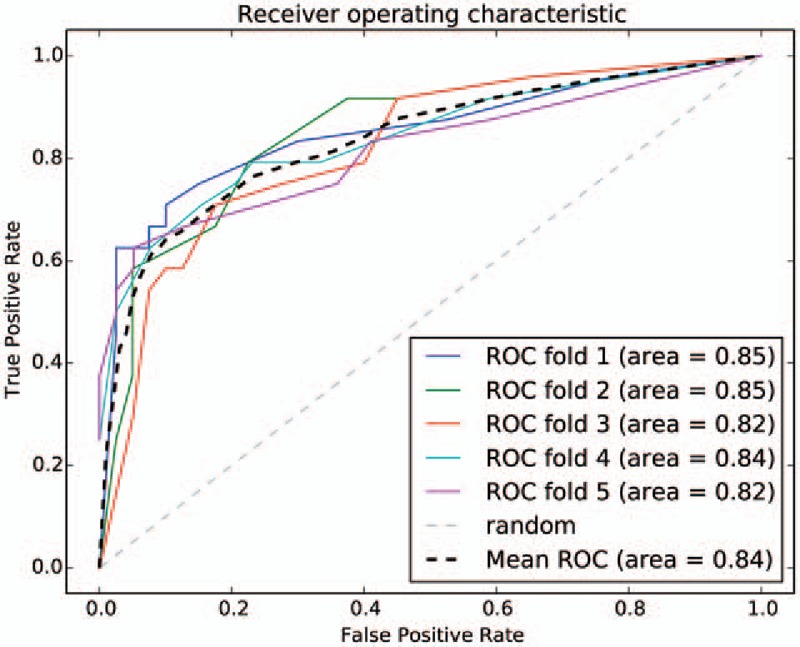
The receiver-operating characteristic (ROC) curve.
Table 2.
Classification reports for early stage (A) and late stage (B).

3.6. Correlation between the identified 10 pathway and patients’ prognosis
We analyzed the correlation between the identified 10 pathway and patients’ prognosis. There was significant difference between dead samples and alive samples for small cell lung cancer, PPAR signaling pathway, mineral absorption, endometrial cancer, nonsmall cell lung cancer, hepatitis C, pancreatic cancer, aldosterone-regulated sodium reabsorption, and adipocytokine-signaling pathway (P < .05, Fig. 6). No significant difference was found for thyroid hormone signaling pathway (P > .05).
Figure 6.

Correlation between the identified pathway and patients’ prognosis. The horizontal ordinate, patients’ prognosis; longitudinal coordinates, pathscore; read sample, dead; and green sample, alive.
4. Discussions
Lung adenocarcinoma is a highly malignant cancer, and its cells are involved in pulmonary circulation system. The cells can be released into the circulatory system and grow in other tissues and organs, and then the spread and metastasis of cancer was achieved. Thus, it is necessary to identify the stage of lung adenocarcinoma and then block it before the malignant progression. In this study, from stage I to stage IV, ASLP gradually increased, CC and degree gradually decreased, and there was no significant difference for BC, EC, and TC in coexpression network. Totally 10 significantly enriched pathways were obtained. In the distribution map of 10 pathways score in different groups, degrees that sample groups deviated from the normal level were as follows: stage I < stage II < stage III < stage IV. The boxplot of 10 pathway score in different stages showed that the score of 4 stages exhibited linear change in some pathways, and the score of 1 or 2 stages were significantly different from the rest stages in some pathways.
In the present study, from stage I to stage IV, ASLP gradually increased, CC and degree gradually decreased, and there was no significant difference for BC, EC, and TC in coexpression network. These indicators suggested that the efficiency of the system network was gradually reduced in the progress from stage I to stage IV. In the state of disease, the decrease of network efficiency and signal transmission efficiency led to the reduction of some important function, particularly functions related with disease response or self-activated immune system. Under the stimulation of the disease, due to the decrease of the signal transmission efficiency, functional mechanism of stress and repair was suppressed, resulting in the disease progression and the increase of the malignancy degree.
Furthermore, totally 10 significantly enriched pathways were obtained from pathway enrichment analysis. They were cancer-related pathways (small cell lung cancer, endometrial cancer, nonsmall cell lung cancer, and pancreatic cancer), PPAR-signaling pathway, mineral absorption, aldosterone-regulated sodium reabsorption, adipocytokine signaling pathway, hepatitis C, and thyroid hormone signaling pathway. One study showed that the expression status of PPAR-γ correlated with differentiation status and survival in the lung cancer patients, and many PPAR-γ ligands (exert their effects through both PPAR-γ dependent and independent pathways) could inhibit tumor growth and progression in lung cancer preclinical models by modulating various cellular processes in cancer cells.[19] The mineral absorption was also a significantly downregulated pathway in the article of Wang et al[20] studying lung adenocarcinoma by using microarray analysis. Mijatovic et al[21] indicated that the α1 subunit of the sodium pump could be a target to treat nonsmall cell lung cancers, and thus sodium reabsorption might also be important to lung adenocarcinoma. Adipocytokines play a central role in many aspects of inflammation and immunity,[22] and the hepatitis C virus is also associated with chronic inflammation.[23] Furthermore, lung adenocarcinoma is associated with inflammation.[24,25] The metastatic thyroid cancer is originate from lung adenocarcinoma,[26] and thyroid transcription factor-1 is almost exclusively expressed in the normal thyroid and lung, as well as in carcinomas derived from these organs.[27] Therefore, our present study is in line with the former researches and suggests that these 10 pathways may play significant roles in lung adenocarcinoma.
In addition, in the distribution map of 10 pathways score in different groups, degrees that sample groups deviated from the normal level were as follows: stage I < stage II < stage III < stage IV. In the boxplot of 10 pathway score in different stages, the score of 4 stages exhibited linear change in small cell cancer pathway, mineral absorption pathway, endometrial cancer pathway, hepatitis C pathway, pancreatic cancer pathway, and aldosterone-regulated sodium reabsorption pathway, and the score of stage I was almost equal to stage II, stage III equal to stage IV for nonsmall cell lung cancer pathway and PPAR-signaling pathway. However, for the adipocytokine-signaling pathway, the score of stage I and II developed in the forward direction, then the score of stage III and IV developed toward negative direction. The score of stage I, II, and III developed in the forward direction, then the score of stage IV developed toward negative direction for thyroid hormone signaling pathway. These pathways showed significantly different functional levels in different process of lung adenocarcinoma development. On the one hand, with development of lung adenocarcinoma, those pathways exhibited linear change, nonsmall cell lung cancer pathway and PPAR signaling pathway developed linear or periodical change of function, and the functions gradually strengthen or gradually weaken. On the other hand, adipocytokine-signaling pathway and thyroid hormone signaling pathway developed functional change in the opposite direction at a certain stage with development of lung adenocarcinoma, indicating the existence of a critical point of functional variation in these 2 pathways. Furthermore, the mean ROC of the classification model was 0.84. Therefore, these 10 pathways have important roles for predicting lung adenocarcinoma in different stages, and these pathways may provide new ideas for explaining the pathogenic mechanism of lung adenocarcinoma and new treatment. But concrete prediction methods need further studies.
Besides, in our present study, the analysis for the correlation between the identified pathway and patients’ prognosis showed that there was significant difference between dead samples and alive samples for these pathways except thyroid hormone signaling pathway. Thus, these 9 pathways may be able to predict the patients’ prognosis.
In conclusion, cancer-related pathways (small cell lung cancer, endometrial cancer, nonsmall cell lung cancer, and pancreatic cancer), PPAR-signaling pathway, mineral absorption, aldosterone-regulated sodium reabsorption, adipocytokine-signaling pathway, hepatitis C, and thyroid hormone signaling pathway are associated with the development of lung adenocarcinoma, and may be able to predict different stages of lung adenocarcinoma. Furthermore, these pathways except thyroid hormone signaling pathway may be able to predict the patients’ prognosis. Although these pathways can be used to predict different stages of lung adenocarcinoma, whether these pathways are also applied to squamous cell cancer or large cell cancer need further research in the future. However, no experimental verification is the limitation of this study, and further studies are needed to verify our results. Besides, for further exact analysis of this topic, the analyses of the data with exact subgroup of the cancer in the TCGA datasheet are needed in our next research plan.
Supplementary Material
Supplementary Material
Footnotes
Abbreviations: ASLP = average shortest path length, BC = betweenness coefficient, CC = clustering coefficient, EC = eccentricity.
The authors have no funding and conflicts of interest to disclose.
Supplemental Digital Content is available for this article.
References
- [1].Network TCGA. Comprehensive molecular profiling of lung adenocarcinoma. Nature 2015;511:543–50. [DOI] [PMC free article] [PubMed] [Google Scholar]
- [2].Imielinski M, Berger A, Hammerman P, et al. Mapping the hallmarks of lung adenocarcinoma with massively parallel sequencing. Cell 2012;150:1107–20. [DOI] [PMC free article] [PubMed] [Google Scholar]
- [3].Jemal A, Siegel R, Xu J, et al. Cancer statistics. CA Cancer J Clin 2010;60:277–300. [DOI] [PubMed] [Google Scholar]
- [4].Sica G, Yoshizawa A, Sima CS, et al. A grading system of lung adenocarcinomas based on histologic pattern is predictive of disease recurrence in stage I tumors. Am J Surg Pathol 2010;34:1155–62. [DOI] [PubMed] [Google Scholar]
- [5].Rami-Porta R, Bolejack V, Goldstraw P. The new tumor, node, and metastasis staging system. Semin Respir Crit Care Med 2011;32:44–51. [DOI] [PubMed] [Google Scholar]
- [6].Goldstraw P, Crowley J, Chansky K, et al. The IASLC Lung Cancer Staging Project: proposals for the revision of the TNM stage groupings in the forthcoming (seventh) edition of the TNM classification of malignant tumours. J Thorac Oncol 2007;2:706–14. [DOI] [PubMed] [Google Scholar]
- [7].Takeuchi K, Soda M, Togashi Y, et al. RET, ROS1 and ALK fusions in lung cancer. Nat Med 2012;18:378–81. [DOI] [PubMed] [Google Scholar]
- [8].Yoshizawa A, Sumiyoshi S, Sonobe M, et al. Validation of the IASLC/ATS/ERS lung adenocarcinoma classification for prognosis and association with EGFR and KRAS gene mutations: analysis of 440 Japanese patients. J Thorac Oncol 2013;8:52–61. [DOI] [PubMed] [Google Scholar]
- [9].Network CGAR. Comprehensive molecular profiling of lung adenocarcinoma. Nature 2014;511:543–50. [DOI] [PMC free article] [PubMed] [Google Scholar]
- [10].Hassan KA, Wang L, Korkaya H, et al. Notch pathway activity identifies cells with cancer stem cell-like properties and correlates with worse survival in lung adenocarcinoma. Clin Cancer Res 2013;19:1972. [DOI] [PMC free article] [PubMed] [Google Scholar]
- [11].Xiao K, Jiang J, Guan C, et al. Curcumin induces autophagy via activating the AMPK signaling pathway in lung adenocarcinoma cells. J Pharm Sci 2013;123:102–9. [DOI] [PubMed] [Google Scholar]
- [12].Ni L, Feng Y, Wan H, et al. Angiotensin-(1-7) inhibits the migration and invasion of A549 human lung adenocarcinoma cells through inactivation of the PI3K/Akt and MAPK signaling pathways. Oncol Rep 2012;27:783–90. [DOI] [PubMed] [Google Scholar]
- [13].Dallaire F, Slorach C, Bradley T, et al. Pediatric reference values and Z score equations for left ventricular systolic strain measured by two-dimensional speckle-tracking echocardiography. J Am Soc Echocardiogr 2016;29:786–93. [DOI] [PubMed] [Google Scholar]
- [14].Chen G, Shin YW, Taylor PA, et al. Untangling the relatedness among correlations, part I: nonparametric approaches to inter-subject correlation analysis at the group level. Neuroimage 2016;142:248–59. [DOI] [PMC free article] [PubMed] [Google Scholar]
- [15].Noth J, Esselborn J, Güldenhaupt J, et al. [FeFe]-hydrogenase with chalcogenide substitutions at the H-cluster maintains full H2 evolution activity. Angew Chem 2016;55. [DOI] [PubMed] [Google Scholar]
- [16].Forbes C. Microcomputer programs for mutation studies using the Fisher exact test or the binomial approximation. Mutat Res 1984;141:205–10. [DOI] [PubMed] [Google Scholar]
- [17].Ghosh A, Barman S. Application of Euclidean distance measurement and principal component analysis for gene identification. Gene 2016;583:112–20. [DOI] [PubMed] [Google Scholar]
- [18].Utkin LV, Chekh AI, Zhuk YA. Binary classification SVM-based algorithms with interval-valued training data using triangular and Epanechnikov kernels. Neural Netw 2016;80:53–66. [DOI] [PubMed] [Google Scholar]
- [19].Reka AK, Goswami MT, Krishnapuram R, et al. Molecular cross-regulation between PPAR-γ and other signaling pathways: implications for lung cancer therapy. Lung Cancer 2011;72:154–9. [DOI] [PMC free article] [PubMed] [Google Scholar]
- [20].Wang Y, Chen W, Chen J, et al. expression profiles of EGFR exon 19 deletions in lung adenocarcinoma ascertained by using microarray analysis. Med Oncol 2014;31:1–0. [DOI] [PubMed] [Google Scholar]
- [21].Mijatovic T, Rol I, Van QE, et al. The alpha1 subunit of the sodium pump could represent a novel target to combat non-small cell lung cancers. J Pathol 2007;212:170–9. [DOI] [PubMed] [Google Scholar]
- [22].Tilg H, Moschen AR. Adipocytokines: mediators linking adipose tissue, inflammation and immunity. Nat Rev Immunol 2006;6:772–83. [DOI] [PubMed] [Google Scholar]
- [23].Matsuzaki K, Murata M, Yoshida K, et al. Chronic inflammation associated with hepatitis C virus infection perturbs hepatic transforming growth factor ( signaling, promoting cirrhosis and hepatocellular carcinoma. Hepatology 2007;46:48–57. [DOI] [PubMed] [Google Scholar]
- [24].Su Y-j, Xu F, Yu J-p, et al. Up-regulation of the expression of S100A8 and S100A9 in lung adenocarcinoma and its correlation with inflammation and other clinical features. Chin Med J 2010;123:2215–20. [PubMed] [Google Scholar]
- [25].Ji H, Houghton A, Mariani T, et al. K-ras activation generates an inflammatory response in lung tumors. Oncogene 2006;25:2105–12. [DOI] [PubMed] [Google Scholar]
- [26].Miyakawa M, Sato K, Hasegawa M, et al. Severe thyrotoxicosis induced by thyroid metastasis of lung adenocarcinoma: a case report and review of the literature. Thyroid 2001;11:883–8. [DOI] [PubMed] [Google Scholar]
- [27].Ordóñez NG. Value of thyroid transcription factor-1 immunostaining in distinguishing small cell lung carcinomas from other small cell carcinomas. Am J Surg Pathol 2000;24:1217–23. [DOI] [PubMed] [Google Scholar]
Associated Data
This section collects any data citations, data availability statements, or supplementary materials included in this article.


