Abstract
Recognition of the close relationship of nonalcoholic fatty liver disease (NAFLD) with diabetes mellitus 2, obesity, metabolic syndrome, and cardiovascular disease has stimulated growing interest in NAFLD as a public health problem. Serum alanine aminotransferase (ALT) has been proposed as a marker of NAFLD, but levels are within the range currently considered “normal” in a large proportion of NAFLD subjects.
The aim of the study was to determine the diagnostic accuracy of serum ALT for identifying individuals with NAFLD, using 3-Tesla (T) magnetic resonance spectroscopy (1H-MRS).
A cross-sectional study was conducted in 129 healthy subjects. Liver triglyceride content was quantified by 1H-MRS. NAFLD was defined as liver triglyceride content greater than 5.56%.
Liver triglyceride content was >5.56% in 79 participants (NAFLD) and lower in the remaining 50 (normal). Serum ALT levels correlated positively with liver triglyceride content (r = 0.58, P < .001), Homeostatic Model Assessment for Insulin Resistance (r = 0.32, P < .01), and fasting insulin (r = 0.31, P < .01), and inversely correlated with adiponectin (r = 0.35, P < .01) and high-density lipoprotein cholesterol (r = 0.32, P < .01). Regression analysis showed that serum ALT was the best predictor of NAFLD (P < .01). Optimal serum ALT cut-off to predict NAFLD was 23 IU/L (area under receiver-operating characteristic curve: 0.93; sensitivity: 0.94; specificity: 0.72).
This study shows that serum ALT is a sensitive and accurate biomarker of NAFLD if the “normal” ALT value is revised and established at a lower level. An ALT threshold of 23 IU/L identified 94% of individuals with NAFLD in the present series, using 3-T 1H-MRS for liver triglyceride quantification.
Keywords: insulin resistance, magnetic resonance spectroscopy, NAFLD, sensitivity and specificity
1. Introduction
Nonalcoholic fatty liver disease (NAFLD) is defined as fat accumulation in the liver in the absence of significant alcohol consumption or any other etiology for secondary hepatic steatosis. It is considered the hepatic manifestation of the metabolic syndrome (MetS), and is the most frequent cause of aminotransferase elevation.[1] NAFLD encompasses simple hepatic steatosis, that is, the accumulation of triglycerides in the liver with no evidence of hepatocyte injury or inflammation, and nonalcoholic steatohepatitis, that is, the presence of hepatic steatosis with hepatocellular injury and inflammation that may eventually progress to liver cirrhosis and hepatocellular carcinoma.[1,2]
The prevalence of NAFLD varies widely from 10% to 52% in the general population, and up to 60% to 90% in high-risk persons with obesity, type 2 diabetes (T2DM), and/or MetS.[1,3–7] Estimates from liver biopsy series indicate that the prevalence of nonalcoholic steatohepatitis is much lower, ranging from 2% to 5%.[5] Studies on the long-term outcome of patients with NAFLD showed that they more frequently die from cardiovascular disease (CVD) than from liver cirrhosis or hepatocellular carcinoma.[6,8]
Recognition of the close relationship of NAFLD with obesity,[9] T2DM,[10] MetS,[11,12] insulin resistance,[13] and CVD[14–16] has stimulated growing interest in NAFLD as a public health problem, and in the search for a marker to identify individuals with NAFLD in the general population. After the demonstration by epidemiological and clinical studies of a frequent association between increased liver fat content and serum alanine aminotransferase (ALT) elevation, serum ALT has been proposed as a surrogate marker for NAFLD.[17] Nevertheless, only a proportion of patients with NAFLD have elevated serum ALT.[4,13,17–20]
Given that serum ALT values within the current “normal” range have been associated with NAFLD and a higher risk of cardiometabolic disorders, persons with these conditions are included in the apparently healthy sample population that is considered “normal.” Therefore, it has been suggested that the upper “normal” limit for serum ALT should be re-evaluated to facilitate the identification of individuals with NAFLD.[17,21] Prati et al, in a retrospective cohort study, proposed decreasing the upper limit of normal for serum ALT levels to ≤30 IU/L in men and ≤19 IU/L in women to detect more people with hepatitis C viremia. They used liver biopsies in 133 hepatitis C virus (HCV) antibody-positive persons, and ultrasound examination in 59 HCV antibody-negative blood donors,[22] but no consensus has been reached.[23] Recent cross-sectional studies are available on the sensitivity and specificity of serum ALT as a biomarker of NAFLD.[16,24–26] However, in these studies, the NAFLD diagnosis was exclusively based on ultrasound imaging, but was not confirmed by liver biopsy or proton magnetic resonance spectroscopy (1H-MRS), which is the noninvasive gold standard for the quantification of liver triglyceride content,[27,28] widely validated in clinical and epidemiological studies.[13,29,30] Liver ultrasound examination is not sufficiently sensitive in cases of mild and moderate steatosis, and is likely to underestimate the prevalence of NAFLD.[29,31,32]
Thus, currently, the true diagnostic accuracy of serum ALT as biomarker for NAFLD in healthy subjects and its relationship with insulin resistance and other metabolic risk factors remain unknown. Clarification of this aspect may help to identify individuals with hepatic steatosis who might be more at risk of cardiometabolic diseases.
We have found no published study on the diagnostic accuracy, sensitivity, and specificity of serum ALT to identify individuals with NAFLD using 3-Tesla (T) 1H-MRS. We therefore utilized 3T (1H-MRS) to quantify liver triglyceride content in a sample of healthy adults to assess the accuracy, sensitivity, and specificity of serum ALT as a biomarker of NAFLD. We also investigated the relationship of liver triglyceride content and serum ALT with metabolic risk factors, including insulin resistance (Homeostatic Model Assessment for Insulin Resistance [HOMA-IR]), fasting insulin, adiponectin, and tumor necrosis factor (TNF), among others.
2. Material and methods
2.1. Study population
The study population was consecutively recruited between February 2011 and October 2013 from among individuals undergoing examination at the Occupational Risk Prevention Unit in Granada (Southern Spain) for a routine annual general checkup. Participants were all healthy male or female Caucasians aged between 19 and 76 years.
Study exclusion criteria were: history of daily alcohol intake >20 g (men) or >10 g (women), based on responses to a validated questionnaire on alcohol consumption and confirmation of results by a family member; the presence of hepatitis B virus (HBV)/HCV serologic markers, autoimmune hepatitis, primary biliary cirrhosis, hemochromatosis, Wilson disease, cancer, diabetes mellitus, endocrine, cardiac, renal, or lung disease; the consumption of drugs that may cause steatosis (eg, corticosteroids, amiodarone, methotrexate, tamoxifen); body mass index (BMI) <17 or >40 kg/m2; and the wearing of a pacemaker or other device and/or self-reported claustrophobia incompatible with 1H-MRS. Out of the total 911 adults who came for the routine annual checkup, 263 individuals met the eligibility criteria, and 140 (53%) signed informed consent to participate in the study. After the exclusion of 11 of these individuals for missing test appointments, the final sample comprised 129 subjects with a mean age 45.7 years (range 20–76 years) (Fig. 1). The study was approved by the ethical committee of the University Hospital San Cecilio.
Figure 1.
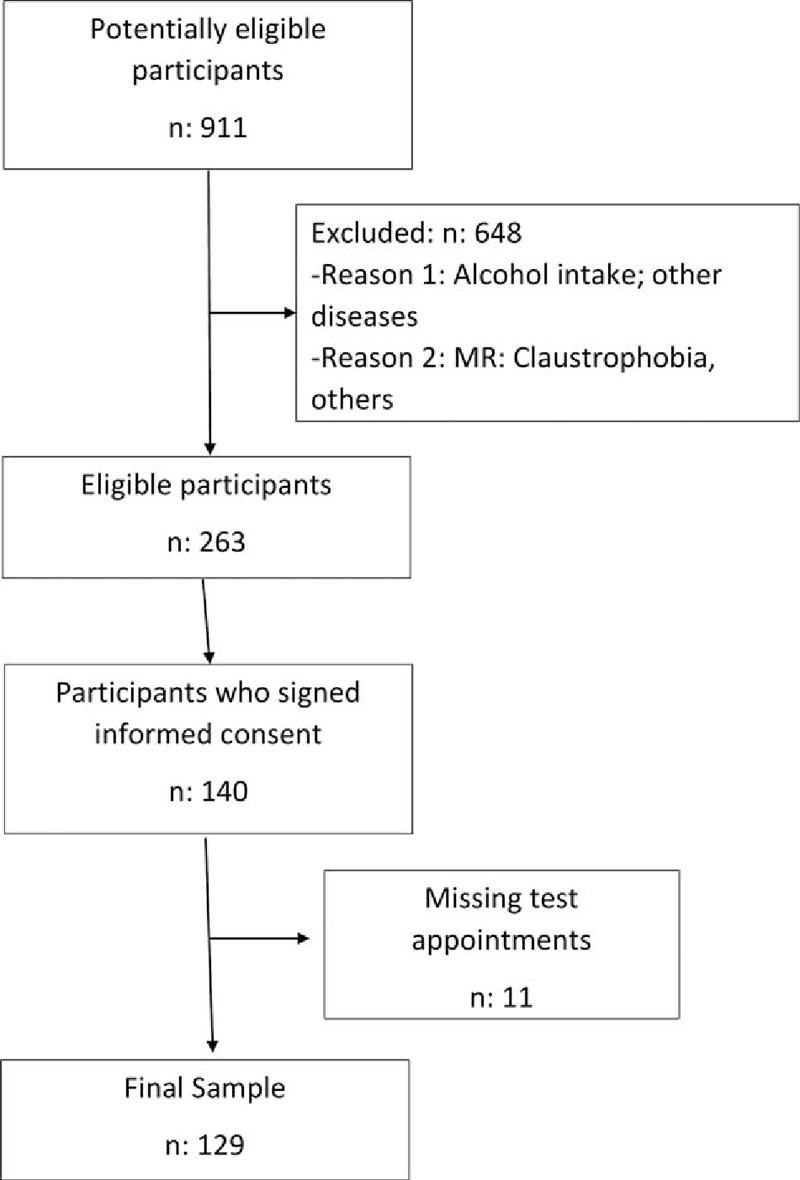
Flow of participants through the study.
2.2. Study design and anthropometric evaluations
All individuals recruited for the study had undergone a full medical history, physical examination, complete blood analysis, and ultrasound examination as part of the screening process. The weight and height of the study participants were also recorded, calculating their BMI (kg/m2), and their waist circumference was measured with soft tape midway between the lowest rib and the iliac crest in standing position.
2.3. Laboratory analysis
Blood was drawn in the morning after overnight fasting. Serum ALT and aspartate aminotransferase (AST) levels were determined using a kinetic method (Cobas c 311, Roche Diagnostics GmbH, Mannheim, Germany), with coefficients of variation of 3.3 and 3.1, respectively; serum glucose by the glucose oxidase (enzymatic) method (Roche/Hitachi Analytics systems, Roche Diagnostics GmbH); adiponectin by radioimmunoassay (Linco Research, St. Charles, MO); serum insulin by electrochemiluminescence immunoassay (Elecsys 2010, Roche Diagnostics GmbH); serum TNF-α by enzyme-linked immunosorbent assay, using a TNF-α (human) ELISA kit (Biosource Europe, Nivelles, Belgium); and serum cholesterol with an enzymatic method (Roche Diagnostics GmbH). Insulin resistance was calculated as HOMA-IR = fasting insulin (mU/L) × fasting glucose (mmol/L)/22.5.[33] Coefficients of variation of the biochemical tests ranged from 3.1% to 9.9%.
2.4. 1H-MRS 3T analyses
A magnetic resonance imaging study was conducted before the spectroscopy, acquiring in vivo spectra at 3T with a Philips Achieva system (Royal Philips, Amsterdam, Netherlands). A 3-plane localizer was employed to plan the 1H-MRS, and the spectra were obtained using the body coil of the scanner. Breath-hold was monitored using a respiratory belt.
A single voxel of 27 cm3 (30 × 30 × 30 mm) was selected within normal liver tissue in segment VI, avoiding the edge of the liver, the diaphragm, and major blood vessels. All spectra were obtained with a stimulated echo acquisition mode sequence (STEAM), setting the following parameters: repetition time = 8000; echo time = 20, 40, and 60 ms; number of signal averages = 4 (without water suppression); and bandwidth = 2000. Data were acquired within a breath hold. T2 correction was applied and field homogeneity was adjusted automatically for each voxel.
The MRS was reconstructed using Extended MR WorkSpace software (Philips). Raw data were zero-filled once, with no filter, and were phase-corrected, Fourier-transformed, baseline-corrected, and averaged. A Marquardt curve was fitted, using a combined Lorentzian–Gaussian model to calculate the area under the curve of fat and water peaks. Spectra were referenced to residual water and the dominant methylene lipid (–CH2) peak at δ = 4.47 and δ = 1.43 ppm, respectively. Fat fraction percentage (FF) was defined as FA/(FA + WA) × 100, where FA is the area under the fat peak and WA is the area under the water peak. 1H-MRS data were interpreted by an experienced radiologist blinded to the biochemical results.
Nonalcoholic fatty liver disease was defined by a liver fat content greater than 5.56%, as proposed in previous studies, and was classified as mild (>5.56% to 25% liver fat content), moderate (>25% to 50%), or severe (>50%).[27,34]
The anthropometric, biochemical, and 1H-MRS measurements of each individual were performed within a 24-hour period.
2.5. Statistical analysis
Results were expressed as means ± standard deviation (SD). The Kolmogorov–Smirnoff test was used to check the normality of the data distribution. Mean values were compared among groups with the 1-way analysis of variance (ANOVA), followed by the Tukey multiple-comparison test, the unpaired Student 2-tailed t test, or nonparametric Mann–Whitney U test, as appropriate. Correlations were examined by Pearson standard linear regression analysis (normal distribution) or by the Spearman test (non-normal distribution).
Backward stepwise multiple regression analysis was used to establish the most significant determinants of NAFLD. Variables entered into the equation were WC, BMI, HOMA-IR, and serum values of ALT, AST, GGT, fasting insulin, triglycerides, adiponectin, and high-density lipoprotein (HDL)-cholesterol. Only variables showing a P < .5 were retained in the final regression model.
Receiver-operating characteristic (ROC) curves were created, estimating optimal cut-off points for the diagnosis of NAFLD, and the sensitivity, specificity, positive predictive value (PPV), and negative predictive value (NPV) were calculated.
All analyses were performed with SPSS software for Windows, version 22 (SPSS Inc., Chicago, IL).
3. Results
The final study comprised 129 participants with a mean ± SD age of 45.7 ± 10.2 (range 20–76 years). Their anthropometric data are exhibited in Table 1 and their biochemical results are shown in Table 2. Seventy-five (58.13%) of the participants were diagnosed with NAFLD, classified as mild (29 cases), moderate (34 cases), or severe (12 cases); the remaining 54 individuals had liver fat content below 5.56%.
Table 1.
Anthropometric variables in subjects classified according to liver fat content.

Table 2.
Biochemical variables in subjects classified according to liver fat content quantified by 1H-MRS.
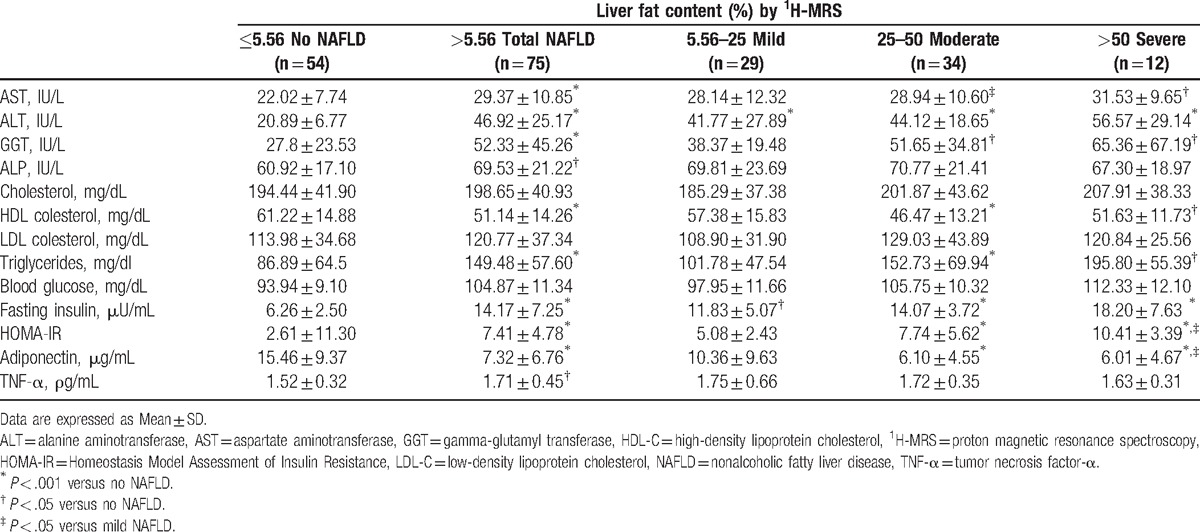
3.1. Anthropometric and biochemical parameters according to liver fat content
As shown in Tables 1 and 2, mean BMI, waist circumference, HOMA-IR, serum ALT, AST, gamma-glutamyl transferase (GGT), alkaline phosphatase (ALP), triglycerides, TNF-α, and fasting insulin levels were higher in individuals with NAFLD than in those without (P < .001, except for ALP and TNF-α, P < .05); only HDL-cholesterol and adiponectin were lower in individuals with NAFLD than in those without (P < .001 for both). Multiple comparison tests among NAFLD categories only revealed significant differences in ALT (P < .05), HOMA-IR (P < .05), and adiponectin (P < .05) between individuals with severe versus mild steatosis.
3.2. Correlations of liver fat content with different parameters
Liver fat content was highly significantly and positively correlated with serum ALT (r = 0.58, P < .001) (Fig. 1), serum AST (r = 0.32, P < .01), serum GGT (r = 0.31, P < .01), waist circumference (r = 0.54, P < .001), BMI (r = 0.48, P < .001), fasting insulin (r = 0.57, P < .001), HOMA-IR (r = 0.57, P < .001), and serum triglyceride (r = 0.35, P < .01), and was inversely correlated with serum adiponectin (r = −0.43, P < .001) and HDL-cholesterol (r = −0.32, P < .01).
3.3. Correlations of serum ALT values with different parameters
The results depicted in Fig. 2 confirm that serum ALT values were positively correlated with liver fat content. Serum ALT was also correlated with HOMA-IR (r = 0.32, P < .01), serum fasting insulin (r = 0.31, P < .01), triglycerides (r = 0.18, P < .05), waist circumference (r = 0.25, P < .01), and BMI (r = 0.25, P < .01), and inversely correlated with adiponectin (r = −0.35, P < .01) and with HDL-cholesterol (r = −0.32, P < .01).
Figure 2.
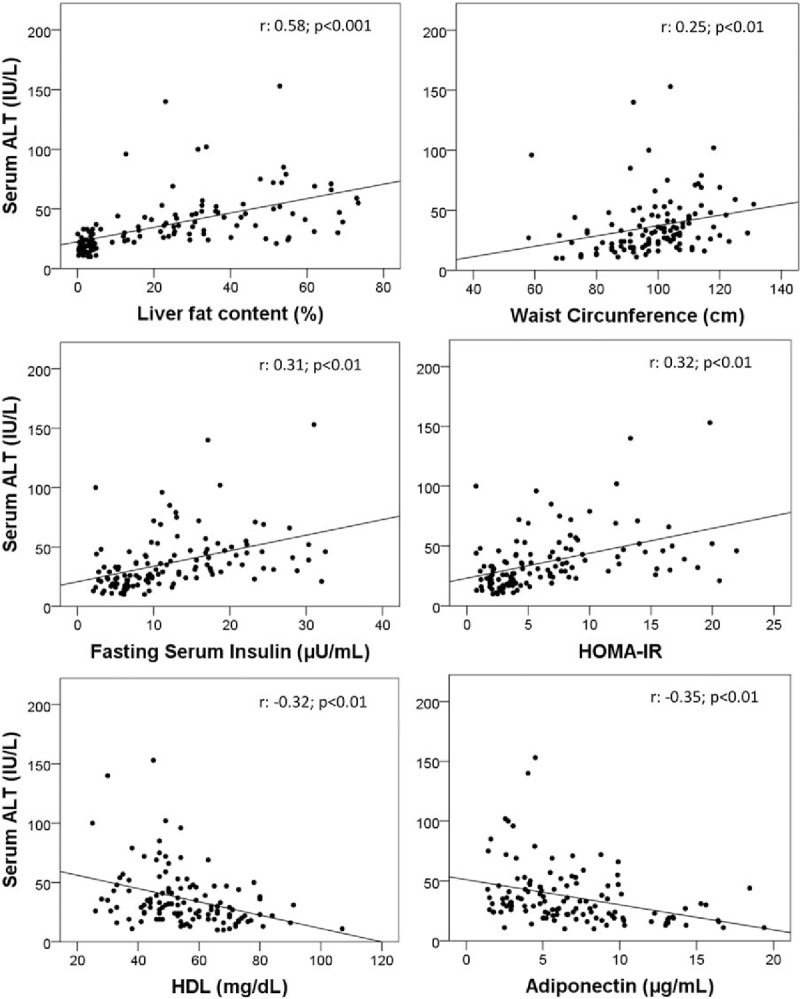
Correlation of serum ALT with: liver fat content, waist circumference, HOMA-IR, and serum levels of fasting insulin, adiponectin, and HDL-cholesterol. ALT = alanine aminotransferase, HDL = high-density lipoprotein, HOMA-IR = Homeostatic Model Assessment for Insulin Resistance.
3.4. Regression analyses
Results of the backward stepwise regression analyses on the predictors of liver fat content showed that serum ALT was the most significant independent variable (β coefficient = 1.367, SE = 0.121, P < .01). HOMA-IR was also significant (β coefficient = 1.160, SE = 0.075, P < .04).
3.5. ROC curves and validity of serum ALT for the diagnosis of NAFLD
Receiver-operating characteristic (ROC) curves were created to assess the accuracy of serum ALT to predict liver fat content greater than 5.56% (upper limit of normal range) (Fig. 3). The area under the curve (AUC) was 0.93 (95% confidence interval [CI] 0.89, 0.97), the optimal ALT cut-off point was 23 IU/L, with a sensitivity of 0.94, specificity of 0.72, PPV of 0.82, and NPV of 0.90. Analysis by sex showed an optimal ALT cut-off value to identify individuals with NAFLD of 24 IU/L for the males (AUC: 0.92; sensitivity: 0.95; specificity: 0.67) and 21 IU/L for the females (AUC: 0.94; sensitivity: 0.96; specificity: 0.76). Figure 4 shows that 48% of individuals with ALT below 40 IU/L had NAFLD, and had significantly higher values of HOMA-IR and serum fasting insulin and lower values of adiponectin and HDL-cholesterol levels in comparison with those without NAFLD. Only 4 individuals with ALT levels below 23 IU/L had NAFLD. The AUC for the rest of the parameters had lower values: BMI: 0.82, waist circumference: 0.84, GGT: 0.74, and AST: 0.76.
Figure 3.
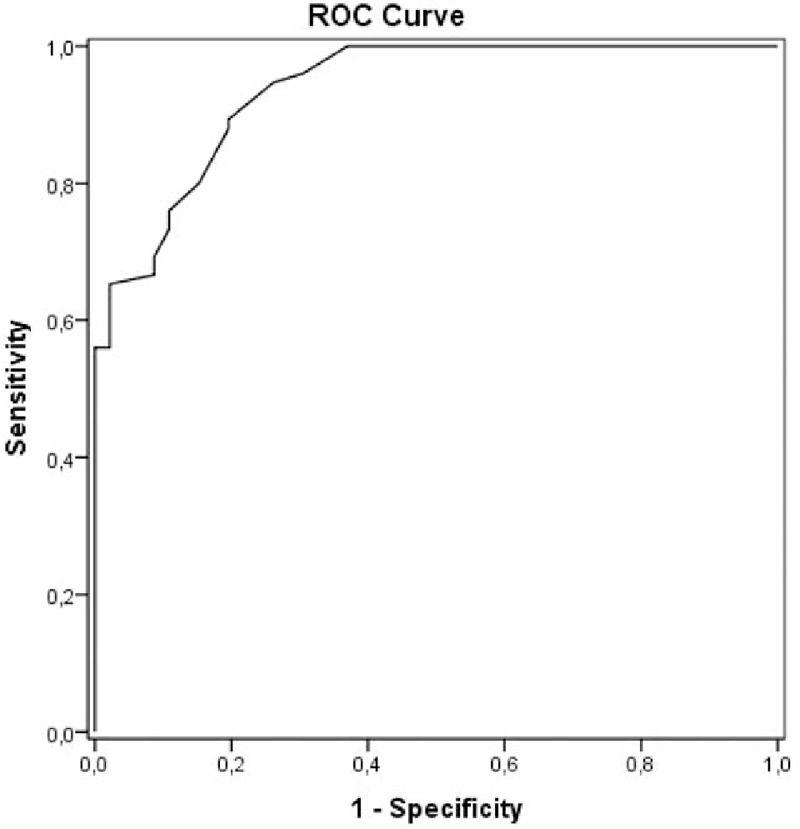
Receiver-operating characteristic curve of sensitivity plotted against 1-specificity of serum ALT to identify subjects with liver fat content greater than 5.56% quantified by proton magnetic resonance spectroscopy (1H-MRS) 3T. ALT = alanine aminotransferase, 1H-MRS = proton magnetic resonance spectroscopy.
Figure 4.
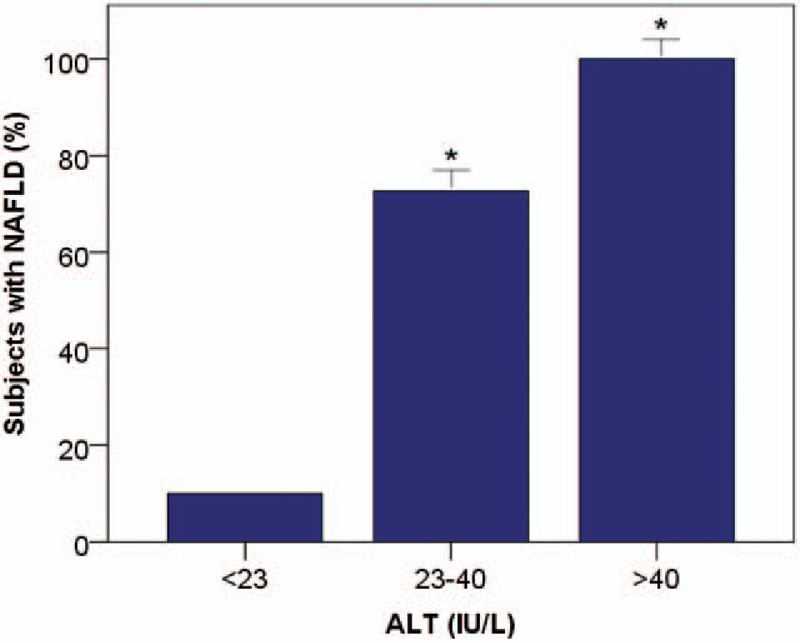
Percentage of subjects with NAFLD in the different ALT categories. ∗P < .001 versus no NAFLD. ALT = alanine aminotransferase, NAFLD = nonalcoholic fatty liver disease.
3.6. Metabolic variables according to both liver fat content and ALT categories
As shown in Fig. 5, changes in waist circumference, HOMA-IR, and serum values of fasting insulin, adiponectin, triglycerides, and HDL-cholesterol in the different NAFLD categories paralleled changes in the different ALT categories.
Figure 5.
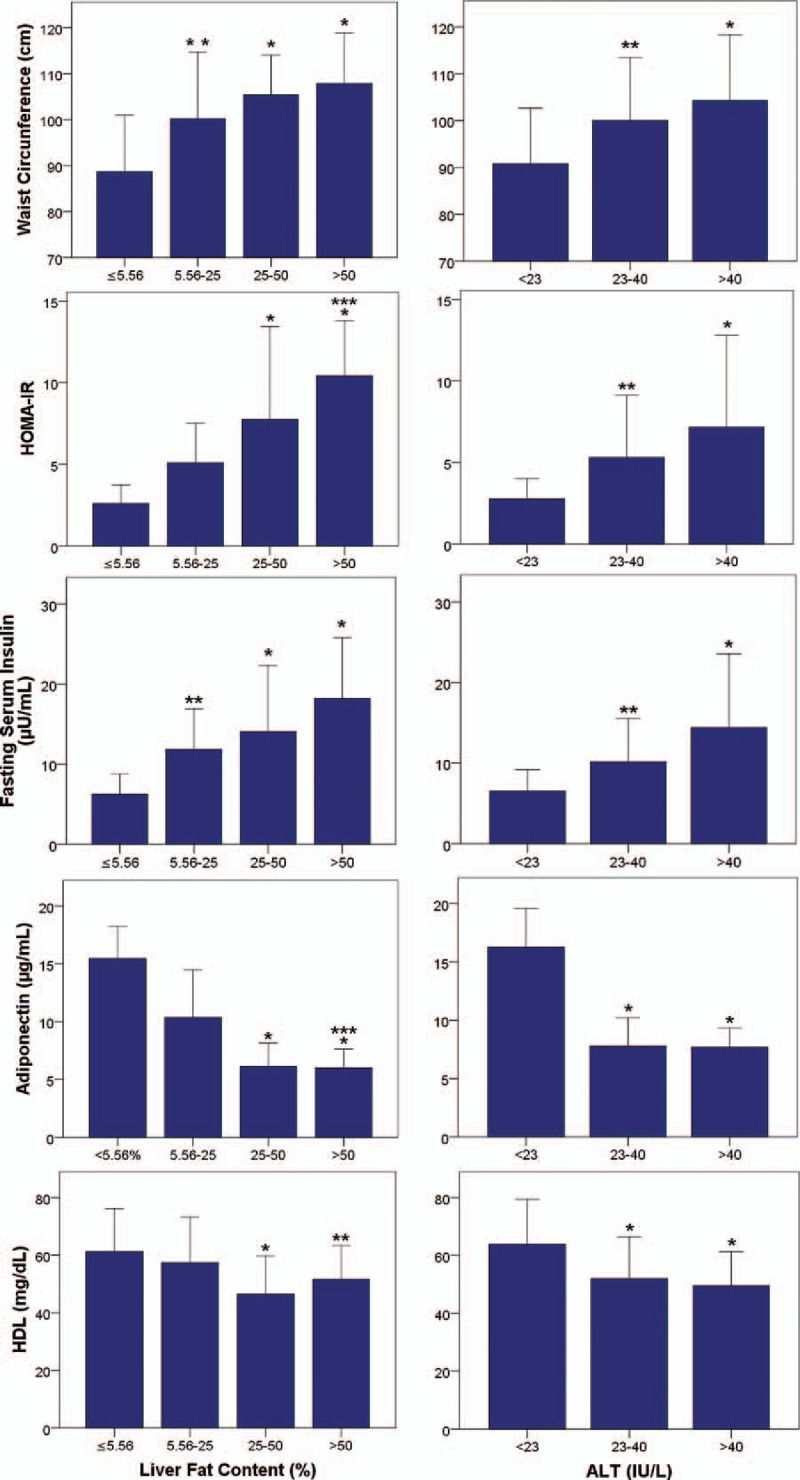
Metabolic variables changes according to both liver fat content and ALT categories. Data are presented as means ± SD. ∗P < .001 versus no NAFLD; †P < .01 versus no NAFLD; ‡P < .05 versus mild NAFLD. ALT = alanine aminotransferase, NAFLD = nonalcoholic fatty liver disease.
4. Discussion
In this sample of individuals from the general population, serum ALT levels were strongly correlated with liver fat content and enabled the detection of most of the participants with NAFLD. Liver triglyceride content was determined by 1H-MRS, the only noninvasive reference method for its quantification,[34–36] widely validated in population-based studies[27] and clinical trials.[37]
The participants with NAFLD had higher serum levels of ALT, HOMA-IR, fasting insulin, and triglycerides, and lower levels of adiponectin and HDL-cholesterol in comparison with those without NAFLD, as previously reported in selected populations of obese or diabetic patients.[13,38–40] Significant differences in ALT levels were found between subjects with mild NAFLD and those without NAFLD, and between those with severe and mild NAFLD, suggesting that serum ALT levels might offer the capacity to discriminate among different degrees of liver fat content.
Both serum ALT and liver fat content were significantly correlated with HOMA-IR, serum fasting insulin, and triglycerides, and were significantly inversely correlated with serum adiponectin and HDL-cholesterol. Parallelism observed between changes in these metabolic parameters in the different NAFLD categories and changes in the different ALT categories support the possible relationship between both NAFLD and serum ALT with insulin resistance and other metabolic risk factors. The present findings in healthy individuals are in agreement with results obtained in selected populations of obese individuals, and patients with diabetes or MetS.[17–20,41]
Serum adiponectin levels were inversely correlated with liver fat content, serum ALT, HOMA-IR, and fasting insulin, and were positively correlated with HDL-cholesterol, supporting previous reports on the association of NAFLD and serum ALT with low adiponectin levels in obese patients.[42]
Taken together, our findings in healthy individuals endorse epidemiological findings that elevated ALT values (including those within normal range) are strongly associated with NAFLD, insulin resistance, and probably, with an increased risk of T2DM.[16]
Elevated serum TNF-α levels have been described in patients with chronic liver disease of different etiologies,[43,44] including NAFLD,[45] and activation of the TNF-α system has been associated with insulin resistance[46] and low adiponectin levels.[45] In our study, serum TNF-α levels were higher in the individuals with NAFLD than in those without NAFLD, but TNF-α did not correlate with ALT, HOMA-IR, adiponectin, or any other parameter, in agreement with previous reports in obese patients.[39] These findings might indicate that the TNF-α system is activated in NAFLD, but its relationship with insulin resistance and other metabolic risk factors remains to be elucidated.
It is well-documented that serum ALT levels cannot be used to predict nonalcoholic steatohepatitis or to differentiate between simple steatosis and nonalcoholic steatohepatitis.[13,23] A recent report that used 1H-MRS to quantify liver fat content, and studied liver biopsies to assess the severity of liver disease in NAFLD patients found that elevated serum ALT was strongly associated with liver fat content, but not with inflammation, hepatocyte ballooning, or liver fibrosis.[13] It has therefore been proposed that serum ALT might be a good indicator of NAFLD[13] and a predictor of cardio-metabolic disorders, regardless of the possible progression to steatohepatitis or liver cirrhosis.[17,20] Unfortunately, most studies on the sensitivity and specificity of serum ALT as a biomarker of NAFLD were aimed at identifying nonalcoholic steatohepatitis,[23,47] whereas others exclusively used abdominal ultrasound to assess liver fat content,[25,26,48] an operator-dependent method that offers inadequate sensitivity and specificity in cases of mild and moderate NAFLD and more importantly, does not provide a quantification of liver triglyceride content.[29,31] Likewise, indexes developed to detect NAFLD have not proven useful for routine clinical practice in the general population due to their high complexity.[49] Our study provides the first report on the diagnostic accuracy, sensitivity, and specificity of serum ALT as a biomarker of NAFLD in healthy individuals from the general population using 1H-MRS for liver triglyceride quantification. In our study, in addition to the strong correlation between serum ALT and liver triglyceride content, regression analysis showed that serum ALT was the main predictor of NAFLD even after adjustment for sex, age, BMI, and waist circumference. Furthermore, the ROC curve yielded an AUC of 0.93 and showed that serum ALT value ≥23 IU/L predicted the presence of NAFLD, with a sensitivity of 0.94 and specificity of 0.72. We found that 48% of individuals with serum ALT below 40 IU/L had NAFLD, and these individuals had significantly elevated HOMA-IR and lower serum levels of adiponectin and HDL-cholesterol with respect to those with serum ALT below 23 IU/L. These findings support proposals to reduce the threshold for “normal” serum ALT.[17,21] Only 10% of participants with ALT below 23 IU/L had NAFLD, suggesting that this threshold would identify the large majority of individuals with hepatic steatosis. The detection of NAFLD is important to allow clinical counseling on the risk of insulin resistance, T2DM, and coronary heart disease.
The major strengths of this study are that 1H-MRS was used to quantify liver triglyceride content, and study subjects met strict exclusion criteria. In addition, the anthropometric, biochemical, and 1H-MRS measurements were performed within a 24-hour period.
Limitations of this study include the relatively high proportion of participants with NAFLD, possibly because most individuals in the eligible population had normal blood analyses and may therefore have been less willing to participate in comparison with those with elevated ALT values. We also acknowledge that this was a cross-sectional study based on biochemical determinations at a single time point in each participant. It proved possible to classify participants into different groups with adequate statistical power, but the sample size was relatively small, and further studies in wider samples and with an independent validation cohort are required to verify our findings and to establish how well these results apply to a different subset of patients.
5. Conclusions
In conclusion, this study shows that serum ALT is a sensitive, simple, and reliable biomarker of NAFLD if the normal ALT value is revised and established at a lower level. Thus, in the present series of healthy individuals, an ALT threshold of 23 IU/L identified 94% of participants with NAFLD, who might be more at risk of cardiometabolic events, allowing the appropriate clinical counseling to the identified individuals. The low cost and wide availability of this screening test facilitate its routine application in primary care.
Footnotes
Abbreviations: 1H-MRS = proton magnetic resonance spectroscopy, ALP = alkaline phosphatase, ALT = alanine aminotransferase, AST = aspartate aminotransferase, AUC = area under the curve, BMI = body mass index, CI = confidence interval, CVD = cardiovascular disease, FF = fat fraction, GGT = gamma-glutamyl transferase, HBV = hepatitis B virus, HCV = hepatitis C virus, HDL = high-density lipoprotein, HOMA-IR = Homeostatic Model Assessment for Insulin Resistance, MetS = metabolic syndrome, NAFLD = nonalcoholic fatty liver disease, NASH = nonalcoholic steatohepatitis, NPV = negative predictive value, PPV = positive predictive value, ROC = receiver-operating characteristic, SD = standard deviation, STEAM = stimulated echo acquisition mode sequence, T2DM = type 2 diabetes mellitus, TNF = tumor necrosis factor.
Author contributions: All authors participated in the data collection, analysis, and manuscript preparation. All authors approve the final version of the manuscript.
Funding: This research did not receive any specific grant from any funding agency in the public, commercial, or not-for-profit sector.
The authors report no conflicts of interest.
References
- [1].Chalasani N, Younossi Z, Lavine JE, et al. The diagnosis and management of non-alcoholic fatty liver disease: Practice guideline by the American Gastroenterological Association, American Association for the Study of Liver Diseases, and American College of Gastroenterology. Gastroenterology 2012;142:1592–609. [DOI] [PubMed] [Google Scholar]
- [2].Starley BQ, Calcagno CJ, Harrison SA. Nonalcoholic fatty liver disease and hepatocellular carcinoma: a weighty connection. Hepatology 2010;51:1820–32. [DOI] [PubMed] [Google Scholar]
- [3].Lee JY, Kim KM, Lee SG, et al. Prevalence and risk factors of non-alcoholic fatty liver disease in potential living liver donors in Korea: a review of 589 consecutive liver biopsies in a single center. J Hepatol 2007;47:239–44. [DOI] [PubMed] [Google Scholar]
- [4].Browning JD, Szczepaniak LS, Dobbins R, et al. Prevalence of hepatic steatosis in an urban population in the United States: impact of ethnicity. Hepatology 2004;40:1387–95. [DOI] [PubMed] [Google Scholar]
- [5].Vernon G, Baranova A, Younossi ZM. Systematic review: the epidemiology and natural history of non-alcoholic fatty liver disease and non-alcoholic steatohepatitis in adults. Aliment Pharmacol Ther 2011;34:274–85. [DOI] [PubMed] [Google Scholar]
- [6].Adams LA, Lymp JF, Sauver StJ, et al. The natural history of nonalcoholic fatty liver disease: a population-based cohort study. Gastroenterology 2005;129:113–21. [DOI] [PubMed] [Google Scholar]
- [7].Williams CD, Stengel J, Asike MI, et al. Prevalence of nonalcoholic fatty liver disease and nonalcoholic steatohepatitis among a largely middle-aged population utilizing ultrasound and liver biopsy: a prospective study. Gastroenterology 2011;140:124–31. [DOI] [PubMed] [Google Scholar]
- [8].Rafiq N, Bai C, Fang YUN, et al. Long-term follow-up of patients with nonalcoholic fatty liver. YJCGH 2009;7:234–8. [DOI] [PubMed] [Google Scholar]
- [9].Clark JM, Brancati FL, Diehl AM. The prevalence and etiology of elevated aminotransferase levels in the United States. Am J Gastroenterol 2003;98:960–7. [DOI] [PubMed] [Google Scholar]
- [10].Leite NC, Salles GF, Araujo ALE, et al. Prevalence and associated factors of non-alcoholic fatty liver disease in patients with type-2 diabetes mellitus. Liver Int 2009;29:113–9. [DOI] [PubMed] [Google Scholar]
- [11].Marchesini G, Brizi M, Bianchi G, et al. Nonalcoholic fatty liver disease: a feature of the metabolic syndrome. Diabetes 2001;50:1844–50. [DOI] [PubMed] [Google Scholar]
- [12].Bedogni G, Miglioli L, Masutti F, et al. Prevalence of and risk factors for nonalcoholic fatty liver disease: the Dionysos nutrition and liver study. Hepatology 2005;42:44–52. [DOI] [PubMed] [Google Scholar]
- [13].Maximos M, Bril F, Portillo Sanchez P, et al. The role of liver fat and insulin resistance as determinants of plasma aminotransferase elevation in nonalcoholic fatty liver disease. Hepatology 2015;61:153–60. [DOI] [PubMed] [Google Scholar]
- [14].Targher G, Day CP, Bonora E. Risk of cardiovascular disease in patients with nonalcoholic fatty liver disease. N Engl J Med 2010;363:1341–50. [DOI] [PubMed] [Google Scholar]
- [15].Goland S, Shimoni S, Zornitzki T, et al. Cardiac abnormalities as a new manifestation of nonalcoholic fatty liver disease: echocardiographic and tissue Doppler imaging assessment. J Clin Gastroenterol 2006;40:949–55. [DOI] [PubMed] [Google Scholar]
- [16].Liu J, Fox CS, Hickson D, et al. Fatty liver, abdominal visceral fat, and cardiometabolic risk factors: the Jackson Heart Study. Arterioscler Thromb Vasc Biol 2011;31:2715–22. [DOI] [PMC free article] [PubMed] [Google Scholar]
- [17].Goessling W, Massaro J. Aminotransferase levels and 20-year risk of metabolic syndrome, diabetes, and cardiovascular disease. Gastroenterology 2008;135:1935–44. [DOI] [PMC free article] [PubMed] [Google Scholar]
- [18].Portillo Sanchez P, Bril F, Maximos M, et al. High prevalence of nonalcoholic fatty liver disease in patients with type 2 diabetes mellitus and normal plasma aminotransferase levels. J Clin Endocrinol Metab 2015;100:2231–8. [DOI] [PMC free article] [PubMed] [Google Scholar]
- [19].Vozarova B, Stefan N, Lindsay RS, et al. High alanine aminotransferase is associated with decreased hepatic insulin sensitivity and predicts the development of type 2 diabetes. Diabetes 2002;51:1889–95. [DOI] [PubMed] [Google Scholar]
- [20].Schindhelm RK, Dekker JM, Nijpels G, et al. Alanine aminotransferase predicts coronary heart disease events: a 10-year follow-up of the Hoorn Study. Atherosclerosis 2007;191:391–6. [DOI] [PubMed] [Google Scholar]
- [21].Ioannou GN. Implications of elevated serum alanine aminotransferase levels: think outside the liver. Gastroenterology 2008;135:1851–4. [DOI] [PubMed] [Google Scholar]
- [22].Prati D, Taioli E, Zanella A, et al. Updated definitions of healthy ranges for serum alanine aminotransferase levels. Ann Intern Med 2002;137:1–0. [DOI] [PubMed] [Google Scholar]
- [23].Kunde SS, Lazenby AJ, Clements RH, et al. Spectrum of NAFLD and diagnostic implications of the proposed new normal range for serum ALT in obese women. Hepatology 2005;42:650–6. [DOI] [PubMed] [Google Scholar]
- [24].Kang HS, Um SH, Seo YS, et al. Healthy range for serum ALT and the clinical significance of “unhealthy” normal ALT levels in the Korean population. J Gastroenterol Hepatol 2011;26:292–9. [DOI] [PubMed] [Google Scholar]
- [25].Wu W-C, Wu C-Y, Wang Y-J, et al. Updated thresholds for serum alanine aminotransferase level in a large-scale population study composed of 34,346 subjects. Aliment Pharmacol Ther 2012;36:560–8. [DOI] [PubMed] [Google Scholar]
- [26].Miyake T, Kumagi T, Hirooka M, et al. Metabolic markers and ALT cutoff level for diagnosing nonalcoholic fatty liver disease: a community-based cross-sectional study. J Gastroenterol 2012;47:696–703. [DOI] [PubMed] [Google Scholar]
- [27].Szczepaniak LS, Nurenberg P, Leonard D, et al. Magnetic resonance spectroscopy to measure hepatic triglyceride content: prevalence of hepatic steatosis in the general population. Am J Physiol Endocrinol Metab 2005;288:E462–8. [DOI] [PubMed] [Google Scholar]
- [28].Reeder SB. Quantitative assessment of liver fat with magnetic resonance. J Magn Reson Imaging 2012;34:1–38. [DOI] [PMC free article] [PubMed] [Google Scholar]
- [29].Schwenzer NF, Springer F, Schraml C, et al. Non-invasive assessment and quantification of liver steatosis by ultrasound, computed tomography and magnetic resonance. J Hepatol 2009;51:433–45. [DOI] [PubMed] [Google Scholar]
- [30].Szczepaniak LS, Babcock EE, Schick F, et al. Measurement of intracellular triglyceride stores by H spectroscopy: validation in vivo. Am J Physiol 1999;276(5 Pt 1):E977–89. [DOI] [PubMed] [Google Scholar]
- [31].Dasarathy S, Dasarathy J, Khiyami A, et al. Validity of real time ultrasound in the diagnosis of hepatic steatosis: a prospective study. J Hepatol 2009;51:1061–7. [DOI] [PMC free article] [PubMed] [Google Scholar]
- [32].Martín-Rodríguez JL, Arrebola JP, Jiménez-Moleón JJ, et al. Sonographic quantification of a Hepato-Renal Index for the assessment of hepatic steatosis in comparison with 3T proton magnetic resonance spectroscopy. Eur J Gastroenterol Hepatol 2014;26:88–94. [DOI] [PubMed] [Google Scholar]
- [33].Matthews DR, Hosker JP, Rudenski AS, et al. Homeostasis model assessment: insulin resistance and beta-cell function from fasting plasma glucose and insulin concentrations in man. Diabetologia 1985;28:412–9. [DOI] [PubMed] [Google Scholar]
- [34].Roldan-Valadez E, Favila R, Martínez-López M, et al. In vivo 3T spectroscopic quantification of liver fat content in nonalcoholic fatty liver disease: Correlation with biochemical method and morphometry. J Hepatol 2010;53:732–7. [DOI] [PubMed] [Google Scholar]
- [35].Van Werven JR, Marsman Ha, Nederveen AJ, et al. Hepatic lipid composition analysis using 3.0-T MR spectroscopy in a steatotic rat model. Magn Reson Imaging 2012;30:112–21. [DOI] [PubMed] [Google Scholar]
- [36].Bohte AE, van Werven JR, Bipat S, et al. The diagnostic accuracy of US, CT, MRI and 1H-MRS for the evaluation of hepatic steatosis compared with liver biopsy: a meta-analysis. Eur Radiol 2011;21:87–97. [DOI] [PMC free article] [PubMed] [Google Scholar]
- [37].Noureddin M, Lam J, Peterson MR, et al. Utility of magnetic resonance imaging versus histology for quantifying changes in liver fat in nonalcoholic fatty liver disease trials. Hepatology 2013;58:1930–40. [DOI] [PMC free article] [PubMed] [Google Scholar]
- [38].Omelchenko E, Gavish D, Shargorodsky M. Adiponectin is better predictor of subclinical atherosclerosis than liver function tests in patients with nonalcoholic fatty liver disease. J Am Soc Hypertens 2014;8:376–80. [DOI] [PubMed] [Google Scholar]
- [39].Klein M, Iazzettii L, Speiser P, et al. Alanine transferase: an independent indicator of adiposity related comorbidity risk in youth. J Diabetes 2015;7:649–56. [DOI] [PubMed] [Google Scholar]
- [40].Arulanandan A, Ang B, Bettencourt R, et al. Association between quantity of liver fat and cardiovascular risk in patients with nonalcoholic fatty liver disease independent of nonalcoholic steatohepatitis. Clin Gastroenterol Hepatol 2015;13:1513–20. [DOI] [PubMed] [Google Scholar]
- [41].Wannamethee SG, Shaper AG, Lennon L, et al. Hepatic enzymes, the metabolic syndrome, and the risk of type 2 diabetes in older men. Diabetes Care 2005;28:2913–8. [DOI] [PubMed] [Google Scholar]
- [42].Ozcelik F, Yuksel C, Arslan E, et al. Relationship between visceral adipose tissue and adiponectin, inflammatory markers and thyroid hormones in obese males with hepatosteatosis and insulin resistance. Arch Med Res 2013;44:273–80. [DOI] [PubMed] [Google Scholar]
- [43].Gonzalez-Calvin JL, Gallego-Rojo F, Fernandez-Perez R, et al. Osteoporosis, mineral metabolism, and serum soluble tumor necrosis factor receptor p55 in viral cirrhosis. J Clin Endocrinol Metab 2004;89:4325–30. [DOI] [PubMed] [Google Scholar]
- [44].González-Calvin JL, Mundi JL, Casado-Caballero FJ, et al. Bone mineral density and serum levels of soluble tumor necrosis factors, estradiol, and osteoprotegerin in postmenopausal women with cirrhosis after viral hepatitis. J Clin Endocrinol Metab 2009;94:4844–50. [DOI] [PubMed] [Google Scholar]
- [45].Hui JM, Hodge A, Farrell GC, et al. Beyond insulin resistance in NASH: TNF-α or adiponectin? Hepatology 2004;40:46–54. [DOI] [PubMed] [Google Scholar]
- [46].Fernández-Real JM, Broch M, Ricart W, et al. Plasma levels of the soluble fraction of tumor necrosis factor receptor 2 and insulin resistance. Diabetes 1998;47:1757–62. [DOI] [PubMed] [Google Scholar]
- [47].Dixon JB, Bhathal PS, O’Brien PE. Nonalcoholic fatty liver disease: predictors of nonalcoholic steatohepatitis and liver fibrosis in the severely obese. Gastroenterology 2001;121:91–100. [DOI] [PubMed] [Google Scholar]
- [48].Nomura K, Yano E, Shinozaki T, et al. Efficacy and effectiveness of liver screening program to detect fatty liver in the periodic health check-ups. J Occup Health 2004;46:423–8. [DOI] [PubMed] [Google Scholar]
- [49].Ruhl CE, Everhart JE. Fatty liver indices in the multiethnic United States National Health and Nutrition Examination Survey. Aliment Pharmacol Ther 2015;41:65–76. [DOI] [PubMed] [Google Scholar]


