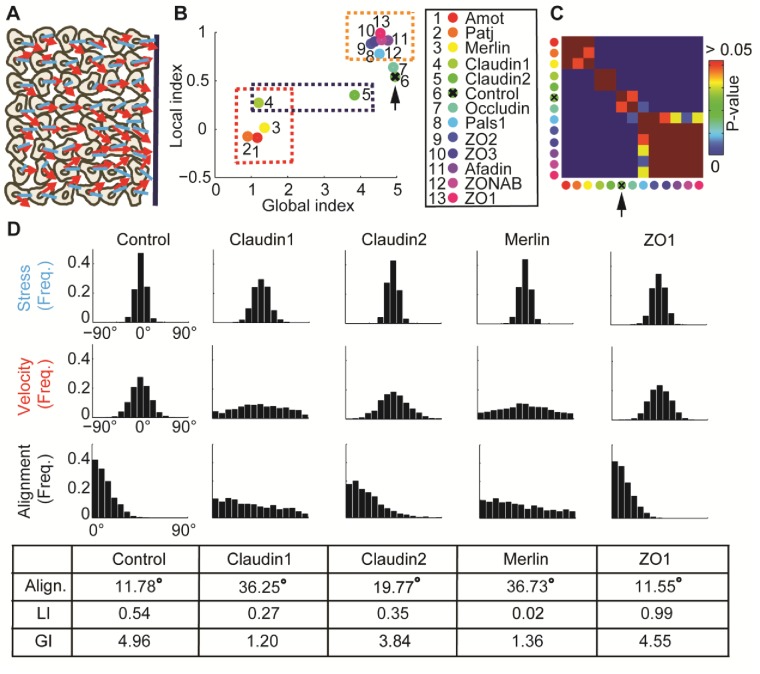
Figure 4. : Alignment of stress orientation and velocity direction during collective cell migration.
(A) Assay illustration. Wound healing assay of MDCK cells. Particle image velocimetry was applied to calculate velocity vectors (red) and monolayer stress microscopy to reconstruct stresses (blue). Alignment of velocity direction and stress orientation was assessed. (B) Mini-screen that includes depletion of 11 tight-junction proteins and Merlin. Data from (Das et al., 2015), where effective depletion was demonstrated. Shown are GI and LI values; molecular conditions are sorted by the LI values (control is ranked sixth, pointed by the black arrow). Each dot was calculated from accumulation of 3 independent experiments (N = 925–1539 for each condition). Three groups of tight junction proteins are highlighted by dashed rectangles: red - low LI and GI compared to control, purple – different GI but similar LI, orange – high LI. All DeBias analyses were performed with K = 15. (C) Pair-wise statistical significance for LI values. P-values were calculated via a permutation-test on the velocity and stress data (Materials and methods). Red – no significant (p ≥ 0.05) change in LI values, blue – highly significant (< 0.01) change in LI values. (D) Highlighted hits: Claudin1, Claudin2, Merlin and ZO1. Top: Distribution of stress orientation (top), velocity direction (middle) and motion-stress alignment (bottom). Bottom: table of mean alignment angle, LI and GI. Claudin1 and Claudin2 have similar mechanisms for transforming stress to aligned velocity. ZO1 depletion enhances alignment of velocity by stress.

