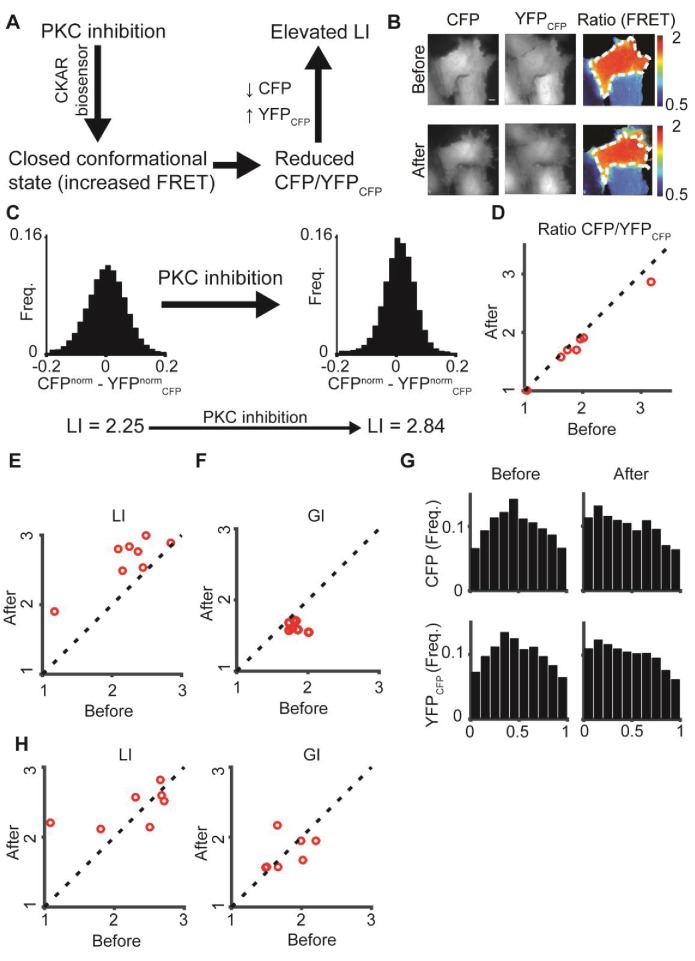
Figure 5. : PKC inhibition alters LI and GI.
(A) PKC inhibition is expected to lead to elevated LI for cells with dominant CFP signal (CFP > YFPCFP). Upon FRET, CFP signal is locally transferred to YFPCFP, reducing the difference in normalized intensity between the two channels, which increases LI. (B) hTERT-RPE-1 cells imaged with the CKAR reporter. A cell before (top) and after (bottom) PKC inhibition. Region of interest was manually annotated and the ratio was calculated within it. (C) Pixel distribution of differences in normalized fluorescent intensities CFPnorm - YFPnormCFP before and after PKC inhibition for the cell from panel B. PKC inhibition shifted the average absolute difference from 0.054 to 0.042 and the LI from 2.25 to 2.84. (D–F) PKC inhibition experiment. N = 8 cells. Statistics based on Wilcoxon sign-rank test. (D) The FRET ratio decreased (p-value < 0.008), (E) LI increased (p-value < 0.008), and (F) GI decreased (p-value < 0.008) after PKC inhibition. (G) Marginal distribution of CFP and YFPCFP before (top) and after (bottom) PKC inhibition. (H) Control experiment. N = 7 cells. hTERT-RPE-1 cells expressing cytoplasmic GFP and mCherry before and after PKC inhibition. No significant change in LI or GI was observed. All DeBias analyses were performed with K = 19.

