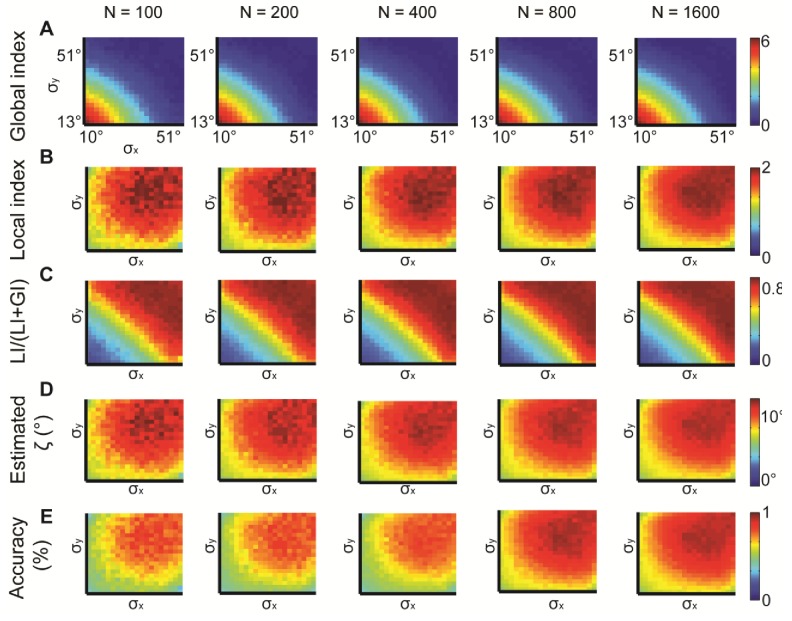
Appendix 2—figure 3. Simulations for different N, the number of observations.
N = 100, 200, 400, 800, 1600 were examined. normal distributions with different and constant = 15°. All measures provide similar information but are noisier for lower N. (A) Global index. (B) Local index. (C) Relative contribution of LI to the observed alignment. (D) Retrieved estimated ζ. (E) Accuracy of estimated ζ.

