Abstract
Histones invoke strong proinflammatory responses in many different organs and cells. We assessed biological responses to purified or recombinant histones, using human and murine phagocytes and mouse lungs. H1 had the strongest ability in vitro to induce cell swelling independent of requirements for toll-like receptors (TLRs) 2 or 4. These responses were also associated with lactate dehydrogenase release. H3 and H2B were the strongest inducers of [Ca2+]i elevations in phagocytes. Cytokine and chemokine release from mouse and human phagocytes was predominately a function of H2A and H2B. Double TLR2 and TLR4 knockout (KO) mice had dramatically reduced cytokine release induced in macrophages exposed to individual histones. In contrast, macrophages from single TLR-KO mice showed few inhibitory effects on cytokine production. Using the NLRP3 inflammasome protocol, release of mature IL-1β was predominantly a feature of H1. Acute lung injury following the airway delivery of histones suggested that H1, H2A, and H2B were linked to alveolar leak of albumin and the buildup of polymorphonuclear neutrophils as well as the release of chemokines and cytokines into bronchoalveolar fluids. These results demonstrate distinct biological roles for individual histones in the context of inflammation biology and the requirement of both TLR2 and TLR4.
Keywords: Histone, Biological response, Phagocyte, Toll-like receptor, Cytokine release
Introduction
Extracellular histones are increasingly viewed as important factors in infectious and noninfectious (“sterile”) sepsis, the latter developing after hemorrhagic shock, nonpenetrating trauma, ischemia-reperfusion injury, and other situations [1]. The toxic effects of histones, as cationic proteins and membrane-active agents, were described many decades ago [2, 3, 4]. Histones appear to function as DAMPs (damage-associated molecular patterns), and are thought to react with toll-like receptors (TLRs) 2 and 4, and perhaps other TLRs, to induce a variety of biological responses in a variety of cell types, although details of these interactions are insufficient for a full understanding of the mechanisms involved [5, 6, 7, 8, 9]. Extracellular histones are known to have strong proinflammatory and procoagulant activities [7, 10, 11, 12, 13, 14]. In recent studies, the instillation of histones into the airways caused acute lung injury (ALI) with intense inflammation, alveolar edema, venous thrombosis, and severe defects in gas exchange [15]. The intravenous infusion of histones caused thrombus formation in arterioles and capillaries of the lungs, sometimes resulting in acute right heart dilatation and failure that can be fatal [14]. It is also known that histones can damage vascular endothelial and alveolar epithelial cells [13, 14, 15, 16, 17, 18], causing reduced barrier function in the lung. Histone presence has been associated with multiorgan failure [9, 10, 11, 16, 17, 19]. It has long been known that histones also have bacteriostatic and bactericidal activities [20], thus amplifying responses of the innate immune system. Histone mixtures have been employed in most published studies of biological responses. These mixtures usually consist of all 5 histones (H1, H2A, H2B, H3, H4). Based on the recent availability of recombinant or purified histones, it has been possible to study the biological responses induced by individual histones using technical approaches that appear to exclude a role for contaminating lipopolysaccharide (LPS) [21].
It is also known that histones undergo post-translational modifications (the addition or deletion of methyl or acetate groups), which may result in changes in functional responses to histones [22, 23]. In addition, arginine residues may undergo deiminase caused by PAD4 (peptidyl deiminase 4) in neutrophils, converting arginine to citrulline [24]. Such changes may lead to the appearance of autoantibodies reactive with citrulline-containing histones, which may cause autoimmune complications [25, 26].
In the current study, we used purified or recombinant histones in order to define their ability to trigger biological responses in phagocytic cells (polymorphonuclear neutrophils - PMNs, and macrophages), as well as their ability to induce ALI.
Materials and Methods
Animals
Male C57BL/6 wild-type (wt) and knockout (KO) mice were purchased from The Jackson Laboratory (Bar Harbor, ME, USA). Mice (9–12 weeks old, 25–30 g) were housed 5 per cage under conditions that were free of specific pathogens. Male pathogen-free Sprague-Dawley rats (250–300 g) were purchased from Harlan Laboratories (Indianapolis, IN, USA). The animals were provided with a standard food diet and water. All animals were maintained according to protocols approved by the University of Michigan Committee on the Use and Care of Animals and in accordance with the National Institutes of Health institutional guidelines. The KO mice used in the current studies were TLR2−/−, TLR4−/−, and TLR2/4−/−, purchased from the Jackson Laboratory or provided by Dr. Gabriel Nuñez.
Thioglycollate-induced peritonitis was initiated by intraperitoneal injection of 1.5 mL of 4% sterile thioglycollate (Becton Dickinson & Company, Sparks, MD, USA). Leukocytes were collected 4 h after intraperitoneal thioglycollate instillation for the isolation of peritoneal neutrophils and 4 days after thioglycollate instillation for isolating peritoneal exudate macrophages (PEMs). PMNs and PEMs were isolated and prepared as described previously [21]. Briefly, at the appropriate time points, after euthanizing the mice, elicited cells were harvested by peritoneal lavage with cold Ca2+/mg2+-free PBS, and then centrifuged at 1,500 rpm for 5 min to isolate the cells. The cell pellet was washed in PBS and resuspended in RPMI 1640 (Gibco, Grand Island, NY, USA) supplemented with 0.1% BSA (bovine serum albumin). For isolating the macrophages, the peritoneal cells were allowed to adhere to the plate through culturing for 2 h at 37°C [27]. The nonadherent cells were removed by gentle washing with warm PBS. The remaining cells, confirmed to be mainly (>90%) macrophages by F4/80 staining, were cultured and stimulated with individual histones.
Mouse PMNs were also harvested from bone marrow by flushing femurs with Hanks' balanced salt solution (HBSS, Gibco). Erythrocytes were lysed in hypotonic buffer. The cells were washed in PBS and layered on Histopaque 1077 (Sigma-Aldrich, St. Louis, MO, USA) for density gradient centrifugation (500 g, 30 min, 4°C). The pellet (PMNs) was washed with PBS prior to downstream applications. PMN purity was 85 ± 2% as determined by Wright-stained cytospin preparations [28].
For some studies, the SV40-transformed mouse alveolar macrophage cell line, MH-S, was used [29]. MH-S cells were maintained in RPMI 1640 containing 25 mM HEPES, 10% heat-inactivated FBS (fetal bovine serum) and 1% penicillin/streptomycin [29] to be treated with individual histones.
Human Macrophage Cell Lines (U-937 and THP-1)
U-937 and THP-1 monocytic cell lines from American Type Culture Collection (ATCC, Manassas, VA, USA) were cultured in RPMI 1640 containing 10% heat-inactivated FBS, 1% penicillin/streptomycin, modified to contain 10 mM HEPES, 2 mML-glutamine, 1 mM sodium pyruvate, 4,500 mg/L glucose, and 1,500 mg/L sodium bicarbonate (THP-1 had additionally 0.05 mM 2-mercaptoethanol), at 37°C under 5% CO2. U-937 monocytes were differentiated into macrophages using phorbol-12-myristate-13-acetate (PMA; 10 ng/mL) according to the method of Izeboud et al. [30, 31]. Similarly, PMA (10 ng/mL) was used to differentiate THP-1 monocytes according to the method described by Park et al. [32].
Isolation of PMNs from Human Blood
Peripheral venous blood was obtained from healthy human volunteers in tubes containing heparin. PMNs were isolated from whole blood by sedimentation in dextran followed by the hypotonic lysis of residual RBCs, and finally centrifugation after layering the cells on Histopaque 1077 (Sigma-Aldrich). The PMN pellet was washed with PBS prior to the experiments. PMN purity was >90% assessed by Wright-stained cytospin preparations.
Acute Lung Injury
Histone-induced ALI was performed as previously described [15]. Briefly, following anesthetization with ketamine, mice received 100 μg of individual histones (H1, H2A, H2B, H3, H4) intratracheally (i.t.) during inspiration in a volume of 50 μL PBS. Sham control mice received sterile PBS. To assess the leakage of mouse albumin, bronchoalveolar lavage fluids (BALFs) were obtained 8 h later, when albumin leak into the lung peaked, by the slow instillation and retraction of 1 mL of PBS. Neutrophils were counted on a hemocytometer following the lysis of erythrocytes. BALFs were aliquoted and stored at −80°C until use.
After obtaining BALFs, lungs were harvested from mice and inflated with optimum cutting temperature (Fisher Healthcare, Houston, TX, USA) and frozen in liquid nitrogen. The lung tissues were held at −80°C for immunohistochemistry studies. After obtaining the frozen sections (4 µm thick), hematoxylin and eosin (HE) staining was performed to assess the inflammation patterns in lungs induced by ALI.
Isolating PMNs and Macrophages from Murine Airways
For comparing peritoneal macrophages and PMN data with the alveolar phagocytes data, we isolated PMNs and macrophages (PMNs from mice and macrophages from rats) and investigated their responses to different individual histones. Airway mouse PMNs were isolated from BALFs 6 h after the induction of ALI by i.t. injection of 60 μg of LPS. The average yield of the exudate PMNs was 3.3 ± 0.46 × 10⁵ per mouse. For this set of experiments, we used 20 mice to obtain enough PMNs to expose them to different individual histones. Airway macrophages were isolated from rats instead of mice due to the very small number of macrophages present in normal mouse airways. The protocol detail for isolating rat alveolar macrophages from airways has been described elsewhere [33]. Nonadherent cells were removed after 2 h of seeding the harvested cells in a 24-well culture plate. Adherent cells (alveolar macrophages) were treated with different individual histones.
Flow Cytometry
For flow cytometry studies, the cells were assessed using a BD LSR II flow cytometry system (BD Biosciences, San Jose, TX, USA) with Diva Software. Data were analyzed using FlowJo software 7.6.4 (Tree Star, Ashland, OR, USA). In total, 5 × 10⁴ cells (PMNs or macrophages) were analyzed for forward (Fwd) and side scatter properties. The dot plots and figures each show ≥5 × 10⁴ events. For evaluating the histone-induced buildup of intracellular calcium [Ca2+]i, cells were first incubated with Fluo-3 AM (Life Technologies) for 20 min (PEMs at 37°C and PMNs at room temperature). After washing, the cells were incubated with purified histones (50 µg/mL) and evaluated within a few seconds for [Ca2+]i increase by flow cytometry. For the analysis of cell swelling induced by histones the mean of the Fwd scatter was derived, reflecting a shift in cell size. For each flow experiment, triplicate measurements in 3 or more experiments were obtained.
Lactate Dehydrogenase Cytotoxicity Assay
Supernatant fluids were obtained from PMNs or PEMs exposed to purified histones using phenol red-free media (Gibco). The percentage of cytotoxicity (lactate dehydrogenase, LDH, release) from each treatment condition (H1, H2A, H2B, H3, and H4) was measured compared to LDH content in total lysis fluids induced by 0.1% Triton detergent (Sigma-Aldrich). LDH release was measured according to the manufacturer's instructions (Cayman Chemical, Ann Arbor, MI, USA).
ELISAs
Supernatant fluids from histone-exposed PMNs, macrophages or cell lines collected at 4 h, and the levels of the TNF, IL-6, and IL-1β cytokines were measured using ELISA kits (R&D Systems, Minneapolis, MN, USA). Mouse albumin ELISA from Bethyl Laboratories (Montgomery, TX, USA) was used to detect the amount of albumin leak into the lungs according to the manufacturer's instructions. BALFs were also examined for their content of cytokines (TNF, IL-6, and IL-1β) using the ELISA kits.
Reagents
H1 and H3 purified histones were purified from calf thymus which were purchased from Roche (Indianapolis, IN, USA). The rest of the histones (recombinant histones, H2A, H2B, and H4) were purchased from Cayman Chemical. Histone preparations were evaluated for LPS content, as measured by the LAL (Limulus amebocyte lysate) method (Lonza, Basel, Switzerland; Table 1). Histone stocks were dissolved in PBS (pH 7.4) and stored at −80°C until use. LPS (Escherichia coli 0111:B4), PMA, and BSA were from Sigma-Aldrich. All culture media were purchased from Gibco (Life Technologies). Cells were counted using a Neubauer cytometer. Trypan blue (Sigma-Aldrich) was used for viability determination.
Table 1.
Endotoxin levels of histone preparations by the Limulus amebocyte lysate method
| Histone type | Source | Endotoxin levels, EU/50 µg histone1 | Company |
|---|---|---|---|
| H1 | Purified from calf thymus | 0.0551 | Sigma-Roche |
| H2A | Xenopus recombinant | 0.0891 | Cayman Chemical |
| H2B | Xenopus recombinant | 0.0806 | Cayman Chemical |
| H3 | Purified from calf thymus | 0.0006 | Sigma-Roche |
| H4 | Human recombinant | 0.0626 | Cayman Chemical |
Stocks of purified histone concentrations were 1 mg/mL; endotoxin levels were represented as EU/50 protein or histone. In most experiment studies, 50 µg/mL of histones were used. Numbers represent calculated amounts of EU under these conditions.
Statistical Analysis
Data were analyzed and graphed using GraphPad Prism software (v.6, GraphPad, La Jolla, CA, USA). All values are expressed as the mean ± SEM. Significant differences between 2 independent groups were determined using independent t tests and between more than 2 groups using 1-way ANOVA. Differences were considered significant at p < 0.05.
Results
Presence of LPS in Purified and Recombinant Histone Preparations
Table 1 documents the levels of endotoxin present (endotoxin units) in the various purified or recombinant histone preparations, using the LAL assay as described previously [21]. This is a particular concern since H2A, H2B, and H4 were from recombinant sources (Table 1). Since many experiments employed 50 µg of the purified (or recombinant) histones, the table shows the extrapolated endotoxin content (EUs) for each of the histone preparations. The highest EU values were in the Xenopus recombinant histones (H2A, H2B), but even here the values were <0.09 EUs in samples of histones (using 50 µg/mL). In the H1, H3, and H4 preparations, EU values were ≤0.06. To determine what level of contaminating endotoxin would significantly affect our results, a dose-response curve of endotoxin (E. coli 0111:B4 LPS) treatment on mouse PEMs was performed. Endotoxin treatment of PEMs with <1 EU resulted in negligible TNF release after 4 h, as measured by ELISA (online suppl. Fig. 1; for all online suppl. material, see www.karger.com/doi/10.1159000452951). Therefore, we believe that the low level of contaminating endotoxin in histone preparations did not significantly impact the findings of this study.
Induction of Cell Swelling and LDH Release by Histones
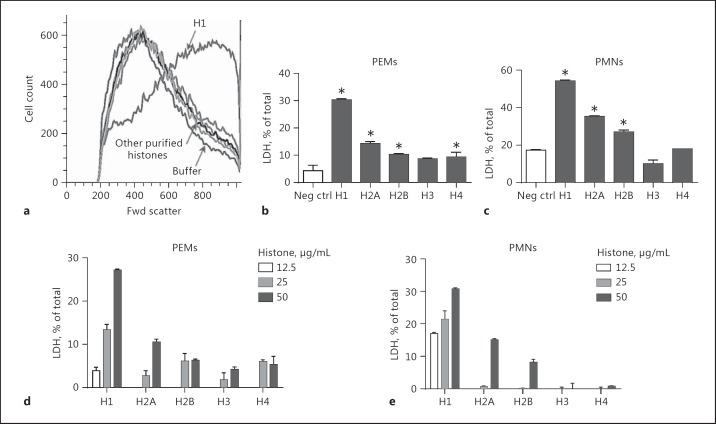
In Figure 1a, mouse PEMs were exposed to various purified histones (50 µg/mL). Fwd light scatter was measured by flow cytometry in order to quantitate cell swelling [21]. It was clear that H1 was the most active histone, while other histones had much less activity. With the exception of H1, other purified histones produced Fwd light scatter patterns close to that of the buffer control (Fig. 1a). PEMs and PMNs were exposed to buffer (negative control) or to various purified histones (50 µg/mL), and LDH release was measured in supernatant fluids, using detergent-lysed cells to calculate 100% release compared to LDH caused by histone presence. For PEMs (Fig. 1b), the most active histone causing LDH release was H1, with much lower LDH release in the presence of the other purified histones. In the case of PMNs (Fig. 1c), negative control cells had relatively low amounts of LDH release (approximately 17%) compared to total cellular LDH, and the rank order of histones causing LDH release from PMNs was H1>H2A>H2B, while H3 and H4 induced very little LDH release, similar to that in the negative controls. Histone concentrations between 12.5 and 50 µg/mL were used on PEMs and PMNs (Fig. 1d, e). The patterns of LDH release induced by histones were dose dependent. Patterns of LDH release were similar to those found in Figure 1b and c, with H1 having the strongest LDH-releasing activity. In general, cell swelling and LDH release were most strongly induced by H1 in a dose-dependent manner and to a lesser extent by other histones, especially H2A and H2B.
Fig. 1.
Cell swelling and LDH release from phagocytes exposed to purified or recombinant histones. Cell swelling and LDH release were quantitated using mouse PEMs and peritoneal PMNs exposed to recombinant/purified histones (50 µg/mL, 4 h at 37°C) (a). Cell swelling was measured by Fwd light scatter in flow cytometry while total LDH in cell lysates was determined by an enzyme-based colorimetric assay (b–e). All frames are representative of results from 4 separate experiments. b–en ≥ 4 separate experiments for each bar. * p < 0.05 compared to the negative controls (white bars representing cells incubated with buffer; b, c). d, e Limited dose responses for histone-induced release of LDH. LDH was measured in cell supernatant fluids and in lysates (detergent induced 100% lysis control) to obtain the percent release of LDH, as determined by ELISA.
Cell Swelling and LDH Release Do Not Require TLR2 or TLR4
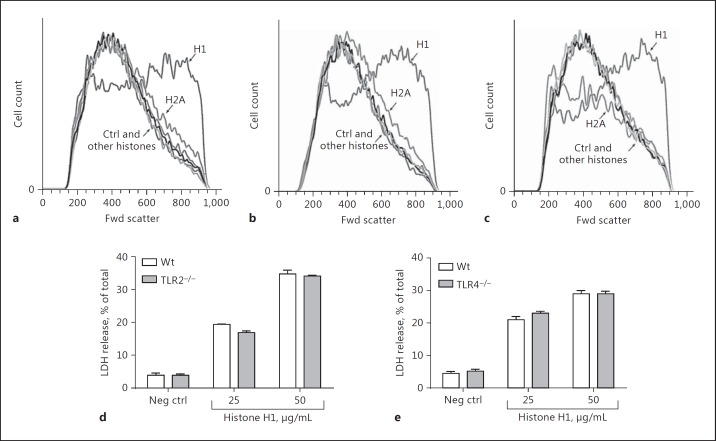
Since TLR2 and TLR4 have been suggested to function as receptors for histones [7, 8, 9], we performed studies in which PEMs from Wt or from TLR2-KO or TLR4-KO mice were exposed to individual histones (50 µg/mL). Wt PEMs (Fig. 2a) as well as TLR2-KO and TLR4-KO PEMs were used (Fig. 2b, c), and cell swelling and LDH release were measured. Cell swelling in Wt PEMs exposed to H1 is shown in Figure 2a, in which PEMs were treated with buffer (control) or with H1 (50 µg/mL) or other purified histones (50 µg/mL). Exposure to H1 caused the greatest increased Fwd light scatter (cell swelling). When companion studies were done with TLR2 or TLR4 KO PEMs (Fig. 2b, c), the patterns for the amount of Fwd light scatter in PEMs exposed to H1 were similar to those obtained from Wt PEMs. As shown, cell swelling in macrophages was predominately a function of H1. LDH release was measured in Wt PEMs and compared to PEMs from TLR2-KO (Fig. 2d) and TLR4-KO (Fig. 2e) mice. Whether the H1 concentration was 25 or 50 µg/mL, virtually no differences in LDH release were found between Wt cells and TLR2-KO PEMs (Fig. 2d) or with TLR4-KO PEMs (Fig. 2e). It seems clear that cell swelling and LDH release in PEMs exposed to H1 do not require TLR2 or TLR4.
Fig. 2.
Cell swelling and LDH release from PEMs by H1 is independent of a requirement for TLR2 and TLR4. a–c Cell swelling defined by Fwd light scatter of PEMs exposed to individual histones (50 µg/mL, 4 h, 37°C), using Wt (a), TLR2−/− (b), and TLR4−/− (c) PEMs. d, e LDH release from Wt, TLR2−/−, and TLR4−/− PEMs exposed to H1 (25 or 50 µg/mL, 1 h, 37°C). Each bar represents at least 4 separate experiments.
Reduced PEM Cell Swelling and LDH Release in the Presence of Extracellular Potassium
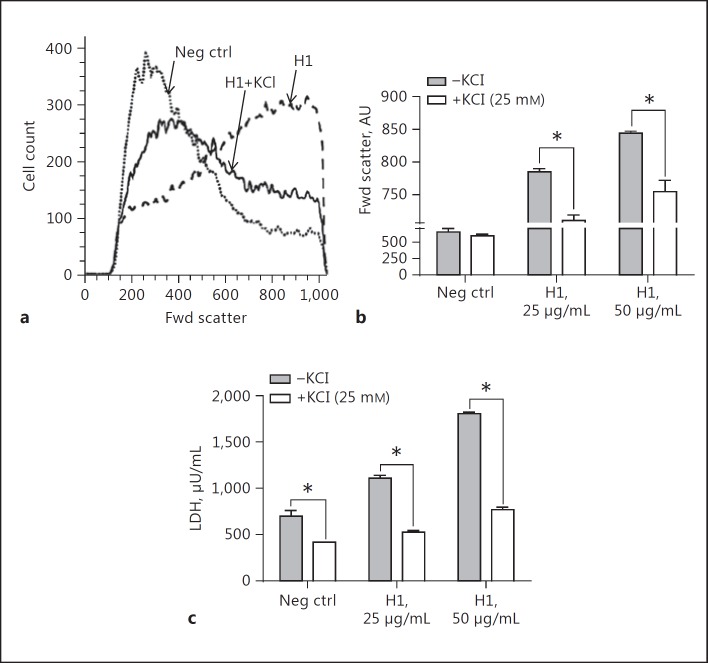
Since we have recently shown that relatively high concentrations of extracellular potassium (K+; 25 mM) sharply reduced the amount of IL-1β released following the stimulation of PEMs with LPS and followed by ATP or histones [21], we studied the inhibitory effects of extracellular potassium chloride (KCl) on cell swelling and LDH release involving PEMs (Fig. 3). The presence of KCl (25 mM) substantially reduced the amount of cell swelling (Fig. 3a, b) and LDH release (Fig. 3c) from PEMs exposed to H1. The data in Figure 3b and c indicate that cell swelling as well as LDH release was dependent on the concentration of H1 employed and that extracellular presence of KCl greatly reduced the cell swelling and release of LDH. These data may relate to suggestions in the literature that cell swelling can be linked to the function of Na+/K+-ATPase, which is blocked by high levels of extracellular KCl that occur during the depolarization of cells [34]. Alternatively, high levels of extracellular KCl may provide osmotic pressure to reduce K+ efflux in the event that H1 acts as a pore-forming protein or otherwise makes the membrane more permeable.
Fig. 3.
Elevation of extracellular KCl reduced the cell swelling intensity and LDH release from macrophages incubated with H1. a For these studies, cell swelling was measured for 4 h at 37°C following the addition of H1. When used, 25 mM of KCl was added to the cell suspensions immediately prior to the addition of H1. b Protective effects on cell swelling in the presence of 25 mM of KCl and H1 (25 and 50 µg/mL). c Ability of KCl to reduce LDH release from PEMs in the presence of buffer or H1 (25 and 50 µg/mL). Each bar represents PEMs from 5 separate cell samples. * p < 0.05.
Histone Induction of Elevations of [Ca2+]i in Phagocytic Cells
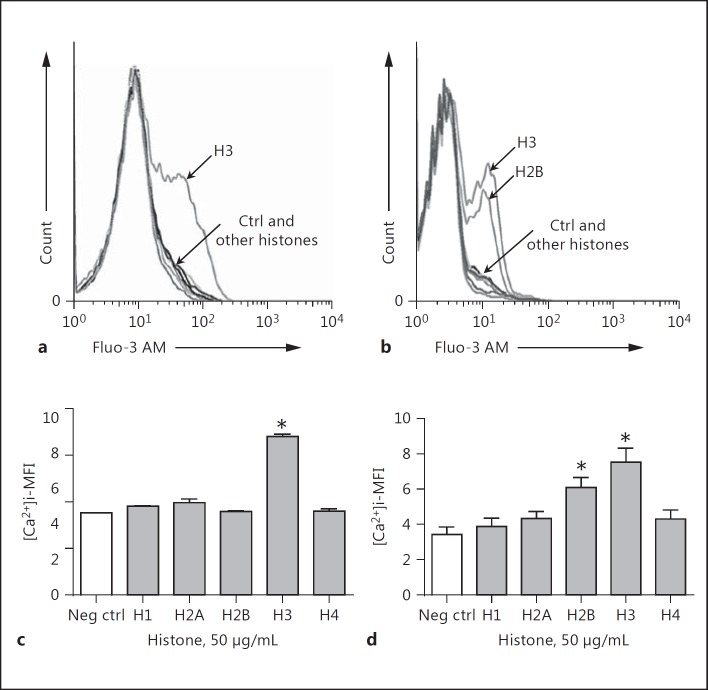
In these studies, we measured the extent to which phagocytic cells (macrophages and bone marrow PMNs) exposed to histones developed increases in [Ca2+]i. Mouse bone marrow PMNs were isolated as described [28] because of the very low levels of PMNs in mouse blood. In Figure 4, mouse macrophages (PEMs; Fig. 4a) and bone marrow PMNs (Fig. 4b) were preloaded with Fluo-3 AM for 20 min and, after washing, the cells were exposed to various purified histones (50 µg/mL) and evaluated for Ca2+ flux immediately (within a few seconds) thereafter by flow cytometry. Figure 4a shows a shift to the right in the Fluo-3 AM signal after exposure of cells to H3, indicating increased [Ca2+]i. For all other histones, the [Ca2+]i levels clustered close to the negative control curve. When bone marrow PMNs were used (Fig. 4b) H3 was a predominant activator of the [Ca2+]i increase, but H2B also induced increases in [Ca2+]i, while the other 4 histones caused limited, if any, increases in [Ca2+]i. When peritoneal exudate PMNs were used, we found results similar to those for bone marrow PMNs (data not shown). It is not clear why PEMs responded only to H3, while the responses in PMNs were also robust in the presence of either H2B as well as H3. The quantitative changes in [Ca2+]i in PEMs (Fig. 4c) and bone marrow PMNs (Fig. 4d) as a function of individual histones as determined by flow cytometry are shown. Figure 4a and c display similar results, namely that H3 was the dominant inducer of [Ca2+]i increases in PEMs. Figure 4d confirms the data in Figure 4b, namely that H3 was a dominant inducer of [Ca2+]i in bone marrow PMNs, closely followed by H2B. These data suggest that, under the experimental conditions employed, H3 is the dominant histone causing elevations in [Ca2+]i in PEMs, while in the case of bone marrow PMNs, H3 as well as H2B induced increased [Ca2+]i. The other histones were essentially inactive. When we used the lower dose of the histones (10 µg/mL instead of 50 µg/mL), H3 was still the predominant histone with this activity, and the signal for H2B from PMNs was low, similar to other purified histones (data not shown). The data suggest that H3 has the dominant but not exclusive activity for causing [Ca2+]i increases in PEMs and PMNs.
Fig. 4.
Ability of purified or recombinant histones to cause increases in [Ca2+]i in mouse PEMs (a, c) or bone marrow PMNs (b, d). Cells were preloaded with Fluo-3 AM and then exposed to individual histones (50 µg/mL). Intracellular fluorescence indicating cytosolic [Ca2+]i was measured by flow cytometry after the addition of histones. c, d Quantitative changes in [Ca2+]i as a result of cell exposure to histones. Each bar represents at least 5 separated cell samples. MFI, mean fluorescence intensity. * p < 0.05.
Cytokine and Chemokine Release from Histone-Activated Macrophages
The data in Table 2 document mediator (cytokines and chemokines) release from mouse PEMs exposed to a variety of concentrations (10–100 µg/mL) of purified histones (37°C, 4 h). This allowed calculations of the EC50 values (effective concentration inducing 50% of the maximal response, which can be calculated when a plateau in mediator release develops). The values shown are the actual concentrations of mediators released from PEMs for each of the purified histones. The release of cytokines (IL-6, TNF, IL-1β) and chemokines (CXCL1 [KC], CXCL2 [MIP-2α], and CCL3 [MIP-1α]) was quantitated by ELISA. A range of doses of individual histones (10–100 µg/mL) was employed in order to construct dose-response curves for the 3 cytokines and 3 chemokines. Histone concentrations causing 50% release (EC50) were computationally determined. When EC50 values were expressed as being beyond the highest indicated histone concentration, this indicated that the responses had not yet reached a plateau. This was predominately the case with IL-1β, resulting in relatively low levels of IL-1β released in comparison to other mediators. The cytokine responses, in general, were lower than the chemokine responses (e.g. when H2A was used as the agonist, IL-6 levels peaked around 610 pg/mL, while chemokine levels peaked between 12,000 and 21,000 pg/mL). IL-1β peak production in PEMs of IL-1β was rather small (0-250 pg/mL). In general, the most effective histones for the induction of mediator release were H2A and H2B. H3 and H4 induced much lower levels of mediator release. Also, when compared to results with H2A and H2B, H1 had reduced activity for cytokine and chemokine release. Given the data in Table 2 in which EC50 values for the histone-induced release of mediators varied over a broad range (5 to >100 µg/mL), it was clear that the biological responses to histones varied with the mediator being measured. Chemokine release was more robust than cytokine release. The mediator pattern suggested that histones caused more chemokine release than cytokine release.
Table 2.
Mediator release from PEMs exposed to purified histones (37° C, 4 h incubation)
| Cytokine/chemokine | H1 | H2A | H2B | H3 | H4 |
|---|---|---|---|---|---|
| IL-6 | |||||
| EC50, µg/mL | >66 | 14 | 10 | >67 | >59 |
| Peak levels, pg/mL | <2 | 609 | 414 | <5 | <7 |
| TNF | |||||
| EC50, µg/mL | 6 | 5 | 5 | >28 | >64 |
| Peak levels, pg/mL | 81 | 1,554 | 1,636 | 121 | 616 |
| IL-1β | |||||
| EC50, µg/mL | >42 | >38 | >47 | >46 | >100 |
| Peak levels, pg/mL | 91 | 183 | 248 | 103 | 0 |
| CXCL1 | |||||
| EC50, µg/mL | 10.2 | 24 | 10 | >50 | >50 |
| Peak levels, pg/mL | 241 | 18,237 | 12,125 | 1,940 | 1,504 |
| CXCL2 | |||||
| EC50, µg/mL | 10 | 25 | 5 | >50 | >50 |
| Peak levels, pg/mL | 1,188 | 17,796 | 19,752 | 4,650 | 3,515 |
| CCL3 | |||||
| EC50, µg/mL | 26 | 5 | 5 | >50 | >50 |
| Peak levels, pg/mL | 47 | 21,684 | 82,712 | 321 | 473 |
EC50, effective concentration causing 50% of the maximal response.
Cytokine Responses to Histones in Human and Mouse Phagocytic Cells
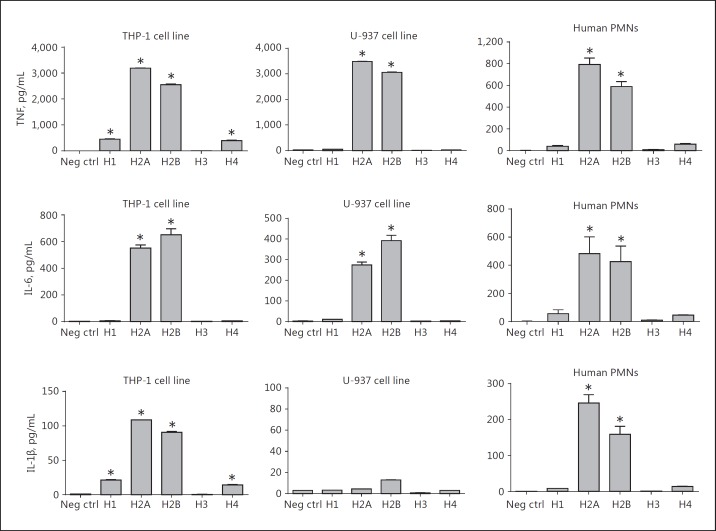
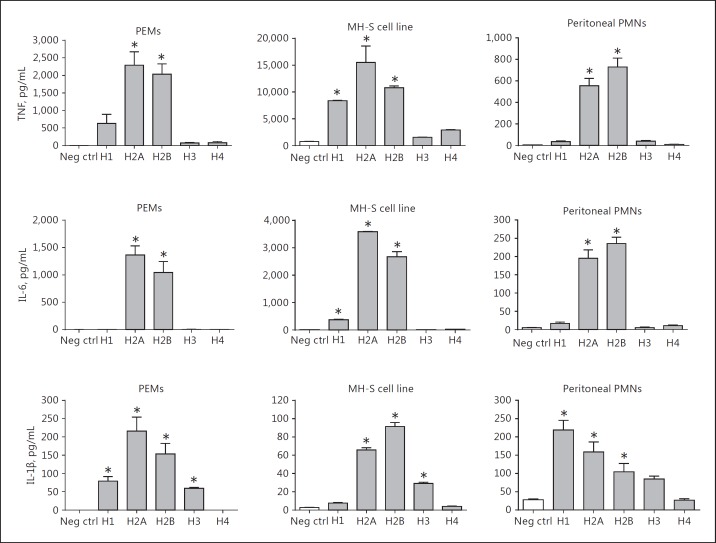
The data in Figure 5 define the release of TNF, IL-6, and IL-1β from the human monocytic cell lines THP-1 (ATCC® TIB-202™) and U-937 (ATCC® CRL-1593.2™). Human PMNs isolated from blood were also assessed. For TNF production, the responses of THP-1 and U-937 cells demonstrated similar results, with H2A and H2B inducing the most robust responses (around 3,000 pg/mL). Human PMNs (from blood) also responded similarly to the same histones, with TNF responses being lower when compared to the THP-1 and U-937 cell lines. For IL-6, all 3 cell types had responses that were quantitatively similar (peaking at 400–600 pg/mL), with H2A and H2B being the most effective agonists. IL-1β production in U-937 cells was extremely low (<20 pg/mL). In general, cytokine production in these 3 cell lines was most robust when H2A or H2B histones were used as agonists (Fig. 5). Similar patterns for cytokine production were found with mouse phagocytic cells (Fig. 6). In the case of mouse phagocytes and the MH-S cell line, the TNF responses revealed H2A and H2B as the most effective agonists, with H1 in some cases causing smaller responses. For IL-6, H2A and H2B consistently induced the most active cytokine responses. For the release of IL-1β, H2A and H2B were also the most active agonists, the exception being in peritoneal PMNs in which H1 seemed to be the most active agonist. Overall, for cytokine release, whether in human or mouse phagocytes, H2A and H2B seemed to induce the most active responses.
Fig. 5.
Cytokine release from human phagocytic cells (THP-1, human monocytes; U937, human myeloid cells; and PMNs purified from human blood) exposed to buffer (negative control) or individual histones (50 µg/mL, 4 h, 37°C) followed by cytokine analysis by ELISA of supernatant fluids. Each bar represents at least 4 separate experiments. The cell number for each sample was 1 × 10⁶/mL. * p < 0.05.
Fig. 6.
Cytokine release from mouse phagocytic cells exposed to purified histones. Conditions similar to those described in Figure 5 were employed, using mouse macrophages, PMNs, and an alveolar mouse macrophage cell line (MH-S). * p < 0.05.
Role of TLR2 and TLR4 in Cytokine Release from PEMs Exposed to Histones
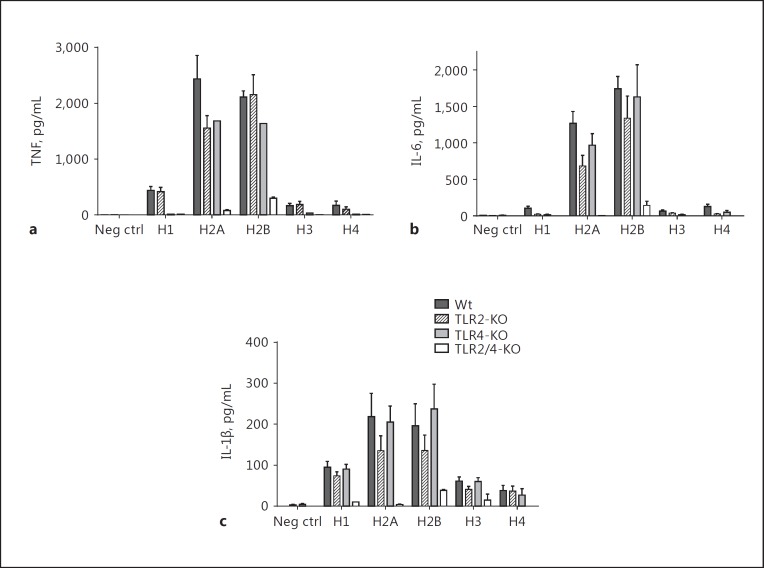
For these studies, mouse PEMs from Wt, TLR2−/−, TLR4−/−, and double-KO mice (TLR2/4−/−) were used. The doses of purified histones selected were 50 µg/mL, based on the dose responses of histones approaching a plateau of cytokine release (Table 2). The data in Figure 7 demonstrate in vitro cytokine production responses (TNF, IL-6, IL-1β) in mouse PEMs from Wt, TLR2−/−, TLR4−/−, and double-KO (TLR2/4−/−) mice. Macrophages (1 × 10⁶/mL) were incubated with buffer (negative control) or with purified histones for 4 h at 37°C. Cell supernatant fluids were then obtained and analyzed by ELISA. Consistent with the data in Figure 6, H2A and H2B were the most active histones for cytokine release from PEMs. It was clear that the most dramatic effects were found in double-KO PEMs, in which case the amount of cytokine released was close to the negative control (buffer) conditions. The individual contributions of TLR2 and TLR4 were quite limited, but the absence of both TLRs dramatically reduced the cytokine responses. These data are similar to reports using bone marrow dendritic cells in which the double-KO cells had dramatically reduced cytokine release induced by cells exposed to histones [9].
Fig. 7.
Cytokine release from mouse peritoneal macrophages from TLR2−/−, TLR4−/−, and TLR2,4−/− exposed to purified histones compared to Wt. Cytokine responses of PEMs including TNF (a), IL-6 (b), and IL-1β (c) in mouse PEMs from Wt, TLR2−/−, TLR4−/−, and double TLR2,4−/− mice. Macrophages (1 × 10⁶/mL) were incubated with buffer (negative control) or with purified histone (50 µg/mL) for 4 h at 37°C. Each bar represents at least 5 separate experiments.
Histones as “Activators” of Inflammasome: IL-1β Production from PEMs and the Role of TLR2 and TLR4
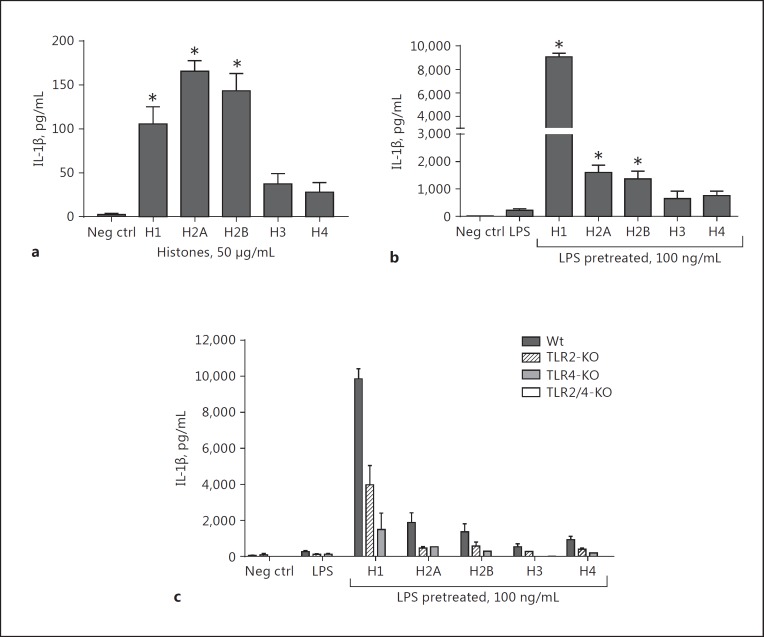
H1, H2A, and H2B caused the release of IL-1β, but the amounts were rather limited (<175 pg/mL; Fig. 8a). To determine if histones were effective in activating the NLRP3 inflammasome, PEMs were first exposed to LPS (100 ng/mL; 37°C for 4 h), followed by the addition of purified histones (50 µg/mL) as “activators” of the inflammasome (37°C for 45 min). The release of mature IL-1β was the endpoint. As shown in Figure 8b, exposure of PEMs only to LPS resulted in the release of approximately 200 pg of IL-1β/mL. When the effects of purified histones as “activators” of the inflammasome were determined following cell exposure to LPS, a robust IL-1β production from PEMs occurred (almost 10-fold more). The most active histone was H1, causing release of approximately 9,000 pg of IL-1β/mL. H2A and H2B were the next most active agonists (causing nearly 1,600 and 1,400 pg IL-1β/mL release, respectively). These data reinforce recent evidence that histones are effective in functioning as “activators” of the NLRP3 inflammasome following cell “priming” with LPS [21]. In Figure 8c, using the same protocol in another set of experiments, PEMs from Wt, TLR2−/−, TLR4−/−, and double-KO (TLR2/4−/−) mice were exposed to LPS (100 ng/mL) for 4 h at 37°C, followed by purified histones for 45 min at 37°C. Not surprisingly, the absence of TLR2 or TLR4 caused reduced responses (around 4,000 and 1,500 pg/mL of IL-1β, respectively) with H1 as the activator, which is consistent with the literature suggesting that TLR2 and TLR4 may be receptors for histones. However, in the absence of both TLR2 and TLR4 (double TLR2/4 KO), the signal was almost completely abolished.
Fig. 8.
Inflammasome protocol for IL-1β production from PEMs exposed to LPS and followed by individual histones (50 µg/mL). For this study, mouse PEMs were exposed to buffer or to LPS (100 ng/mL) for 4 h at 37°C. a The cell response to individual histone exposure after 4 h of incubation at 37°C. b The inflammasome protocol was used, with LPS as the “priming” agent (100 ng/mL) followed by purified histones (50 µg/mL) as the “activators” for 45 min at 37°C. c The inflammasome protocol was used in TLR2−/−, TLR4−/−, and double TLR2/4−/− in addition to Wt. Release of IL-1β was the endpoint, as quantitated by ELISA of the cell supernatant fluid. Each bar represents at least 5 separate samples. * p < 0.05.
ALI Responses to Airway Administered Purified Histones
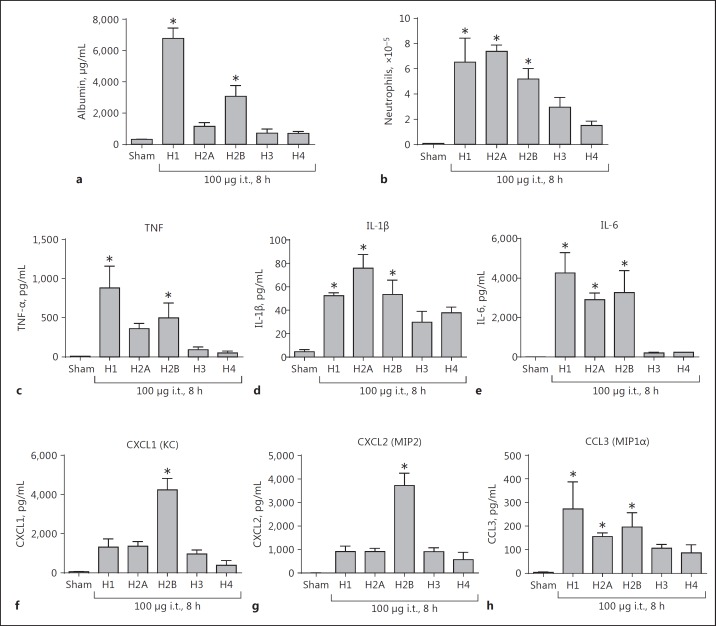
In recent studies, we showed that airway instillation of the histone mix was intensely lung damaging [15]. In Figure 9, purified histones (100 µg given i.t.) were instilled into the airways of Wt mice. BALFs were obtained 8 h later and assessed for leak of mouse albumin (determined by ELISA) and for PMN content. H1 and H2B were the most effective histones that by themselves were capable of inducing substantial ALI as reflected in albumin leak (Fig. 9a). H2A, H3, and H4 caused very low albumin leak compared to that caused by H1. The BALF content of PMNs was determined in the same BALF samples analyzed in Figure 9a and did not completely correlate with the degree of mouse albumin levels in the lung (Fig. 9b). Airway instillation of H1, H2A, and then H2B produced roughly similar levels of PMN accumulation, while H3 and H4 were much less active. The effects of the histone mix on lung induction of ALI are described in our recent publication [15], although we have not studied the effects of mixes of several purified histones.
Fig. 9.
Ability of individual histones to induce ALI (by i.t. instillation of purified histones, 100 µg). BALFs were collected for analysis at 8 h following i.t. instillation of individual histones into the lungs. a Mouse albumin content as assessed by ELISA. b PMN accumulation in BALFs. For each bar, n = 5 separate mice measured using standard microscopy for the enumeration of cells. All mediators were measured by ELISA in BALF cytokines (c–e) and chemokines (f–h). * p < 0.05.
We also assessed the presence of cytokines (TNF, IL-1β, and IL-6; Fig. 9c-e) and chemokines (CXCL1, CXCL2, and CCL3; Fig. 9f-h) in BALF. As shown in Figure 9c, d, e, in general, cytokine appearance in BALF was most intensely expressed after airway instillation of H1, H2A, and H2B. H3 and H4 were much less active. The patterns were fairly similar to those for BALF PMNs (Fig. 9b). With respect to the appearance of chemokines in BALF, the pattern was somewhat chemokine specific. CXCL1 and CXCL2 were predominately expressed after the instillation of H2B, while in the case of CCL3, H1, H2A, and H2B caused similar patterns of expression, but CCL3 expression was <10% of the levels of expression for CXCL1 and CXCL2. It is possible that the chemokines were being expressed by a variety of cell types in the lung. Generally, the lung expression patterns of mediators were rather similar to the expression patterns in PMNs and macrophage described in Figure 6. IL-6 was the most abundantly expressed cytokine, followed by TNF and IL-1β. For chemokines, H2B appeared to be the most consistent inducer of chemokine release, with levels of CXCL1 and CXCL2 being close to 4,000 pg/mL, while levels of CCL3 were much lower.
Cytokine Release from Alveolar Rat Macrophages and Alveolar Mouse Neutrophils Exposed to Histones
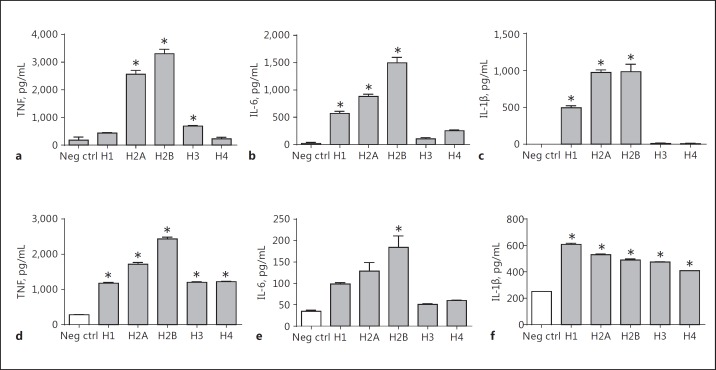
These experiments were extensions of the data in Figure 6 in which mouse phagocytes or cell lines were used to assess the histone-induced release of cytokines from cells. For the additional studies shown in Figure 10, we used alveolar macrophages lavaged from normal rat lungs. Retrieval from normal mouse lungs would have required more than 40 mice for our experiments. We also obtained BALF PMNs from mouse lungs after the induction of ALI. Alveolar macrophages were isolated from rat BALFs (Fig. 10a-c) obtained from normal lungs, while alveolar neutrophils were isolated from mouse BALFs 6 h after inducing ALI by i.t. injection of 60 µg of LPS (Fig. 10d-f). In both experiments, rat macrophages and mouse PMNs from the airways (1 × 10⁶/mL) were incubated with buffer (negative control) or with purified histone (50 µg/mL) for 4 h at 37°C. As shown in Figure 10a, b, c, H2A and H2B consistently induced cytokine appearance while H1 had less biological activity, similar to the data in Figure 6. In the case of mouse PMNs (from LPS-induced ALI lungs), H2A and H2B consistently induced the highest level of TNF and IL-6, with H1 next in the order (Fig. 10d-f). For IL-1β, the descending order of activity was H1>H2A>H2B>H3>H4. Generally the pattern of cytokine production by airway macrophages and neutrophils was in line with those from peritoneal macrophages and neutrophils (Fig. 6).
Fig. 10.
Cytokine release from alveolar rat macrophages and alveolar mouse neutrophils. Alveolar macrophages were isolated from rat BALFs (a–c) and alveolar neutrophils were isolated from mouse BALFs 8 h after inducing ALI by i.t. injection of 60 µg LPS (d–f). In both experiments, rat macrophages and mouse PMNs from the airways were incubated with buffer (negative control) or with purified histone (1 × 10⁶/mL) for 4 h at 37°C. All cytokines were measured by ELISA in BALFs. * p < 0.05.
HE Staining of Lung Tissue from Mice after Inducing ALI by Individual Histones
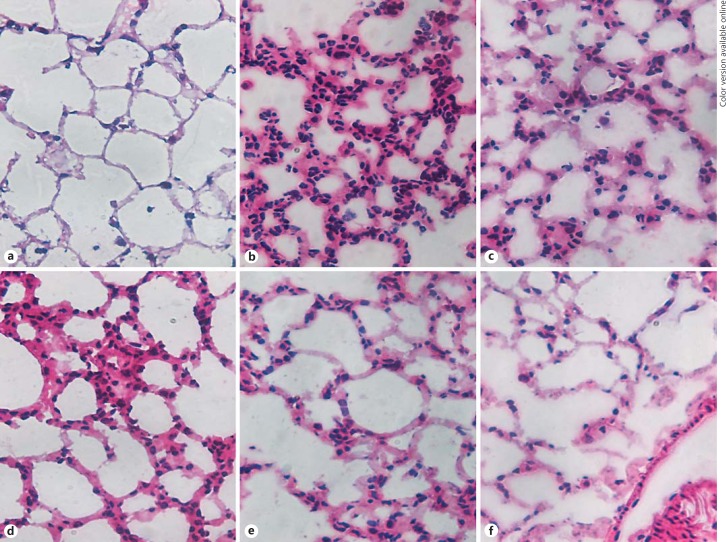
Figure 11a provides morphological features of ALI induced by control buffer (PBS) or purified histones (100 µg, given i.t.). The image shows the appearance of normal lung with very thin alveolar walls and few, if any, leukocytes. At 8 h after H1 instillation, PMN accumulation in alveolar walls and occasionally in alveolar spaces was apparent (Fig. 11b). At 8 h after H2A instillation, PMN accumulation both in alveolar wells and occasionally in alveolar spaces was observed (Fig. 11c), and effects were somewhat similar at 8 h after the instillation of H2B (Fig. 11d). At 8 h after H3 instillation, occasional PMNs in interstitial locations in alveolar walls were demonstrated (Fig. 11e). Finally, Figure 11f shows the effects of H4 (after 8 h of instillation), with only occasional PMNs in the alveolar walls. It appears that H1, H2A, and H2B induced the most robust buildup of PMNs in BALF from mice given purified histones i.t. The morphological data are consistent with those in Figure 9.
Fig. 11.
HE staining of lung tissue from mice after inducing ALI by individual histones. a Histology of control buffer-induced changes in the lung. b–f Histology of the lung and alveolar walls 8 h after i.t. instillation of 100 µg H1 (b), H2A (c), H2B (d), H3 (e), and H4 (f). Original magnification ×40.
Comparative Potency of Individual Histones in Biological Responses
Online supplementary Table S1 is a very simplified display of the various biological activities, with 6 different endpoints (cytokine release, increased [Ca2+]i, cell swelling, LDH release, induction of ALI, and functioning as “activator” of inflammasome protocol). The determinants are listed from +/- (no consistent response) to ++++ (the maximal response). For cytokine release from PMNs or macrophages, H2A and H2B consistently induce the most robust responses (release of TNF, IL-6, and IL-1β). Increased [Ca2+]i in PMNs and macrophages is most robust for H3, followed by H2B (in the case of PMNs). The induction of cell (PMNs, macrophages) swelling and LDH release is predominantly caused by H1. Induction of ALI is most robust with H1, which is also the most robust histone for cell swelling and LDH release. H1 was also the most effective activator of the NLRP3 inflammasome protocol. No information is currently available on how mixtures of 2 or 3 histones will affect biological responses.
Discussion
Extracellular histones play an important role in organ failure after sepsis [35, 36] and are major mediators of death in sepsis [16, 19]. Our recent work on mice [37] as well as that of others on humans [38] indicates that extracellular histones can adversely affect cardiac function, and that the appearance of extracellular histones is linked to evolving cardiac dysfunction during sepsis based on the protective effects of neutralizing mAbs to both H2A and H4 [37]. A major problem in studies of this kind is the lack of quantitative ELISA kits that can identify and quantify individual histones. Until such technology is available, our strategy is to determine the biological activities of purified histones using reliable cell targets such as phagocytic cells in which cytokine (TNF, TIL-6, IL-1β) release can be reliably quantitated. In such studies, it is critical to have histone preparations that are essentially devoid of bacterial LPS, the presence of which would greatly confound the interpretation of results.
Another issue that needs careful attention is the extent to which post-translational modifications develop in histones. One of the changes in histones that occur is the action of the enzyme, PAD4, which converts arginine in histones to citrulline [24], causing autoimmune responses in the setting of autoimmune diseases in mice and in humans [25, 26]. While neutralizing antibodies to citrullinated H4 have been available for several years, there is no comprehensive body of evidence that identifies the extent to which citrullinated histones contain biological activities that are differentiated from noncitrullinated histones.
In spite of all of these constraints, our studies suggest that histones differ significantly in their biological activities. For example, H2A and H2B appear to be especially active in stimulating human, mouse, and rat PMNs and macrophages to release TNF, IL-6, and IL-1β. H1 is the histone with predominant activity for inducing pore formation leading to reversible cell swelling. This is associated with the activation of Na+/K+-ATPase, which causes K+ release. The histones associated with increased [Ca2+]i in PEMs or PMNs are H3 followed by H2B. Regarding cytokines induced by H2A and H2B, it is clear that the double TLR KO involving both TLR2 and TLR4 virtually abolishes cytokine release from PEMs, whereas single KO involving either TLR2 or TLR4 has very limited activity. Such patterns have been previously reported in dendritic cells [9] and reinforce the original observations related to acute ischemic injury of the kidney in which it was postulated that both TLR2 and 4 are receptors for histones [9]. Other biological activities involved in ALI (in this report) have suggested an important role for H1, H2A, and H2B (Fig. 9). While earlier reports using neutralizing mAbs to H4 have suggested that this histone may be related to sepsis [16] and to ALI [15], it is curious that we have not been able to demonstrate a strong in vitro proinflammatory role for H4 in our current studies.
The literature increasingly suggests a broad role for histones in ALI [10, 13, 15], sepsis [16, 19, 37, 38], ischemic injury in kidneys [9], and a likely role for histones in responses to chemical injury of the liver [8]. Based on the lack of sensitive and reliable methods to identify and quantitate the presence of individual histones in a variety of inflammatory responses, when such biomarker measurements for extracellular histones become available, our understanding of the broad biology of histones should be greatly enhanced.
It is not at all clear what the source(s) of these histones is/are in situations such as sepsis, in which microgram quantities of histones appear in plasma [37, 38]. One proven source is PMNs that, when activated, form neutrophil extracellular traps (NETs), containing long strands of DNA associated with elastase, myeloperoxidase, and other products of secondary granules from PMNs [18, 39]. Our own studies have shown that NET formation from PMNs is linked to PMN activation by C5a, which engages C5a receptors [40]. There may also be other ways in which NETs can be formed. Such information may lead to new therapeutic interventions. We have already shown that an antibody that neutralizes H2A and H4 suppresses the development of the cardiomyopathy of sepsis [37]. Once we know more about the histones that are present in pathological conditions, we will have a better idea of histones as therapeutic targets.
Conclusion
Our studies suggest that there is considerable variation in the ability of individual histones to induce biological responses in phagocytic cells and also to produce ALI. It is clear that not all histones can induce the same biological responses (cell swelling and LDH release, production of cytokines and chemokines, increases in [Ca2+]i, and induction of ALI). When reliable ELISA kits are available, obtaining more information about the individual histones present in inflammatory reactions should greatly enhance research efforts that will define the biological roles of histones.
The literature suggests that histones may be ligands for TLR2 and TLR4. Our data indicate that both TLR2 and 4 on phagocytes are required for responses to all individual histones, in line with earlier reports on bone marrow dendritic cells. Although there are substantial constraints to the reliable measurement of levels of individual TLRs and histones by ELISA, it seems clear that the biology of extracellular histones is complex and will likely have therapeutic implications.
Disclosure Statement
The authors declare there are no commercial or financial conflicts of interest related to the studies.
Supplementary Material
Supplementary data
Supplementary data
Acknowledgments
This study was supported by grants from the National Institutes of Health, USA (GM-29507, GM-61656 to P.A.W.) as well as funds provided by the Department of Pathology, University of Michigan Medical School.
We acknowledge support from the UMMS Department of Pathology flow cytometry core facility. We also thank Sue Scott, Melissa Rennells, and Michelle Possley for their excellent assistance in the preparation of the manuscript.
References
- 1.Ward PA. An endogenous factor mediates shock-induced injury. Nat Med. 2013;19:1368–1369. doi: 10.1038/nm.3387. [DOI] [PubMed] [Google Scholar]
- 2.Warren JS, Ward PA, Johnson KJ, Ginsburg I. Modulation of acute immune complex-mediated tissue injury by the presence of polyionic substances. Am J Pathol. 1987;128:67–77. [PMC free article] [PubMed] [Google Scholar]
- 3.Ginsburg I, Gibbs DF, Schuger L, Johnson KJ, Ryan US, Ward PA, Varani J. Vascular endothelial cell killing by combinations of membrane-active agents and hydrogen peroxide. Free Radic Biol Med. 1989;7:369–376. doi: 10.1016/0891-5849(89)90123-8. [DOI] [PubMed] [Google Scholar]
- 4.Ginsburg I, Misgav R, Pinson A, Varani J, Ward PA, Kohen R. Synergism among oxidants, proteinases, phospholipases, microbial hemolysins, cationic proteins, and cytokines. Inflammation. 1992;16:519–538. doi: 10.1007/BF00918977. [DOI] [PubMed] [Google Scholar]
- 5.Tang D, Kang R, Coyne CB, Zeh HJ, Lotze MT. PAMPs and DAMPs: Signal 0s that spur autophagy and immunity. Immunol Rev. 2012;249:158–175. doi: 10.1111/j.1600-065X.2012.01146.x. [DOI] [PMC free article] [PubMed] [Google Scholar]
- 6.Darwiche SS, Ruan X, Hoffman MK, Zettel KR, Tracy AP, Schroeder LM, Cai C, Hoffman RA, Scott MJ, Pape HC, Billiar TR. Selective roles for toll-like receptors 2, 4, and 9 in systemic inflammation and immune dysfunction following peripheral tissue injury. J Trauma Acute Care Surg. 2013;74:1454–1461. doi: 10.1097/TA.0b013e3182905ed2. [DOI] [PMC free article] [PubMed] [Google Scholar]
- 7.Semeraro F, Ammollo CT, Morrissey JH, Dale GL, Friese P, Esmon NL, Esmon CT. Extracellular histones promote thrombin generation through platelet-dependent mechanisms: involvement of platelet TLR2 and TLR4. Blood. 2011;118:1952–1961. doi: 10.1182/blood-2011-03-343061. [DOI] [PMC free article] [PubMed] [Google Scholar]
- 8.Xu J, Zhang X, Monestier M, Esmon NL, Esmon CT. Extracellular histones are mediators of death through TLR2 and TLR4 in mouse fatal liver injury. J Immunol. 2011;187:2626–2631. doi: 10.4049/jimmunol.1003930. [DOI] [PMC free article] [PubMed] [Google Scholar]
- 9.Allam R, Scherbaum CR, Darisipudi MN, Mulay SR, Hagele H, Lichtnekert J, Hagemann JH, Rupanagudi KV, Ryu M, Schwarzenberger C, Hohenstein B, Hugo C, Uhl B, Reichel CA, Krombach F, Monestier M, Liapis H, Moreth K, Schaefer L, Anders HJ. Histones from dying renal cells aggravate kidney injury via TLR2 and TLR4. J Am Soc Nephrol. 2012;23:1375–1388. doi: 10.1681/ASN.2011111077. [DOI] [PMC free article] [PubMed] [Google Scholar]
- 10.Abrams ST, Zhang N, Manson J, Liu T, Dart C, Baluwa F, Wang SS, Brohi K, Kipar A, Yu W, Wang G, Toh CH. Circulating histones are mediators of trauma-associated lung injury. Am J Respir Crit Care Med. 2013;187:160–169. doi: 10.1164/rccm.201206-1037OC. [DOI] [PMC free article] [PubMed] [Google Scholar]
- 11.Allam R, Kumar SV, Darisipudi MN, Anders HJ. Extracellular histones in tissue injury and inflammation. J Mol Med (Berlin) 2014;92:465–472. doi: 10.1007/s00109-014-1148-z. [DOI] [PubMed] [Google Scholar]
- 12.Chen R, Kang R, Fan XG, Tang D. Release and activity of histone in diseases. Cell Death Dis. 2014;5:e1370. doi: 10.1038/cddis.2014.337. [DOI] [PMC free article] [PubMed] [Google Scholar]
- 13.Caudrillier A, Kessenbrock K, Gilliss BM, Nguyen JX, Marques MB, Monestier M, Toy P, Werb Z, Looney MR. Platelets induce neutrophil extracellular traps in transfusion-related acute lung injury. J Clin Invest. 2012;122:2661–2671. doi: 10.1172/JCI61303. [DOI] [PMC free article] [PubMed] [Google Scholar]
- 14.Nakahara M, Ito T, Kawahara K, Yamamoto M, Nagasato T, Shrestha B, Yamada S, Miyauchi T, Higuchi K, Takenaka T, Yasuda T, Matsunaga A, Kakihana Y, Hashiguchi T, Kanmura Y, Maruyama I. Recombinant thrombomodulin protects mice against histone-induced lethal thromboembolism. PLoS One. 2013;8:e75961. doi: 10.1371/journal.pone.0075961. [DOI] [PMC free article] [PubMed] [Google Scholar]
- 15.Bosmann M, Grailer JJ, Ruemmler R, Russkamp NF, Zetoune FS, Sarma JV, Standiford TJ, Ward PA. Extracellular histones are essential effectors of C5aR- and C5L2-mediated tissue damage and inflammation in acute lung injury. FASEB J. 2013;27:5010–5021. doi: 10.1096/fj.13-236380. [DOI] [PMC free article] [PubMed] [Google Scholar]
- 16.Xu J, Zhang X, Pelayo R, Monestier M, Ammollo CT, Semeraro F, Taylor FB, Esmon NL, Lupu F, Esmon CT. Extracellular histones are major mediators of death in sepsis. Nat Med. 2009;15:1318–1321. doi: 10.1038/nm.2053. [DOI] [PMC free article] [PubMed] [Google Scholar]
- 17.Gillrie MR, Lee K, Gowda DC, Davis SP, Monestier M, Cui L, Hien TT, Day NP, Ho M. Plasmodium falciparum histones induce endothelial proinflammatory response and barrier dysfunction. Am J Pathol. 2012;180:1028–1039. doi: 10.1016/j.ajpath.2011.11.037. [DOI] [PMC free article] [PubMed] [Google Scholar]
- 18.Saffarzadeh M, Juenemann C, Queisser MA, Lochnit G, Barreto G, Galuska SP, Lohmeyer J, Preissner KT. Neutrophil extracellular traps directly induce epithelial and endothelial cell death: a predominant role of histones. PLoS One. 2012;7:e32366. doi: 10.1371/journal.pone.0032366. [DOI] [PMC free article] [PubMed] [Google Scholar]
- 19.Ekaney ML, Otto GP, Sossdorf M, Sponholz C, Boehringer M, Loesche W, Rittirsch D, Wilharm A, Kurzai O, Bauer M, Claus RA. Impact of plasma histones in human sepsis and their contribution to cellular injury and inflammation. Crit Care. 2014;18:543. doi: 10.1186/s13054-014-0543-8. [DOI] [PMC free article] [PubMed] [Google Scholar]
- 20.Hirsch JG. Bactericidal action of histone. J Exp Med. 1958;108:925–944. doi: 10.1084/jem.108.6.925. [DOI] [PMC free article] [PubMed] [Google Scholar]
- 21.Grailer JJ, Canning BA, Kalbitz M, Haggadone MD, Dhond RM, Andjelkovic AV, Zetoune FS, Ward PA. Critical role for the NLRP3 inflammasome during acute lung injury. J Immunol. 2014;192:5974–5983. doi: 10.4049/jimmunol.1400368. [DOI] [PMC free article] [PubMed] [Google Scholar]
- 22.Bartova E, Krejci J, Harnicarova A, Galiova G, Kozubek S. Histone modifications and nuclear architecture: a review. J Histochem Cytochem. 2008;56:711–721. doi: 10.1369/jhc.2008.951251. [DOI] [PMC free article] [PubMed] [Google Scholar]
- 23.Bowman GD, Poirier MG. Post-translational modifications of histones that influence nucleosome dynamics. Chem Rev. 2015;115:2274–2295. doi: 10.1021/cr500350x. [DOI] [PMC free article] [PubMed] [Google Scholar]
- 24.Jones JE, Causey CP, Knuckley B, Slack-Noyes JL, Thompson PR. Protein arginine deiminase 4 (PAD4): current understanding and future therapeutic potential. Curr Opin Drug Discov Dev. 2009;12:616–627. [PMC free article] [PubMed] [Google Scholar]
- 25.Costa O, Monier JC. Antihistone antibodies detected by ELISA and immunoblotting in systemic lupus erythematosus and rheumatoid arthritis. J Rheumatol. 1986;13:722–725. [PubMed] [Google Scholar]
- 26.Sokolove J, Bromberg R, Deane KD, Lahey LJ, Derber LA, Chandra PE, Edison JD, Gilliland WR, Tibshirani RJ, Norris JM, Holers VM, Robinson WH. Autoantibody epitope spreading in the pre-clinical phase predicts progression to rheumatoid arthritis. PLoS One. 2012;7:e35296. doi: 10.1371/journal.pone.0035296. [DOI] [PMC free article] [PubMed] [Google Scholar]
- 27.Zhang X, Kimura Y, Fang C, Zhou L, Sfyroera G, Lambris JD, Wetsel RA, Miwa T, Song WC. Regulation of toll-like receptor-mediated inflammatory response by complement in vivo. Blood. 2007;110:228–236. doi: 10.1182/blood-2006-12-063636. [DOI] [PMC free article] [PubMed] [Google Scholar]
- 28.Grailer JJ, Kalbitz M, Zetoune FS, Ward PA. Persistent neutrophil dysfunction and suppression of acute lung injury in mice following cecal ligation and puncture sepsis. J Innate Immun. 2014;6:695–705. doi: 10.1159/000362554. [DOI] [PMC free article] [PubMed] [Google Scholar]
- 29.Bosmann M, Grailer JJ, Russkamp NF, Ruemmler R, Zetoune FS, Sarma JV, Ward PA. CD11c+ alveolar macrophages are a source of IL-23 during lipopolysaccharide-induced acute lung injury. Shock. 2013;39:447–452. doi: 10.1097/SHK.0b013e31828f9c92. [DOI] [PMC free article] [PubMed] [Google Scholar]
- 30.Izeboud CA, Monshouwer M, van Miert AS, Witkamp RF. The β-adrenoceptor agonist clenbuterol is a potent inhibitor of the LPS-induced production of TNF-α and IL-6 in vitro and in vivo. Inflamm Res. 1999;48:497–502. doi: 10.1007/s000110050493. [DOI] [PubMed] [Google Scholar]
- 31.Sugita-Konishi Y, Pestka JJ. Differential upregulation of TNF-α, IL-6, and IL-8 production by deoxynivalenol (vomitoxin) and other 8-ketotrichothecenes in a human macrophage model. J Toxicol Environ Health A. 2001;64:619–636. doi: 10.1080/152873901753246223. [DOI] [PubMed] [Google Scholar]
- 32.Park EK, Jung HS, Yang HI, Yoo MC, Kim C, Kim KS. Optimized THP-1 differentiation is required for the detection of responses to weak stimuli. Inflamm Res. 2007;56:45–50. doi: 10.1007/s00011-007-6115-5. [DOI] [PubMed] [Google Scholar]
- 33.Hofstetter C, Flondor M, Boost KA, Koehler P, Bosmann M, Pfeilschifter J, Zwissler B, Muhl H. A brief exposure to isoflurane (50 s) significantly impacts on plasma cytokine levels in endotoxemic rats. Int Immunopharmacol. 2005;5:1519–1522. doi: 10.1016/j.intimp.2005.04.008. [DOI] [PubMed] [Google Scholar]
- 34.Suhail M. Na+, K+-ATPase: ubiquitous multifunctional transmembrane protein and its relevance to various pathophysiological conditions. J Clin Med Res. 2010;2:1–17. doi: 10.4021/jocmr2010.02.263w. [DOI] [PMC free article] [PubMed] [Google Scholar]
- 35.Huber-Lang M, Sarma VJ, Lu KT, McGuire SR, Padgaonkar VA, Guo RF, Younkin EM, Kunkel RG, Ding J, Erickson R, Curnutte JT, Ward PA. Role of C5a in multiorgan failure during sepsis. J Immunol. 2001;166:1193–1199. doi: 10.4049/jimmunol.166.2.1193. [DOI] [PubMed] [Google Scholar]
- 36.Aziz M, Jacob A, Yang WL, Matsuda A, Wang P. Current trends in inflammatory and immunomodulatory mediators in sepsis. J Leukoc Biol. 2013;93:329–342. doi: 10.1189/jlb.0912437. [DOI] [PMC free article] [PubMed] [Google Scholar]
- 37.Kalbitz M, Grailer JJ, Fattahi F, Jajou L, Herron TJ, Campbell KF, Zetoune FS, Bosmann M, Sarma JV, Huber-Lang M, Gebhard F, Loaiza R, Valdivia HH, Jalife J, Russell MW, Ward PA. Role of extracellular histones in the cardiomyopathy of sepsis. FASEB J. 2015;29:2185–2193. doi: 10.1096/fj.14-268730. [DOI] [PMC free article] [PubMed] [Google Scholar]
- 38.Alhamdi Y, Abrams ST, Cheng Z, Jing S, Su D, Liu Z, Lane S, Welters I, Wang G, Toh CH. Circulating histones are major mediators of cardiac injury in patients with sepsis. Crit Care Med. 2015;43:2094–2103. doi: 10.1097/CCM.0000000000001162. [DOI] [PubMed] [Google Scholar]
- 39.Brinkmann V, Reichard U, Goosmann C, Fauler B, Uhlemann Y, Weiss DS, Weinrauch Y, Zychlinsky A. Neutrophil extracellular traps kill bacteria. Science. 2004;303:1532–1535. doi: 10.1126/science.1092385. [DOI] [PubMed] [Google Scholar]
- 40.Fattahi F, Grailer JJ, Jajou L, Zetoune FS, Andjelkovic AV, Ward PA. Organ distribution of histones after intravenous infusion of FITC histones or after sepsis. Immunol Res. 2015;61:177–186. doi: 10.1007/s12026-015-8628-2. [DOI] [PMC free article] [PubMed] [Google Scholar]
Associated Data
This section collects any data citations, data availability statements, or supplementary materials included in this article.
Supplementary Materials
Supplementary data
Supplementary data


