Abstract
Single‐atom catalysts have attracted much interest recently because of their excellent stability, high catalytic activity, and remarkable atom efficiency. Inspired by the recent experimental discovery of a highly efficient single‐atom catalyst Pd1/γ‐Al2O3, we conducted a comprehensive DFT study on geometries, stabilities and CO oxidation catalytic activities of M1/γ‐Al2O3 (M=Pd, Fe, Co, and Ni) by using slab‐model. One of the most important results here is that Ni1/Al2O3 catalyst exhibits higher activity in CO oxidation than Pd1/Al2O3. The CO oxidation occurs through the Mars van Krevelen mechanism, the rate‐determining step of which is the generation of CO2 from CO through abstraction of surface oxygen. The projected density of states (PDOS) of 2p orbitals of the surface O, the structure of CO‐adsorbed surface, charge polarization of CO and charge transfer from CO to surface are important factors for these catalysts. Although the binding energies of Fe and Co with Al2O3 are very large, those of Pd and Ni are small, indicating that the neighboring O atom is not strongly bound to Pd and Ni, which leads to an enhancement of the reactivity of the O atom toward CO. The metal oxidation state is suggested to be one of the crucial factors for the observed catalytic activity.
Keywords: CO oxidation, density functional theory, heterogeneous catalysis, single-atom catalyst, structure–activity relationships
Introduction
Nanoparticles supported on metal oxides have been recognized to have high catalytic activity towards numerous reactions such as CO oxidation, NO reduction, and water‐gas shift reaction.1, 2, 3, 4, 5 Nanoparticle‐catalyzed CO oxidation, which can remove CO from car exhausts and purify H2 in polymer electrolyte membrane fuel cells, is usually used as a benchmark to evaluate the performance of various supported metal catalysts.6
Compared with isolated metal nanoparticles, the presence of metal‐oxide surfaces as well as strong metal‐support interactions changes the electronic structures of metal clusters,7 lowers activation barriers, and provides new reaction pathways. The metal‐oxide supports are generally divided into reducible and irreducible metal oxides.2 The reducible metal oxides (TiO2, CeO2, FeOx, etc.) can provide labile oxygen species that participate in the reaction. On the other hand, Al2O3 and MgO usually belong to the class of the irreducible metal oxides. Some experimental works revealed that the catalytic activity of supported metal nanoparticle depends remarkably on its size and shape,8, 9 because the number of low‐coordinated atoms in metal nanoparticles, which often function as active sites in catalytic reaction, increases dramatically as the size of nanoparticles decreases. Therefore, single‐atom catalysts supported on metal oxides, in which an isolated metal atom is anchored to a support, attract wide interest, not only because of their low‐temperature activity but also because of their atom efficiency, stability, and selectivity.10, 11, 12, 13, 14, 15, 16
In 2011, Qiao et al. successfully synthesized a single‐atom catalyst with Pt atoms uniformly dispersed on a reducible FeOx support, Pt1/FeOx, which shows excellent stability and high activity for CO oxidation. It is noted that this catalyst performs preferential oxidation of CO in CO–H2 mixture.17 Then, the same group reported a theoretical and experimental study on Ir1/FeOx.18 Recently, using density functional theory (DFT) calculations, Li et al. investigated a series of single‐atom catalysts, M1/FeOx (M=Au, Rh, Pd, Co, Cu, Ru, and Ti).19 They found that under the Langmuir‐Hinshelwood (LH) mechanism, the catalytic performance of single Rh, Pd, Ru, and Ti atoms on iron oxide surface is even higher than that of Pt1/FeOx for CO oxidation. Moreover, Qiao and co‐workers also synthesized a single‐atom catalyst Au1/Co3O4 and examined its catalytic activity toward CO oxidation.20 Very recently, a series of single‐atom catalysts with Au were investigated with both experimental and theoretical studies.21, 22, 23 Liang et al. proposed theoretically an efficient single‐atom catalyst Ni1/FeOx.24
On the other hand, several groups focused on single‐atom catalysts supported on irreducible metal oxides. In 2001, Abbet et al. studied CO oxidation on single Pd atom supported on oxygen‐defective MgO(1 0 0).25 Their experimental and theoretical investigations revealed that as the CO oxidation reaction proceeds, oxygen vacancies will anneal, resulting in coalescence of the remaining Pd to form large clusters. By means of ab initio molecular dynamics, Ghosh and Nair investigated the LH mechanism of CO oxidation on Rh1/γ‐Al2O3.26 Narula and co‐workers performed experimental and DFT research on CO oxidation on a single‐atom catalyst Pt1/θ‐Al2O3(010) and proposed a modified LH mechanism to explain the catalytic activity.27 Although Al2O3 is chemically inert and thermodynamically stable, the supported noble metal catalysts, such as Rh, Pt and Au, can also promote the participation of the oxygen atoms of Al2O3 in chemical reactions.28, 29 Very recently, Peterson et al. reported that single Pd atom anchored in γ‐alumina has both high stability and catalytic activity toward CO oxidation.30 They proposed that even though γ‐alumina belongs to the irreducible metal oxides, the reaction follows the Mars van Krevelen (MvK) mechanism, in which the surface oxygen participates in the reaction, because of the fact that Pd is anchored rather than supported on the surface. Because Rh, Pd, and Pt are all precious metals, it is highly meaningful to find more efficient and low‐cost single‐atom alternative catalysts supported on irreducible metal oxides.
In the present work, we investigated CO oxidation by various single‐atom catalysts anchored on γ‐alumina (M1/γ‐Al2O3), consisting of abundant 3d metals such as Fe, Co, and Ni and compared their catalytic performance with Pd1/γ‐Al2O3 using a DFT method with slab‐model. Our main purposes here are to predict whether a 3d metal single‐atom catalyst is useful for the CO oxidation reaction, to elucidate the reaction mechanism, to clarify the rate‐determining step, and to disclose important factor(s) for catalytic activity.
Results and Discussion
Geometries and Stabilities of M1/γ‐Al2O3 (M=Pd, Fe, Co, and Ni)
Previous DFT calculations revealed that the adsorption energy of Pd on γ‐alumina is in the order of 1.0–1.3 eV and the diffusion barrier of supported Pd atoms on γ‐alumina(1 0 0) is about 0.3 eV, suggesting that supported Pd atoms can diffuse easily on surfaces and nucleate quickly to form large clusters.31, 32 Furthermore, X‐ray absorption near edge structure (XANES) analysis suggested that Pd on the alumina surface has a fourfold coordination with oxygen atoms.30 It is reasonable to predict that the Pd atom replaces an Al atom and is embedded in the alumina surface. This model is consistent with the above mentioned experimental observation and the large binding energy of Pd with Al2O3 prevents Pd atoms from diffusing on the surface.
To simulate the γ‐alumina surface, a periodic slab model of the dehydrated γ‐Al2O3(1 0 0) surface was chosen, which is the same as that used by Peterson and co‐workers.30 As shown in Figure 1, there are four non‐equivalent Al atoms on the surface. To find a suitable site for Pd and other metals, we calculated the formation energy (ΔE(Alvac)) of an Al vacancy (Alvac). The ΔE(Alvac) is obtained through Equation (1):
| (1) |
Figure 1.
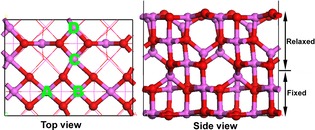
Top (left) and side (right) views of eight‐layered γ‐Al2O3(1 0 0) slab with 2×1 supercell. The Al and O atoms are colored by pink and red, respectively. A‐D in Top view are metal doping sites.
where E Alvac, E Al, and E pristine are the total energies of the slab with an Al vacancy, the isolated Al atom and the pristine slab, respectively. The smaller ΔE(Alvac) is, the easier formation of an Al vacancy is. The calculated ΔE(Alvac) values of four different Al vacancies are 13.10, 13.85, 13.94, and 13.93 eV, respectively. The ΔE(Alvac) of site A (Figure 1) has the smallest value, which is the same as the results of Peterson et al.30 As samples were calcined at high temperature for one hour in ambient air in the process of catalyst preparation, the thermal stability is also very important.30 We calculated the relative energies of Pd1/Al2O3 with Pd anchoring in four different sites and found that Pd1/Al2O3 with Pd in site A has the lowest relative energy. Consequently, a doping metal atom such as Pd prefers to be embedded in site A.
Next, we focused on binding energies and geometric and electronic properties of M1/Al2O3 (M=Pd, Fe, Co, and Ni), which are shown in Table 1. The binding energy Eb is obtained through Equation (2):
| (2) |
Table 1.
Binding energies (E b), Bader charge of metal atom (q), shortest bond distance between metal atom and surface oxygen (dM‐O), and distance between metal atom and surface Al atom (dM‐Al).
| Metal | Al | Pd | Fe | Co | Ni |
|---|---|---|---|---|---|
| E b [eV] | 13.10 | 7.05 | 10.71 | 10.02 | 9.03 |
| q [|e|] | +2.444 | +1.074 | +1.615 | +1.538 | +1.234 |
| dM‐O [Å] | 1.949 | 2.097 | 2.028 | 1.906 | 2.015 |
| dM‐Al [Å] | 2.725 | 2.796 | 2.746 | 2.694 | 2.746 |
where E Alvac, E metal, and E tot are total energies of the slab with an Al vacancy, the isolated metal atom and the slab doped with M, respectively. Compared with the binding energy (E b) of Pd, the E b of Fe, Co and Ni are theoretically evaluated to be much larger, indicating that these nanocomposites are easily formed on generation of an Al vacancy. Using a Bader charge analysis, it is found that considerable charge transfer from metal atom to Al2O3 occurs. Comparison of M with Al provides clearer features. Al exhibits the largest E b and the largest positive charge. Consequently, the surrounding O atoms interact well with Al and receive enough population. As a result, the surface O atoms are stable and not reactive. For Pd and Ni, E b is small and M positive charge is small, suggesting that the surrounding O atoms do not interact well with Pd and Ni, and therefore, they are active, which will be discussed below. There is a good correlation between binding energy and charge value, suggesting that the greater the atomic charge is, the larger the binding energy becomes; in other words, charge‐transfer and electrostatic interactions could be relevant for M‐support interaction.
Mechanism of CO Oxidation on M1/γ‐Al2O3 (M=Pd, Fe, Co, and Ni)
The experimental study revealed that for the CO oxidation on Pd1/Al2O3, the orders of reaction rates are +0.35 and +0.15 with respect to CO and O2, respectively.30 Thus, it was experimentally proposed that the reaction mechanism follows the MvK mechanism, in which the oxygen atoms are originate from the surface rather than from the gas. Theoretical calculations by Peterson and co‐workers also confirmed the low energy barrier of the MvK mechanism for this system.30
As shown in Scheme 1, the reaction begins by CO adsorption to the metal in an end‐on structure to afford a CO‐adduct 2. Via a transition state 3TS, the adsorbed CO reacts with the nearby lattice oxygen and forms OCO* on the surface. The OCO* leaves the surface through a transition state 5TS to form an intermediate 6 in which CO2 is adsorbed on the surface. The adsorbed CO2 is easily released to afford an intermediate 7 with an oxygen vacancy on the alumina surface. Then, an O2 molecule adsorbs on the surface to afford an intermediate 8, in which one O atom interacts with the metal atom and the other O is in the oxygen vacancy. The following step is the adsorption of the second CO to the metal, forming an intermediate 9. Via a transition state 10TS, the second CO reacts with the pre‐adsorbed O on the metal‐oxide surface to form the second CO2.
Scheme 1.
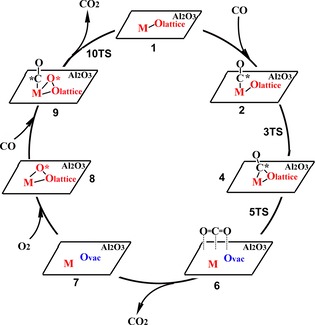
Proposed MvK mechanism of CO oxidation on M1/Al2O3.30 The Ovac represents an oxygen vacancy on the surface.
The above reaction cycle can be described by four steps, as shown in chemical Equations (3), (4), (5), (6):
| (3) |
| (4) |
| (5) |
| (6) |
Except for step (3) (Equation (5)), the other three steps have energy barrier. The key steps shown in Equations (3) and (6) satisfy the MvK mechanism. The geometries of those structures are shown in Figure 2, and relative energies and energy barriers are presented in Table 2 and Figure 3. Parameters such as bond distances are presented in the Supporting Information.
Figure 2.
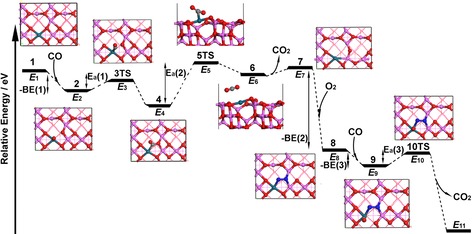
Reaction pathway of CO oxidation on M1/Al2O3 (M=Pd, Fe, Co, and Ni).
Table 2.
Relative energies (eV) of reactants, intermediates and transition states of CO oxidation on M1/Al2O3 (M=Pd, Fe, Co, and Ni).
| Metal | Pd | Fe | Co | Ni |
|---|---|---|---|---|
| E 1 | 0.00 | 0.00 | 0.00 | 0.00 |
| E 2 | −0.74 | −0.28 | −1.41 | −0.77 |
| E 3 | −0.44 | 0.04 | −0.99 | −0.61 |
| E 4 | −1.14 | −0.36 | −1.18 | −1.19 |
| E 5 | −0.24 | 1.13 | 0.02 | −0.67 |
| E6 | −0.55 | 0.99 | −0.09 | −0.78 |
| E 7 | −0.51 | 1.13 | 0.01 | −0.58 |
| E 8 | −2.53 | −2.65 | −2.94 | −2.78 |
| E 9 | −2.85 | −2.79 | −3.52 | −3.14 |
| E 10 | −2.63 | −2.38 | −3.36 | −3.07 |
| E 11 | −6.53 | −6.53 | −6.53 | −6.53 |
Figure 3.
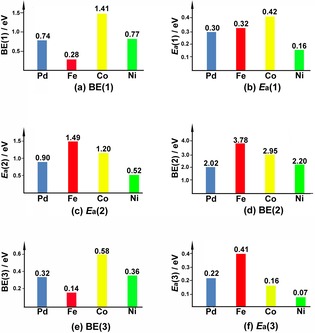
Adsorption energies (BE(1), BE(2), and BE(3)) and energy barriers (E a(1), E a(2), and E a(3)) of three transition states of CO oxidation on M1/Al2O3 (M=Pd, Fe, Co, and Ni).
Whether or not the CO oxidation catalyst can efficiently capture adsorbates such as CO and O2 is very important for their further catalytic cycle.19 In general, it is recognized that intermediates able to participate in a catalytic reaction should not be too stable or too unstable. As shown in Table 2 and Figure 3, the CO adsorption energy of the first CO molecule is quite different for each M1/Al2O3 (M=Pd, Fe, Co, and Ni) catalyst. Fe1/Al2O3 and Co1/Al2O3 exhibit the smallest and largest CO adsorption energies, 0.28 and 1.41 eV, respectively, while the CO adsorption energies for Pd1/Al2O3 and Ni1/Al2O3 are similarly moderate as 0.74 and 0.77 eV, respectively.
In step (1) (Equation (3)), which corresponds to the OCOlattice* formation, the energy barrier of the Pd1/Al2O3‐catalyzed reaction is calculated to be 0.30 eV, similar to the report by Peterson et al. (0.26 eV) at the PW91 level.30 The moderate difference may be ascribed to the use of a different density functional. Fe1/Al2O3‐ and Co1/Al2O3‐catalyzed reactions need energy barriers (0.32 and 0.42 eV) comparable to that of Pd1/Al2O3. However, the energy barrier of the Ni1/Al2O3‐catalyzed reaction is as low as 0.16 eV. This process is exothermic with reaction energies ranging from 0.08 to 0.42 eV except for the Co1/Al2O3 catalyzed one.
The energy barrier of OCOlattice* desorption from the surface depends strongly on the nature of the metal atom in step (2) (Equation (4)). For Pd1/Al2O3, the energy barrier is 0.90 eV. Interestingly, the calculated energy barrier of Ni1/Al2O3 is 0.52 eV, much lower than that of Pd1/Al2O3. In contrast, Fe1/Al2O3 and Co1/Al2O3‐catalysts need very high energy barriers of 1.49 and 1.20 eV, respectively. Notably, this process is endothermic for all four single‐atom catalysts. The release of physically adsorbed CO2 from the surface is slightly endothermic.
Step (3) (Equation (5)) corresponds to the adsorption of O2 at a O‐vacancy, which is strongly exothermic (BE(2)), and followed by CO adsorption on the doped metal atom. Fe1/Al2O3 and Co1/Al2O3 have O2 adsorption energies of 3.78 and 2.95 eV, respectively, which provides too stable intermediate. On the other side, the O2 adsorption energies for Pd1/Al2O3 and Ni1/Al2O3 are moderate, 2.02 and 2.20 eV, respectively. The adsorption energy of the second CO (BE(3)) follows the same order as the first CO adsorption but is much smaller, ranging from 0.14 to 0.58 eV.
In step (4) (Equation (6)), in which the second CO2 formation occurs, the barrier of the Pd1/Al2O3 catalyzed reaction is calculated to be 0.22 eV, similar to the previous result of 0.27 eV.30 In step (1) (Equation (3)), PBE gives a moderately higher energy barrier than PW91 whereas the PBE result here is moderately lower than PW91 one. All of the other three catalysts need low energy barriers ranging from 0.07 to 0.41 eV.
Overall, the reaction of CO with surface oxygen to generate the first CO2 molecule is the rate‐determining step of the whole catalytic cycle. For Ni1/Al2O3, each energy barrier is evidently lower than the corresponding energy barrier of Pd1/Al2O3. Consequently, from both thermodynamic and kinetic points of view, Ni1/Al2O3 is suggested to exhibit better catalytic performance than Pd1/Al2O3. On the other hand, because of the high energy barrier of step (2) (Equation (4)), the catalytic performance of both Fe1/Al2O3 and Co1/Al2O3 should be worse than that of Pd1/Al2O3.
Origin of the Catalytic Performance of M1/γ‐Al2O3 (M=Pd, Fe, Co, and Ni)
To clarify the causes leading to such different catalytic performances of the four single‐atom catalysts, we analyze their geometric and electronic structures in this section.
As mentioned above, the CO adsorption energy is relevant for the initial step of catalysis. The Bader charge of the metal atom in M1/Al2O3 in Table 1 could not explain the order of CO adsorption energy on M1/Al2O3 (M=Pd, Fe, Co, and Ni). As the CO molecule approaches the metal atom, there are two main orbital interactions between the CO molecule and the metal atom. First, the lone pair orbital of CO interacts with the unoccupied s and d orbitals of the metal atom, resulting in charge transfer from CO to the metal atom. Second, the back‐donation takes place from the metal atom to CO through the interaction between the metal atomic d orbital and the CO molecular π* orbital.
We calculated the projected density of states (PDOS) of s and d atomic orbitals of the metal atom in reactant 1, as shown in Figure 4. From the PDOS of M‐s orbital, there is an unoccupied s orbital near the Fermi level for Ni1/Al2O3 and Pd1/Al2O3, which interacts with the lone pair orbital of CO. Also, the occupied d orbital is found at higher energy than in Fe1/Al2O3. On the other hand, there are no obvious unoccupied s orbital and occupied d orbitals close to the Fermi level in Fe1/Al2O3. These results indicate that the CO adsorption is stronger in Ni1/Al2O3 and Pd1/Al2O3 than in Fe1/Al2O3. In Co1/Al2O3, there evidently are occupied d orbitals near the Fermi level which are much higher in energy than in Pd1/Al2O3 and Ni1/Al2O3. Therefore, the back‐donation with the π* orbital of CO is stronger in Co1/Al2O3 than in Pd1/Al2O3 and Ni1/Al2O3. This is consistent with the result that Bader charge of CO on Co1/Al2O3 is negative whereas those values for M1/Al2O3 (M=Pd, Fe, and Ni) are positive (Table S3 in Supporting Information). The largest CO adsorption energy with Co1/Al2O3 mainly arises from the strong back‐donation. The metal–carbon distance in intermediate 2 of Fe1/Al2O3 is much larger than that of the other three catalysts, in agreement with the weak interaction between CO and Fe1/Al2O3 (Table S3).
Figure 4.
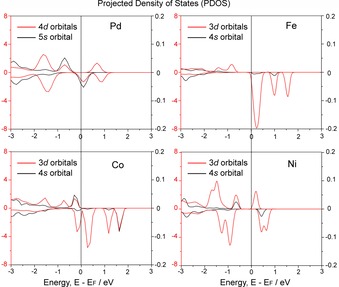
Calculated projected density of states (PDOS) for M‐s orbital (black) and M‐d orbitals (red) of M1/Al2O3 (M=Pd, Fe, Co and Ni).
To analyze the oxidation state of the doped metal, d‐DOS together with the partial charges were used because the d orbital occupation is strongly related to the oxidation state of the metal. Bader charge in Table 1 qualitatively indicates that Ni and Pd have similar oxidation states that are lower than those of Fe and Co. As shown in Figure 4, the PDOS of the d orbitals found in unoccupied levels are much larger in the case of Fe1/Al2O3 and Co1/Al2O3 than for Pd1/Al2O3 and Ni1/Al2O3, suggesting that Fe and Co have higher oxidation states than Ni and Pd. Although it is not easy to define the oxidation state (+II or +III), it is possible to discuss the values qualitatively to support our explanation.
Next, we focus on the first energy barrier E a(1) of the catalytic cycle. The PDOS of intermediate 2 revealed that for M1/Al2O3 (M=Pd, Fe, and Ni), the active 2p orbital of O atom (O‐p orbital) appears to be located close to the Fermi level, as shown in Figure 5, whereas only tiny conduction band exists in the case of M=Co. For M1/Al2O3 (M=Pd and Ni), there are occupied and unoccupied O‐p orbitals near the Fermi level which interact with π* and lone pair orbitals of CO, respectively, lowering the energy barrier for M1/Al2O3 (M=Pd and Ni). However, occupied O‐p orbital of Fe1/Al2O3 and Co1/Al2O3 only appear at lower energy (−1.0 eV and −1.5 eV). The Bader charge analysis showed that the positive charge of the carbon atom in CO and the negative charge of active O in the lattice in Ni1/Al2O3 are large, +1.110 |e| and −1.459 |e|, respectively. The spin density in M1/Al2O3 (M=Pd and Ni) is distributed on the doped metal and surface O (Figure S5 in the Supporting Information), indicating that the surface O is evidently activated. From a geometric point of view, as presented in Table 3, the interatomic distance between the carbon of CO and the active surface oxygen of Ni1/Al2O3 is the shortest (2.586 Å) in these catalysts. The polarized electronic structure and short distance also correlate with the high activity of Ni1/Al2O3.
Figure 5.
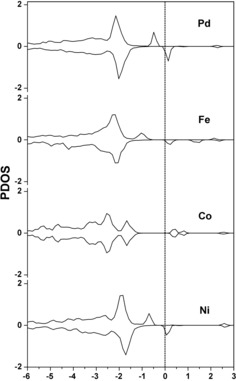
Calculated the projected density of state (PDOS) for O‐p orbital of the surface reactive oxygen atom in intermediate 2 of M1/Al2O3 (M=Pd, Fe, Co and Ni).
Table 3.
Bader charges of the carbon atom (C) and the active surface oxygen (Olattice), and the interatomic distance between the carbon and the surface oxygen in intermediate 2 of M1/Al2O3 (M=Pd, Fe, Co, and Ni).
| System | C [|e|] | Olattice [|e|] | C‐Olattice distance [Å] |
|---|---|---|---|
| Pd1/Al2O3 | +1.130 | −1.424 | 2.747 |
| Fe1/Al2O3 | +1.098 | −1.464 | 2.758 |
| Co1/Al2O3 | +1.046 | −1.416 | 2.615 |
| Ni1/Al2O3 | +1.110 | −1.459 | 2.586 |
In the second transition state 5TS, the abstraction of surface oxygen by CO occurs to generate CO2, which is the rate‐determining step in all of these four single‐atom catalysts. To clarify the reason why Fe1/Al2O3 and Co1/Al2O3 have large energy barriers, we examined the structure of intermediate 4. As presented in Table 4, the Bader charge analysis showed that both charge polarization of CO and charge transfer from adsorbate CO to the lattice O occur at intermediate 4, which reveals the large binding energy of newly formed C−Olattice bond. In the case of Ni1/Al2O3, the C and Olattice charges are +1.479 |e| and −1.362 |e|, respectively, for which charge polarization is larger than M=Fe and Co, but comparable to M=Pd. Also, the large negative charge of the Olattice in Ni1/Al2O3 and Pd1/Al2O3 suggests that the charge transfer from the Olattice to Ni and Pd is small and thereby the Ni‐Olattice interaction is weak compared to Fe1/Al2O3 and Co1/Al2O3. The same holds true for charge transfer as seen in charge of CO; charges of CO for M=Pd and Ni (+0.453 |e| and +0.434 |e|) are larger than those for M=Fe and Co (+0.230 |e| and +0.362 |e|). Short bond distances of the newly formed C−Olattice bonds in Pd1/Al2O3 and Ni1/Al2O3 also confirm the large binding energy, which is consistent with the occupied O‐p orbital closer to the Fermi level in Pd1/Al2O3 and Ni1/Al2O3 than in Fe1/Al2O3 and Co1/Al2O3. The above discussion reveals that charge polarization of CO, charge transfer from Olattice to M and from CO to surface, as well as the structure of the CO‐adsorbed surface, are important factors for the catalysis.
Table 4.
Bader charges of the carbon atom (C), the oxygen atom of CO (O co), the sum of the CO, and the active surface oxygen (O lattice), and the bond distance of the newly formed C−O bond in intermediate 4 of M1/Al2O3 (M=Pd, Fe, Co, and Ni).
| System | C [|e|] | Oco [|e|] | CO [|e|] | Olattice [|e|] | C‐Olattice distance [Å] |
|---|---|---|---|---|---|
| Pd1/Al2O3 | +1.506 | −1.053 | +0.453 | −1.359 | 1.353 |
| Fe1/Al2O3 | +1.304 | −1.074 | +0.230 | −1.347 | 1.401 |
| Co1/Al2O3 | +1.427 | −1.055 | +0.362 | −1.323 | 1.367 |
| Ni1/Al2O3 | +1.479 | −1.045 | +0.434 | −1.362 | 1.351 |
As depicted in Figure 6, the energy barrier of 5TS has a correlation with the reaction energy of step (2) (Equation (4)). Because the reaction energy is parallel to the energy barrier, the energy barrier can also be explained based on the stability of 6: the larger the reaction energy, the higher the energy barrier. The detailed examination of 5TS revealed that the distances between the metal and the carbon atom are 2.324, 2.669, 2.624, and 1.852 Å, respectively, for M1/Al2O3 (M=Pd, Fe, Co, and Ni), indicating that the transition state is late for Fe1/Al2O3 and Co1/Al2O3, which is in agreement with their high energy barriers.
Figure 6.
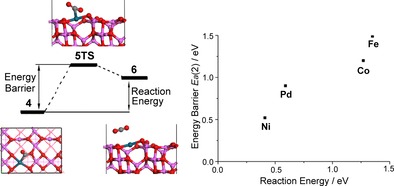
The relationship between energy barrier and reaction energy in step (2) (Equation (4)) of CO oxidation on M1/Al2O3 (M=Pd, Fe, Co and Ni).
The adsorption energy of O2 at O‐vacancy for four catalysts in step (3) (Equation (5)) is correlated to the binding energy of the doped metal atom; the O2 adsorption energy of M1/Al2O3 follows the same order as the binding energy E b in Table 1. The order of the first and second CO adsorption energies, BE(1) and BE(3), for M1/Al2O3 (M=Pd, Fe, Co, and Ni) is the same, although BE(3) is much smaller than BE(1). The calculations showed that the Bader charge of M in intermediate 8 is smaller than that in reactant 1 (Table S7), revealing that the interaction of the lone pair electrons of CO with the metal atom becomes weak in intermediate 9, which is consistent with the low values of BE(3). The PDOS of s and d orbitals of the metal atom in intermediate 8 is shown in Figure S10. It is found that for M1/Al2O3 (M=Pd, Co, and Ni), there are obvious occupied and unoccupied s and d orbitals close to the Fermi level. In contrast, there is no evident PDOS of occupied s and d orbitals near the Fermi level in the case of Fe1/Al2O3, resulting in the weak adsorption energy of the second CO for Fe1/Al2O3.
In intermediate 9, the O−O bond distance of pre‐adsorbed O2 ranges from 1.423 to 1.450 Å, which is much longer than the bond distance (1.236 Å) of the gas‐phase oxygen molecule. In particular, the O−O bond distance of Ni1/Al2O3 is the longest in these catalysts (Table S9), revealing that adsorbed oxygen is most activated by the Ni1/Al2O3 catalyst and that it reacts preferentially with the adsorbed CO. Using PDOS, we found the relevant orbital hybridization between O‐p orbitals and M‐d orbitals in both spin‐up and spin‐down channels for all four catalysts (Figure S11), similarly to the observation on single‐atom catalysts M1/FeOx (M=Pt, Rh, and Pd).19 Although there are unoccupied O‐p orbitals near Fermi level for all M1/Al2O3 (M=Pd, Fe, Co, and Ni), Fe1/Al2O3 does not have active occupied O‐p orbitals above −1.0 eV, which leads to the relatively high energy barrier in Fe1/Al2O3. The Bader charge analysis also showed that the carbon atom and active oxygen atom in Ni1/Al2O3 are evidently positively and negatively charged, respectively, which would result in the low energy barrier at 10TS.
In the catalytic cycle, Ni1/Al2O3 and Pd1/Al2O3 keep a spin state of M=1 (doublet), whereas the spin states of Fe1/γ‐Al2O3 and Co1/γ‐Al2O3 change. This can be attributed to the coordination property of Fe and Co. For example, on adsorption of the first CO molecule on the Co1/γ‐Al2O3, the spin state changes from M=4 (quintet) to M=0 (antiferromagnetic singlet) (Figures S2 and S4), indicating that Co strongly binds to CO. This result is consistent with the large adsorption energy of CO on Co1/γ‐Al2O3. On the other side, for the other three catalysts, the spin state does not change after CO adsorption. The constant spin state of Ni1/Al2O3 and Pd1/Al2O3 also reveals that adsorbed molecules such as CO and OCOlattice* do not evidently change the electronic state of single‐atom catalysts and that the interaction between metal and adsorbed molecule is moderate. Therefore, the adsorption energy is moderate and the energy barrier is low for Ni1/Al2O3‐ and Pd1/Al2O3‐catalyzed reaction.
Finally, we wish to present a clear explanation of the reasons why Ni1/Al2O3 and Pd1/Al2O3 exhibit such electronic structure that is favorable for catalytic activity. As mentioned above, the binding energies of Ni and Pd with Al2O3 bearing an Al vacancy are much smaller than those of Fe and Co. In the case of Fe and Co, they can take a +III oxidation state, and therefore can form strong bonding interaction with the neighboring O atom. On the other hand, Ni and Pd tend to take a +II oxidation state and as a result, they cannot form strong bonding interactions with the neighboring O atom. This could be one important reason for the smaller binding energy. At the same time, the neighboring O atom has high reactivity because of the absence of a strong bonding interaction with Ni and Pd. This is the origin of their high catalytic activity. The spin density map of reactant 1 and intermediate 2 of Ni1/Al2O3 and Pd1/Al2O3 also agree well with this explanation. It is likely to predict that metals that tend to take a +II oxidation state are good candidates for the single‐atom catalyst M1/Al2O3 for CO oxidation. In other words, the use of metals that have a stable +III oxidation state is not recommended because such metals can form strong M−O bond similar to the Al−O bond.
Conclusions
By using density functional theory calculations of slab model, we performed a comprehensive theoretical investigation on a series of single‐atom catalysts M1/γ‐Al2O3 with ubiquitous elements such as Fe, Co, and Ni. Our results suggest that, among these systems, Ni1/Al2O3 catalyst is more active than the recently reported Pd1/Al2O3, with regard to the low‐temperature CO oxidation, as a result of its significantly lower energy barriers in the catalytic cycle. On the other hand, Fe1/Al2O3 and Co1/Al2O3 have a higher energy barrier and, therefore, are less effective as catalysts. Under the MvK mechanism, the rate‐determining step of the CO oxidation by all these heterogeneous single‐atom catalysts is the abstraction of surface oxygen by CO to generate the first CO2 molecule. The origin of the low‐energy barrier for Ni1/Al2O3 was investigated by analyzing electronic structures and geometries of intermediates and transition states, and PDOS. The PDOS of O‐p near the Fermi level, CO‐adsorbed surface structure, charge polarization of CO and charge transfer from CO to surface are important factors for the catalysis; Ni1/Al2O3 satisfies all these factors. As a result of the low binding energy of Pd and Ni, the neighboring O atom is weakly bound to Pd or Ni and therefore becomes highly active toward CO, which leads to their enhanced catalytic performance. Hereby we wish to recommend the use of metals with a stable +II oxidation state for the construction of good catalysts.
Computational Section
The 2×1 supercell model (11.17×8.41 Å)33, 34 of the dehydrated γ‐Al2O3(1 0 0) consists of eight atomic layers, of which the top five atomic layers are allowed to relax in the calculations while the bottom three are fixed, as shown in Figure 1. With these choices, the computational slab of dehydrated γ‐Al2O3(1 0 0) contains 100 atoms. A vacuum spacing of 15 Å was added in the z‐direction without a dipole correction to avoid the interaction between the slab and its repeated motif. The lattice parameters were fixed in optimizations. Test calculations with a 2×2 supercell model showed that incrementing the model size has little influence on the adsorption energy. All spin‐polarized DFT calculations were performed by employing the Vienna Ab Initio Simulation Package (VASP).35 The generalized‐gradient approximation in the form of PBE36 was used as the correlation and exchange energy functional, which has been widely used in previous DFT calculations of single‐atom catalysts.19, 21, 22, 23, 24 To describe the interactions between valence electrons and the ion core, the projector augmented wave (PAW) method was adopted.37 The kinetic cut‐off energy for the plane wave basis set for valence electrons was fixed at 400 eV. We also used the Gaussian broadening method with a smearing width of 0.05 eV to improve convergence of states near the Fermi level. A 2×2×1 Monkhorst‐Pack mesh38 was used to sample the first Brillouin zone. Test calculations with a 3×3×1 Monkhorst‐Pack mesh gave similar results. The convergence criteria for the electronic structure and geometry optimization were 10−5 eV and 0.02 eV Å−1, respectively. The calculations of isolated small molecules were performed by using a (10 Å×10 Å×10 Å) unit cell with the Γ‐point only for the k‐point sampling. To locate transition states (TSs), we used the climbing‐image nudged elastic band (CI‐NEB) method,39, 40 in which at least five images were used. Geometry optimizations of TSs were conducted until the forces on each free atom in TSs were less than 0.05 eV Å−1. For Bader charge analysis, the program developed by the Henkelman group was used.41
Conflict of interest
The authors declare no conflict of interest.
Supporting information
As a service to our authors and readers, this journal provides supporting information supplied by the authors. Such materials are peer reviewed and may be re‐organized for online delivery, but are not copy‐edited or typeset. Technical support issues arising from supporting information (other than missing files) should be addressed to the authors.
Supplementary
Acknowledgements
This work was supported by a MEXT (Ministry of Education Culture, Sports, Science and Technology in Japan) program “Elements Strategy Initiative to Form Core Research Center”. M. E. acknowledge the financial support from a Grant‐in‐Aid for Scientific Research from the Japan Society for the Promotion of Science (JSPS), 16H04104, 16H06511. The computations were partially performed at the Research Center for Computational Science, Okazaki, Japan.
T. Yang, R. Fukuda, S. Hosokawa, T. Tanaka, S. Sakaki, M. Ehara, ChemCatChem 2017, 9, 1222.
Contributor Information
Prof. Dr. Shigeyoshi Sakaki, Email: sakaki.shigeyoshi.47e@st.kyoto-u.ac.jp
Prof. Dr. Masahiro Ehara, Email: ehara@ims.ac.jp.
References
- 1. Haruta M., Yamada N., Kobayashi T., Iijima S., J. Catal. 1989, 115, 301–309. [Google Scholar]
- 2. Tyo E. C., Vajda S., Nat. Nanotechnol. 2015, 10, 577–588. [DOI] [PubMed] [Google Scholar]
- 3. Stratakis M., Garcia H., Chem. Rev. 2012, 112, 4469–4506. [DOI] [PubMed] [Google Scholar]
- 4. Shekhar M., Wang J., Lee W. S., Williams W. D., Kim S. M., Stach E. A., Miller J. T., Delgass W. N., Ribeiro F. H., J. Am. Chem. Soc. 2012, 134, 4700–4708. [DOI] [PubMed] [Google Scholar]
- 5. Flytzani-Stephanopoulos M., Acc. Chem. Res. 2014, 47, 783–792. [DOI] [PubMed] [Google Scholar]
- 6. Liu K., Wang A. Q., Zhang T., ACS Catal. 2012, 2, 1165–1178. [Google Scholar]
- 7. Yang T., Ehara M., Phys. Chem. Chem. Phys. 2017, 19, 3679–3687. [DOI] [PubMed] [Google Scholar]
- 8. Judai K., Abbet S., Worz A. S., Heiz U., Henry C. R., J. Am. Chem. Soc. 2004, 126, 2732–2737. [DOI] [PubMed] [Google Scholar]
- 9. Schalow T., Brandt B., Starr D. E., Laurin M., Shaikhutdinov S. K., Schauermann S., Libuda J., Freund H.-J., Angew. Chem. Int. Ed. 2006, 45, 3693–3697; [DOI] [PubMed] [Google Scholar]; Angew. Chem. 2006, 118, 3775–3780. [Google Scholar]
- 10. Yang X. F., Wang A. Q., Qiao B. T., Li J., Liu J. Y., Zhang T., Acc. Chem. Res. 2013, 46, 1740–1748. [DOI] [PubMed] [Google Scholar]
- 11. Flytzani-Stephanopoulos M., Gates B. C., Annu. Rev. Chem. Biomol. 2012, 3, 545–574. [DOI] [PubMed] [Google Scholar]
- 12. Huang Z. W., Gu X., Cao Q. Q., Hu P. P., Hao J. M., Li J. H., Tang X. F., Angew. Chem. Int. Ed. 2012, 51, 4198–4203; [DOI] [PubMed] [Google Scholar]; Angew. Chem. 2012, 124, 4274–4279. [Google Scholar]
- 13. Yu X. H., Wang S. G., Li Y. W., Wang J. G., Jiao H. J., J. Phys. Chem. C 2012, 116, 10632–10638. [Google Scholar]
- 14. Lin J., Wang A. Q., Qiao B. T., Liu X. Y., Yang X. F., Wang X. D., Liang J. X., Li J. X., Liu J. Y., Zhang T., J. Am. Chem. Soc. 2013, 135, 15314–15317. [DOI] [PubMed] [Google Scholar]
- 15. Bruix A., Lykhach Y., Matolinova I., Neitzel A., Skala T., Tsud N., Vorokhta M., Stetsovych V., Sevcikova K., Myslivecek J., Fiala R., Vaclavu M., Prince K. C., Bruyere S., Potin V., Illas F., Matolin V., Libuda J., Neyman K. M., Angew. Chem. Int. Ed. 2014, 53, 10525–10530; [DOI] [PubMed] [Google Scholar]; Angew. Chem. 2014, 126, 10693–10698. [Google Scholar]
- 16. Vilé G., Albani D., Nachtegaal M., Chen Z., Dontsova D., Antonietti M., López N., Pérez-Ramírez J., Angew. Chem. Int. Ed. 2015, 54, 11265–11269; [DOI] [PubMed] [Google Scholar]; Angew. Chem. 2015, 127, 11417–11422. [Google Scholar]
- 17. Qiao B. T., Wang A. Q., Yang X. F., Allard L. F., Jiang Z., Cui Y. T., Liu J. Y., Li J., Zhang T., Nat. Chem. 2011, 3, 634–641. [DOI] [PubMed] [Google Scholar]
- 18. Liang J. X., Lin J., Yang X. F., Wang A. Q., Qiao B. T., Liu J. Y., Zhang T., Li J., J. Phys. Chem. C 2014, 118, 21945–21951. [Google Scholar]
- 19. Li F. Y., Li Y. F., Zeng X. C., Chen Z. F., ACS Catal. 2015, 5, 544–552. [Google Scholar]
- 20. Qiao B. T., Lin J., Wang A. Q., Chen Y., Zhang T., Liu J. Y., Chin. J. Catal. 2015, 36, 1505–1511. [Google Scholar]
- 21. Qiao B., Liang J.-X., Wang A., Xu C.-Q., Li J., Zhang T., Liu J. J., Nano Res. 2015, 8, 2913–2924. [Google Scholar]
- 22. Long B., Tang Y., Li J., Nano Res. 2016, 9, 3868–3880. [Google Scholar]
- 23. Tang Y., Zhao S., Long B., Liu J.-C., Li J., J. Phys. Chem. C 2016, 120, 17514–17526. [Google Scholar]
- 24. Liang J.-X., Yang X.-F., Wang A., Zhang T., Li J., Catal. Sci. Technol. 2016, 6, 6886–6892. [Google Scholar]
- 25. Abbet S., Heiz U., Hakkinen H., Landman U., Phys. Rev. Lett. 2001, 86, 5950–5953. [DOI] [PubMed] [Google Scholar]
- 26. Ghosh T. K., Nair N. N., ChemCatChem 2013, 5, 1811–1821. [Google Scholar]
- 27. Moses-DeBusk M., Yoon M., Allard L. F., Mullins D. R., Wu Z. L., Yang X. F., Veith G., Stocks G. M., Narula C. K., J. Am. Chem. Soc. 2013, 135, 12634–12645. [DOI] [PubMed] [Google Scholar]
- 28. Li Z.-Y., Yuan Z., Li X.-N., Zhao Y.-X., He S.-G., J. Am. Chem. Soc. 2014, 136, 14307–14313. [DOI] [PubMed] [Google Scholar]
- 29. Li X.-N., Yuan Z., Meng J.-H., Li Z.-Y., He S.-G., J. Phys. Chem. C 2015, 119, 15414–15420. [Google Scholar]
- 30. Peterson E. J., Delariva A. T., Lin S., Johnson R. S., Guo H., Miller J. T., Kwak J. H., Peden C. H. F., Kiefer B., Allard L. F., Ribeiro F. H., Datye A. K., Nat. Commun. 2014, 5, 4885. [DOI] [PubMed] [Google Scholar]
- 31. Corral Valero M., Raybaud P., Sautet P., J. Phys. Chem. B 2006, 110, 1759–1767. [DOI] [PubMed] [Google Scholar]
- 32. Corral Valero M., Raybaud P., Sautet P., Phys. Rev. B 2007, 75, 045427. [Google Scholar]
- 33. Digne M., Sautet P., Raybaud P., Euzen P., Toulhoat H., J. Catal. 2002, 211, 1–5. [Google Scholar]
- 34. Wischert R., Laurent P., Copéret C., Delbecq F., Sautet P., J. Am. Chem. Soc. 2012, 134, 14430–14449. [DOI] [PubMed] [Google Scholar]
- 35. Kresse G., Furthmuller J., Phys. Rev. B 1996, 54, 11169–11186. [DOI] [PubMed] [Google Scholar]
- 36. Perdew J. P., Burke K., Ernzerhof M., Phys. Rev. Lett. 1996, 77, 3865–3868. [DOI] [PubMed] [Google Scholar]
- 37. Blöchl P. E., Phys. Rev. B 1994, 50, 17953–17979. [DOI] [PubMed] [Google Scholar]
- 38. Monkhorst H. J., Pack J. D., Phys. Rev. B 1976, 13, 5188–5192. [Google Scholar]
- 39. Henkelman G., Jonsson H., J. Chem. Phys. 2000, 113, 9978–9985. [Google Scholar]
- 40. Henkelman G., Uberuaga B. P., Jonsson H., J. Chem. Phys. 2000, 113, 9901–9904. [Google Scholar]
- 41. Henkelman G., Arnaldsson A., Jonsson H., Comput. Mater. Sci. 2006, 36, 354–360. [Google Scholar]
Associated Data
This section collects any data citations, data availability statements, or supplementary materials included in this article.
Supplementary Materials
As a service to our authors and readers, this journal provides supporting information supplied by the authors. Such materials are peer reviewed and may be re‐organized for online delivery, but are not copy‐edited or typeset. Technical support issues arising from supporting information (other than missing files) should be addressed to the authors.
Supplementary


