Abstract
DNA double‐strand breaks (DSBs) caused by ultrasound were evaluated in a quantitative manner by single‐molecule fluorescence microscopy. We compared the effect of time‐interval (or pulse) sonication to that of continuous wave (CW) sonication at a fixed frequency of 30 kHz. Pulses caused fewer DSBs than CW sonication under the same total input ultrasound energy when the pulse repetition period was above the order of a second. In contrast, pulses caused more DSBs than CW sonication for pulse widths shorter than a second. These effect of ultrasound on DNA were interpreted in terms of the time‐dependent decay in the probability of breakage during the duration of a pulse. We propose a simple phenomenological model by considering a characteristic decay in the probability of DSBs during single‐pulse sonication, which reproduces the essence of the experimental trend. In addition, a data analysis revealed a characteristic scaling behavior between the number of pulses and the number of DSBs.
Keywords: double-strand breaks, fluorescence microscopy, genomic DNA, single-molecule studies, ultrasound
1. Introduction
Ultrasound is increasingly being applied in practical medicine for both clinical diagnosis and therapeutic purposes.1, 2 For diagnostic applications, a better resolution of the morphological features of organs is desirable. Ultrasound is also used to evaluate blood flow. One of the most important factors in such diagnostic applications is the avoidance of biological damage.3, 4, 5, 6 For therapeutic purposes, various applications have been developed including the healing of wounds in skin, muscle and other tissues, hemostasis, transdermal drug delivery, targeted drug delivery, in vivo oxygen delivery, and clot lysis.7, 8, 9, 10, 11, 12 With regard to these applications, it is important to evaluate the effect of ultrasound sonication on the living body and cells.13, 14, 15 Ultrasound has both thermal and non‐thermal effects. Ultrasound on a MHz scale is considered to have thermal and/or non‐thermal effects, whereas ultrasound on the order of several tens of kHz generates mostly non‐thermal effects. The non‐thermal effects are categorized into mechanical and chemical effects. Acoustic radiation force and acoustic streaming are typical mechanical effects. Although acoustic cavitation has both effects, it has been argued that the mechanical effect is dominant in the case of low‐frequency ultrasound. In addition, therapeutic ultrasound often uses pulse wave (PW) rather than continuous wave (CW).12 In the present study we focused on the effect of the frequency of pulsing ultrasound on double‐strand breaks (DSBs) in genomic DNA molecules. We used relatively low‐frequency, that is, several tens of kHz, ultrasound, partly so that we can set the experimental conditions in a well‐controlled manner to evaluate non‐thermal effects. Low‐frequency ultrasound has been applied to lithotripsy, phacoemulsification, ultrasound‐assisted liposuction, tissue cutting and vessel sealing, and skin permeabilization.4, 15, 16, 17, 18 In these applications, the non‐thermal effect, that is, cavitation effect, plays the major role. Although several previous papers have discussed the cavitation effect on DNA molecules, [19–24] there have been few studies on the quantitative evaluation of damage to “genome‐sized” DNA molecules. It is important to unveil the effects of ultrasound from the standpoints of both safety and basic science.
DNA damage is currently categorized into four types: base changes, cross‐linking, and single‐ and double‐strand breaks (DSBs).25 Among these, DSBs are considered to most strongly affect the function of genomic DNA molecules.1, 2, 3, 4, 5, 6 Many studies have been performed to detect DSBs both in vivo and in vitro. The polymerase chain reaction can be used to detect DNA damage through observation of the termination of amplification.7, 8 Immunological assays are also commonly used to detect oxidative DNA damage through the use of an antibody or immunoglobulin.7, 9 In situ hybridization provides information on specific changes in certain DNA sequences.7, 10 Although several methodologies have been proposed to detect DSBs in DNA molecules, including the comet assay and single‐cell gel electrophoresis assay,7, 8, 12, 26 it has been rather difficult to evaluate the number of DSBs per unit length of DNA in a quantitative manner, especially for long, genomic‐sized DNA molecules. Recently, it has been demonstrated that the direct visualization of single giant DNA molecules above the size of 100 kbp by the use of fluorescence microscopy can provide useful information on the structure and function of genomic DNA molecules.26, 27, 28, 29, 30 It is becoming increasingly clear that giant DNA molecules undergo large discrete changes in their higher‐order structure accompanied by a change in density on the order of 103–105, whereas shorter oligomeric DNA molecules do not exhibit this property.31, 32 Recently, we studied the effect of ultrasound irradiation in CW mode on DSBs in DNA by single‐molecule observation, and evaluated cavitation power acoustically through the use of a hydrophone.28 We found that DSBs are generated above a threshold ultrasound power, corresponding to the critical power to generate cavitation. In the present study, we measured DSBs in genome‐sized DNA through single‐molecule observation with high‐resolution fluorescence microscopy to clarify the effect of pulse irradiation in comparison to CW irradiation.
2. Results and Discussion
Figure 1 shows the results of the measurements of DSBs with different duty ratios for ultrasound sonication up to 60 s. As shown in the schematic in Figure 1 a, we measured DSBs by changing the duty ratio of PW sonication: , where is the sonication period and is the OFF period, that is, when sonication is not applied. A duty ratio of 1.0 corresponds to CW. The total ultrasound energy applied to the DNA solution is linearly proportional to the duty ratio D. Figure 1 b shows examples of fluorescence images of DNA molecules stretched on a glass slide, indicating marked fragmentation for pulse sonication with a duty ratio of D=0.8. In contrast, DNA molecules show much less fragmentation under CW sonication. Figure 1 c shows the change in the average length of stretched DNA molecules after ultrasound sonication, , depending on the duty ratio D; there is a gradual decrease in with an increase in D. In this measurement, the average control length for more than 100 DNA specimens under each experimental condition, , was determined to be 29.5 μm for samples without radiation (D=0). This is smaller than the natural contour length (57 μm) and can be attributed to the procedure used to extract and purify T4 GT7 DNA molecules from the phage and to the process of sample preparation, which includes pipetting and mixing.29 By denoting the average number of breaks per average length before sonication as , we obtain = / ‐1. To determine the frequency of DSBs per unit length , i.e., per 10 kbp, we rescaled as = / ・10 kbp, where is in units of kbp.29 Thus, Figure 1 d shows the dependence of on the duty ratio D, where is almost linearly proportional to D, for D between 0 and 0.9. Interestingly, for D above 0.9, there is a large deviation from a linear relationship, including at D=1.0, that is, for CW sonication. Although it may be worthwhile to clarify the degree of deviation from the linear relationship, under the experimental conditions in Figure 1, it is difficult for obtain the value of in a precise manner, since the experimental error for increases with greater fragmentation. Under this situation, we performed additional experiments as described below.
Figure 1.
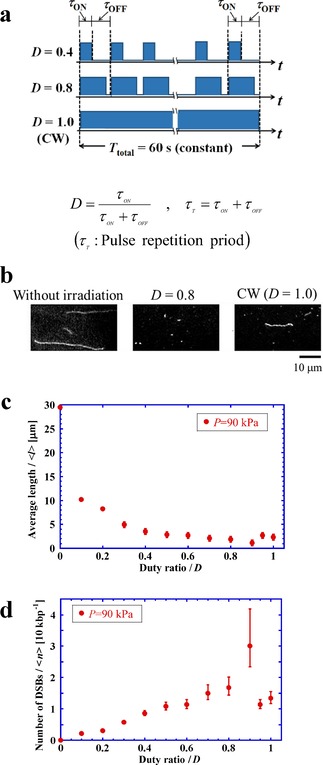
a) Schematic representation of the periodic application, or pulsing, of ultrasound with different duty ratios, D. b) Fluorescence microscopy images of stretched DNA molecules after exposure at various duty ratios (see the procedure in Figure 5). c) Average length of DNA, , versus the duty ratio, D, under the same sonication period, . d) Number of DSBs versus duty ratio, D, under the same sonication period, .
Figure 2 a shows the experimental scheme that was designed to gain deeper insight into the effect of the duty ratio D, or pulse repetition period , on the degree of DSBs. In this scheme, the total input energy of ultrasound over 60 s is exactly the same for all of the experiments with different pulse repetition periods or different numbers of pulses N p, where .
Figure 2.
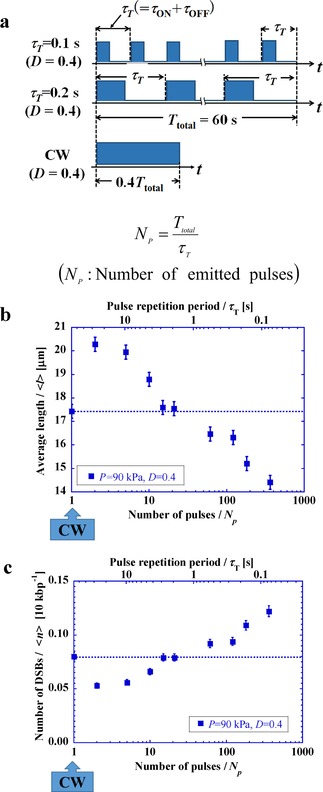
a) Schematic representation of the application of pulsed ultrasound with different pulse repetition periods, , under a constant ultrasound energy input. b) Average length of DNA, , versus number of pulses, N p, (or pulse repetition period, ) under D=0.4. c) Number of DSBs versus number of pulses, N p, (or pulse repetition period, ) under D=0.4.
Figure 2 b shows the change in the average length with respect to the number of pulses N p at an ultrasound pressure of 90 kPa and with a duty ratio of 0.4, where the horizontal axis is on a logarithmic scale. In these experiments, the average length, , was 22.9 μm for about 100 DNA molecules without sonication. Figure 2 c indicates that, with a pulse repetition period above the order of second(s), there are fewer DSBs than with CW sonication. In contrast, the number of DSBs with below 1 second(s), becomes greater than that for CW, and tends to increase with a decrease in .
Figure 3 shows the results of a similar series of experiments as in Figure 2 under the condition D=0.8. The average length after sonication is somewhat smaller than that in Figure 2 b. If we consider that the total input energy of ultrasound in Figure 3 is twice that in Figure 2, it is natural to observe that DSBs are more frequent in Figure 3. Interestingly, a closer inspection of Figure 2 and Figure 3 indicates a similar dependence of DSBs on the change in N p; i.e., compared to DSBs under CW, DSBs tend to decrease with fewer pulses and tend to increase with a larger number of pulses, which reflect longer and shorter pulse repetition periods , respectively.
Figure 3.
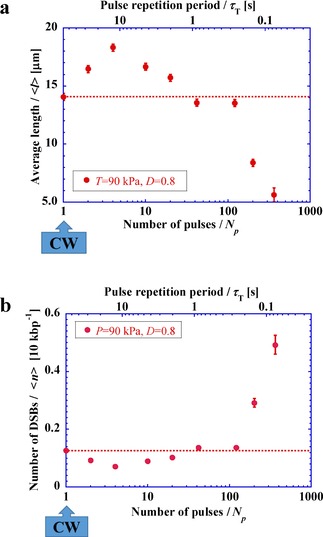
a) Average length of DNA, , versus number of pulses, N p, (or pulse repetition period, ) under D=0.8. b) Number of DSBs versus number of pulses, N p, (or pulse repetition period, ) under D=0.8.
Next, we consider the time‐dependent change in DSBs under ultrasound sonication. The experimental trend that a larger number of pulses causes greater damage to DNA implies that the probability of DSBs per unit time tends to decrease gradually during the period of individual pulses. Thus, we assume that the probability of DSBs for a single pulse, x, is simply dependent on its duration or period, , as in [Eq. (1)]:
| (1) |
where we regard 0<α<1, by considering the weaker effect on the probability of DSBs per unit time with a longer period for a pulse. The period is given as , where D : duty ratio, : total sonication period, and N p: number of pulses. Thus, the number of DSBs per unit length is given under the approximation that the DSBs caused by individual pulses are mutually independent [Eq. (2)]:
| (2) |
Now, we may expect the following relationship between <n> and N p.[Eq. (3)]:
| (3) |
Figure 4 shows the log–log relationship between the number of pulses, N p, and the number of DSBs, <n>. From the linear portions of the lines for both D=0.4 (the blue line) and 0.8 (the red line), we obtain α=0.8. Thus, we can deduce the following relationship [Eq. (4)]:
| (4) |
Figure 4.
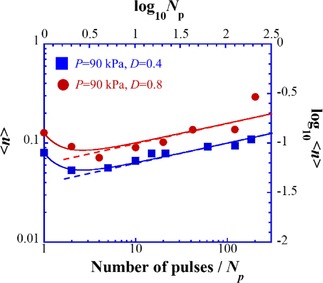
Scaling relationship between the number of pulses, N p, and the number of DSBs, <n>, shown as the log–log plot of the experimental data in Figures 2 and 3. The linear portions of the lines correspond to [Eq. (4)], whereas the curves are given by [Eq. (6)].
where C=−1.4 and −1.2 for D=0.4 and 0.8, respectively. In other words, the difference in C is given as ΔC ≈0.2. From eq. (2), we may expect the relationship [Eq. (5)]:
| (5) |
This value corresponds well to ΔC ≈0.2. Thus, it has become clear that the parallel linear relationship depicted as blue and red solid lines in Figure 4 can be well interpreted based on the theoretical expectation as in [Eq. (2)]. The deviation of the plots for larger values of N p with D=0.8 is attributable to the breakdown of the assumption that the time‐dependent change in the probability of DSBs is not influenced by prior pulses. In other words, when the resting time between neighboring pulses becomes on the order of 0.1 s, the aftereffect of the previous pulse becomes significant.33 From the experimental finding that the parameter α (=0.8) is smaller than unity, it becomes clear that the kinetics of DSBs exhibit a scaling behavior. This fact indicates the existence of a longer time‐tail compared to that under usual exponential decay. Next, we can discuss the deviation from a linear relationship at small values of N p, especially at N p=1. We can check the degree of deviation from a linear relationship by simply adding an additional term to [Eq. (4)], as follows [Eq. (6)]:
| (6) |
This additional term results in the curved lines in Figure 4, suggesting that the fitting becomes rather good when we choose β=2. This parameter in the scaling equation implies rather rapid decay of the aftereffect of pulsed sonication.
The detailed mechanism to account for why the probability of DSBs decays on a time scale of second(s) during pulse sonication is not yet clear. However, the kinetic data together with their analysis reported here may contain important information on the time‐dependent change in the physicochemical effect of pulsed sonication, including the strength of the shockwave generated through cavitation. It may be interesting to more closely study time‐dependent effects on DSBs. Recently, we studied the effect of ascorbic acid against DSBs in DNA and found that ascorbic acid has a marked protective effect against the damage induced by reactive oxygen species. In contract, ascorbic acid offers almost no protection against the damage caused by ultrasound.29 Thus, DSBs caused by ultrasound are most likely caused by the shockwave under the generation of cavitation.28 The results reported here are expected to stimulate studies on the effects of periodic perturbations on the time evolution of nonlinear systems, including on many chemical and biochemical kinetics.34 It has been suggested that periodic perturbations significantly change the essential features of nonlinear dynamical systems, including the appearance of mode bifurcation, breakdown of additivity, etc.35, 36, 37
3. Conclusions
We studied DSBs in giant DNA caused by ultrasound sonication by using single‐DNA observation with fluorescence microscopy. The results showed that the probability of DSBs under pulse sonication is lower than that under CW when the repetition of pulses is above the order of second(s). In contrast, the probability of DSBs under pulse sonication is higher than that under CW when the pulse repetition is below the order of second(s). The discovery of this biphasic nature of the effect of ultrasound is expected to attract considerable interest from scientists in a wide range of disciplines, including not only the field of ultrasonics, but also biophysics, physical chemistry, and macromolecular science, To shed light on the biphasic effect of pulse sonication, we proposed a simple phenomenological model by considering a characteristic decay in the probability of causing DSBs during single‐pulse sonication. The data analysis shows scaling behavior between the number of pulses and the number of DSBs, as in Figure 4. It may be interesting to clarify the actual physicochemical mechanism of the time‐dependent change in the probability of DSBs during pulse sonication in a future study. Additionally, in the practical medical application of ultrasound, these results suggest that through the selection of a suitable pulsing time profile together with a consideration of the effect of ultrasound power28, 29, 38, 39 it may be possible to minimize any harmful effects on the human body. Similarly, we may be able to deduce the most suitable pulsing conditions for the treatment of malignant tumors.
Experimental Section
T4 GT7 DNA (166 kbp, contour length 57 μm) and Tris‐HCl solution (pH 7.5) were purchased from Nippon Gene (Toyama, Japan). The fluorescent cyanine dye YOYO‐1 (1,1′‐(4,4,7,7‐tetramethyl‐4,7‐diazaundecamethylene)‐bis‐4‐(3‐methyl‐2,3‐dihydro‐(benzo‐1,3‐oxazole)‐2‐methylidene)‐quinolinium tetraiodide) was obtained from Molecular Probes, Inc. (Oregon, USA). The antioxidant 2‐ME (2‐mercaptoethanol) and poly‐(l‐lysine) were purchased from Wako Pure Chemical Industries (Osaka, Japan) and from Sigma–Aldrich Corporation (Tokyo, Japan), respectively.
A pair of facing Langevin transducers (FBL28452HS; FUJI CERAMICS, Fujinomiya, Japan) was attached to a cell so that they faced one another. The cell measured 80×80×50 mm (depth) and was filled with distilled water. The experimental system was essentially the same as in a previous study.28 Thus, we will only describe it briefly. A sinusoidal signal at a frequency of 30 kHz was input to the transducers to form a standing acoustic wave. We measured the three‐dimensional distribution of the sound pressure amplitude and confirmed that, under the condition with the fixation of a test tube, the standing wave showed maximum amplitude in the center of the cell, as shown in Ref. [28]. Throughout the present study, we used a fixed frequency of 30 kHz. Inside the cell, a polypropylene tube containing a DNA sample was located at the central anti‐node. T4 GT7 DNA (final concentration: 0.1 μm) was dissolved in 10 mm Tris‐HCl (pH 7.5). We examined the relationship between the current entering the transducers (I 0p) and the sound pressure from zero to the peak value (P 0p). The sound pressure was measured using a calibrated hydrophone (model 8103; Brüel & Kjær, Nærum, Denmark) with a frequency bandwidth ranging from 200 Hz to 60 kHz after the tube was removed from the cell. If we assume a linear relationship between the current and sound pressure, the pressure in the presence of the tube at the anti‐node was extrapolated from the I 0p‐P 0p curve.
To visualize individual DNA molecules by fluorescence microscopy, the fluorescent dye YOYO‐1 (final concentration: 0.1 μm) and 2‐ME (3.8 % (v/v)) were added to the sample solution. Fluorescence images of DNA molecules were captured by the use of an Axiovert 135 TV microscope (Carl Zeiss, Oberkochen, Germany) equipped with an oil‐immersed 100× objective lens, and recorded on a DVD through an EBCCD camera (Hamamatsu Photonics, Japan). The recorded videos were analyzed by VirtualDub, a free and open‐source video‐capture and video‐processing utility for Microsoft Windows written by Avery Lee. All observations were carried out at around 20°C. Figure 5 shows a schematic of the experimental procedure. The DNA solution was subjected to ultrasound sonication for 60 s under different pulse conditions. After ultrasound exposure, for the measurement of DNA length, DNA molecules were fixed on a glass surface. Glass slides were pretreated with poly‐(l‐lysine) (concentration: 5×10‐4 % (v/v)) solution, and washed with distilled water. A droplet (5 μL) of a sample was adsorbed on a modified glass slide to obtain images of the elongated DNA conformation. A droplet of the sample solution was situated on a glass slide and covered with a slip glass under weak shearing to observe elongated DNA. The lengths of the DNA molecules for 100 or more specimens were then calibrated. The captured fluorescent images were analysed by ImageJ software (National Institutes of Health, MD, USA). The experimental error in the DNA length is mainly due to the blurring effect associated with the fluorescence microscopic observation and is estimated to be on the order of 0.3–0.5 μm.
Figure 5.
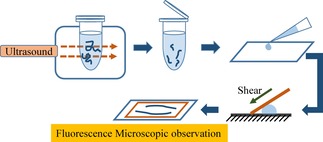
Experimental scheme to evaluate DSBs caused by exposure to ultrasound.
Acknowledgements
This work was partly supported by KAKENHI, Grants‐in‐Aid for Scientific Research, 15H02121 and 25103012.
R. Kubota, Y. Yamashita, T. Kenmotsu, Y. Yoshikawa, K. Yoshida, Y. Watanabe, T. Imanaka, K. Yoshikawa, ChemPhysChem 2017, 18, 959.
High‐Frequency Pulsing Induces Greater Damage Than Continuous‐Wave Sonication and Low‐Frequency Pulsing Causes Less Damage
Contributor Information
Prof. Dr. Takahiro Kenmotsu, Email: tkenmots@mail.doshisha.ac.jp
Prof. Dr. Kenichi Yoshikawa, Email: keyoshik@mail.doshisha.ac.jp
References
- 1. Miller D. L., Smith N. B., Bailey M. R., Czarnota G. J., Hynynen K., Makin I. R., J. Ultrasound Med. 2012, 31, 623–634. [DOI] [PMC free article] [PubMed] [Google Scholar]
- 2. Buldakov M. A., Hassan M. A., Jawaid P., Cherdyntseva N. V., Kondo T., Ultrason. Sonochem. 2015, 23, 339–346. [DOI] [PubMed] [Google Scholar]
- 3. Duck F. A., Med. Eng. Phys. 2008, 30, 1338–1348. [DOI] [PubMed] [Google Scholar]
- 4. ter-Haar G., Med. Biol. Eng. Comput. 2009, 47, 893–900. [DOI] [PubMed] [Google Scholar]
- 5. Ahmadi F., McLoughlin I. V., Chauhan S., ter-Haar G., Prog. Biophys. Mol. Biol. 2012, 108, 119–138. [DOI] [PubMed] [Google Scholar]
- 6. Harris G. R., Church C. C., Dalecki D., Ziskin M. C., Bagley J. E., Ultrasound Med. Biol. 2016, 42, 345–357. [DOI] [PubMed] [Google Scholar]
- 7. McCulloch J., Kloth L. in Wound Healing in Evidence-Based Management, 4th Edition (Eds.: J. M. McCulloch, L. C. Kloth), F. A. Davi, Company, Philadelphia, 2010, p. 68. [Google Scholar]
- 8. Vaezy S., Martin R., Crum L., Echocardiography 2001, 18, 309–315. [DOI] [PubMed] [Google Scholar]
- 9. Mitragotri S., Nat. Rev. Drug Discovery 2005, 4, 255–260. [DOI] [PubMed] [Google Scholar]
- 10. Krafft M. P., Soft Matter 2015, 11, 5982–5994. [DOI] [PubMed] [Google Scholar]
- 11. Milowska K., Gabryelak T., Ultrasonics 2008, 48, 724–730. [DOI] [PubMed] [Google Scholar]
- 12. ter-Haar G., Prog. Biophys. Mol. Biol. 2007, 93, 111–129. [DOI] [PubMed] [Google Scholar]
- 13. Buldakov M. A., Feril L. B., Tachibana K., Cherdyntseva N. V., Kondo T., Ultrason. Sonochem. 2014, 21, 40–42. [DOI] [PubMed] [Google Scholar]
- 14. Miller D. L., Williams A. R., Ultrasound Med. Biol. 1989, 15, 641–648. [DOI] [PubMed] [Google Scholar]
- 15. Marmottant P., Hilgenfeldt S., Nature 2003, 423, 153–156. [DOI] [PubMed] [Google Scholar]
- 16. Xu Z., Raghavan M., Hall T. L., Chang C. W., Mycek M. A., Fowlkes J. B., Cain C. A., IEEE Trans. Ultrason. Ferroelectr. Freq. Control 2007, 54, 2091–2101. [DOI] [PMC free article] [PubMed] [Google Scholar]
- 17. Sapozhnikov O. A., Khokhlova V. A., Bailey M. R., J. C. Williams, Jr. , McAteer J. A., Cleveland R. O., Crum L. A., J. Acoust. Soc. Am. 2002, 112, 1183–1195. [DOI] [PubMed] [Google Scholar]
- 18. Yahagi R., Yoshida K., Zhang Y., Ebata M., Toyota T., Yamaguchi T., Hayashi H., Jpn. J. Appl. Phys. 2016, 55, 07KF21. [Google Scholar]
- 19. Ali M. H., Al-Saad K. A., Ali C. M., Phys. Med. 2014, 30, 221–227. [DOI] [PubMed] [Google Scholar]
- 20. Park D., Jung B. K., Park H., Lee H., Lee G., Park J., Shin U., Won J. H., Jo Y. J., Chang J. W., Lee S., Yoon D., Seo J., Kim C. W., Sci. Rep. 2015, 5, 9846. [DOI] [PMC free article] [PubMed] [Google Scholar]
- 21. Rageh M. M., El-Lakkani A., Ali M. H. M., El-Fattah A. M. M. A., Raafat A. El-G., Int. J. Phys. Sci. 2009, 4, 63–68. [Google Scholar]
- 22. Milowska K., Gabryelak T., Biomol. Eng. 2007, 24, 263–267. [DOI] [PubMed] [Google Scholar]
- 23. Furusawa Y., Fujiwara Y., Campbell P., Zhao Q. L., Ogawa R., Hassan M. A., Tabuchi Y., Takasaki I., Takahashi A., Kondo T., PLoS ONE 2012, 7, e29012. [DOI] [PMC free article] [PubMed] [Google Scholar]
- 24. Elsner H. I., Lindblad E. B., DNA 1989, 8, 697–701. [DOI] [PubMed] [Google Scholar]
- 25. Sancar A., Lindsey-Boltz L. A., Ünsal-Kaçmaz K., Linn S., Annu. Rev. Biochem. 2004, 73, 39–85. [DOI] [PubMed] [Google Scholar]
- 26. Olive P. L., Banath J. P., Nat. Protoc. 2006, 1, 23–29. [DOI] [PubMed] [Google Scholar]
- 27. Yoshikawa Y., Mori T., Magome N., Hibino K., Yoshikawa K., Chem. Phys. Lett. 2008, 456, 80–83. [Google Scholar]
- 28. Yoshida K., Ogawa N., Kagawa Y., Tabata H., Watanabe Y., Kenmotsu T., Yoshikawa Y., Yoshikawa K., Appl. Phys. Lett. 2013, 103, 063705. [Google Scholar]
- 29. Ma Y., Ogawa N., Yoshikawa Y., Mori T., Imanaka T., Watanabe Y., Yoshikawa K., Chem. Phys. Lett. 2015, 638, 205–209. [Google Scholar]
- 30. Kurita H., Nakajima T., Yasuda H., Takashima K., Mizuno A., Wilson J. I. B., Cunningham S., Appl. Phys. Lett. 2011, 99, 191504. [Google Scholar]
- 31. Emanuel M., Radja N. H., Henriksson A., Schiessel H., Phys. Biol. 2009, 6, 025008. [DOI] [PubMed] [Google Scholar]
- 32. Yoshikawa K., Yoshikawa Y. in Compaction and Condensation of DNA, in Pharmaceutical Perspectives of Nucleic Acid-Based Therapeutics, (Eds.: R. I. Mahato, S. W. Kim ), Taylor & Francis, London and New York, 2002, pp. 137–163. [Google Scholar]
- 33. Vanhille C., Campos-Pozuelo C., Ultrason. Sonochem. 2014, 21, 50–52. [DOI] [PubMed] [Google Scholar]
- 34. Nicolis G., Prigogine I. in Self-Organization in Nonequilibrium System s, John Wiley, New York, 1977, pp. 491. [Google Scholar]
- 35. Borresen J., Lynch S., PloS One 2012, 7, e48498/1–10. [DOI] [PMC free article] [PubMed] [Google Scholar]
- 36. Kawczynski A. L., Bar-Eli K., J. Phys. Chem. 1995, 99, 16636–16640. [Google Scholar]
- 37. Ueno H., Tsuruyama T., Nowakowski B., Górecki J., Yoshikawa K., Chaos 2015, 25, 103115. [DOI] [PubMed] [Google Scholar]
- 38. Barnett S. B., Terhaar G. R., Ziskin M. C., Rott H.-D., Duck F. A., Maeda K., Ultrasound Med. Biol. 2000, 26, 355–366. [DOI] [PubMed] [Google Scholar]
- 39. Nyborg W. L., Ultrasound Med. Biol. 2001, 27, 301–333. [DOI] [PubMed] [Google Scholar]


