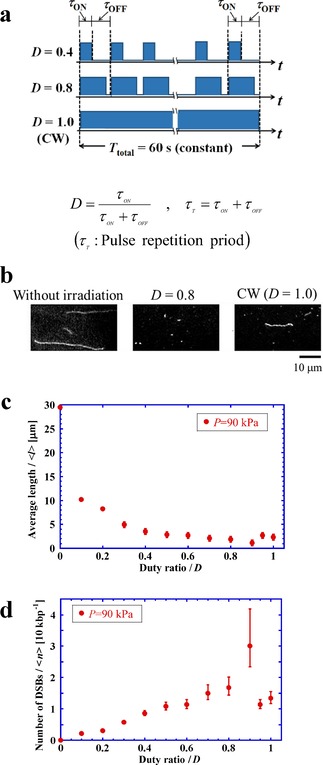
Figure 1.

a) Schematic representation of the periodic application, or pulsing, of ultrasound with different duty ratios, D. b) Fluorescence microscopy images of stretched DNA molecules after exposure at various duty ratios (see the procedure in Figure 5). c) Average length of DNA, , versus the duty ratio, D, under the same sonication period, . d) Number of DSBs versus duty ratio, D, under the same sonication period, .
