Abstract
The early stages of clot formation in blood vessels involve platelet adhesion–aggregation. Although these mechanisms have been extensively studied, gaps in their understanding still persist. We have performed detailed in vitro experiments, using the well-known Impact-R device, and developed a numerical model to better describe and understand this phenomenon. Unlike previous studies, we took into account the differential role of pre-activated and non-activated platelets, as well as the three-dimensional nature of the aggregation process. Our investigation reveals that blood albumin is a major parameter limiting platelet aggregate formation in our experiment. Simulations are in very good agreement with observations and provide quantitative estimates of the adhesion and aggregation rates that are hard to measure experimentally. They also provide a value of the effective diffusion of platelets in blood subject to the shear rate produced by the Impact-R.
Keywords: mathematical model, platelet deposition, adhesion and aggregation rates, shear-induced diffusion, whole blood in vitro experiments
1. Introduction
The current literature gives a quite fractionate picture of platelet adhesion (process by which they bind to a vessel wall) and aggregation (process by which they attach to each other). Both experimentally and numerically, sub-processes have been considered separately, disregarding the fact that several of them actually coexist and compete. The resulting emergent behaviour of the whole system may differ significantly from that produced by the constitutive elements taken in isolation.
Owing to the importance of platelet deposition in clinical practice and physiology [1], it is essential to provide a quantitative description, including all the relevant elements present in real conditions. Medical treatments require a complete understanding of the phenomena involved in physiology and pathology. A precise physical description will weigh the role of various molecules and allow scientists to identify new therapeutic targets, not only on the adhesion and aggregation but also on the spreading of platelets which is much less known in clinical practice. Indeed, the visualization of this process is poorly documented and rather challenging. Barr et al. [2] reported interesting pictures showing the platelet spreading on mice carotid sub-endothelium. In addition, several studies have associated alterations of the spreading in vitro with in vivo modifications of thrombi formation [3,4].
To characterize platelet deposition to a new quantitative level, we used an approach in which in vitro experiment and numerical simulations are developed in synergy.
Many papers explore the platelet adhesion–aggregation process by numerical simulations [5]. However, these research efforts do not take into account the different roles of pre-activated and non-activated platelets in bloodstream from donors [6,7], the possible inhibition processes [8–10], the counting of platelets and the three-dimensional structure of each aggregate.
Here, we revisit this question with in vitro experiments in a closed system, using the platelet function analyser Impact-R [11] combined with a new original method to determine the three-dimensional structure of platelet aggregates. We interpret the experimental observations in terms of a numerical model implementing first principle processes, and whose parameters can be deduced from the measurements. The co-development of the experiment and model turned out to be instrumental to discover the new results presented in this study. Of course, it is worth noting that our results are obtained within a given experimental setting. Although we believe that they are qualitatively correct in general, this remains to be further investigated.
2. Experimental set-up
The Impact-R is a cylindrical device whose lower end is a fixed disc, serving as a deposition surface, with a total area S=132.7 mm2. It is covered with polystyrene, on which platelets adhere and aggregate. Other coatings can also be considered to study, for instance, the deposition of platelets on collagen.
The upper end of the Impact-R cylinder is a rotating disc, shaped as a cone with a small angle of 2.45°. Both the upper and lower discs are aligned with the xy-plane. Anticoagulated (citrate) samples of whole blood were loaded between these two discs, separated by L=0.82 mm. Owing to the rotation of the upper disc, the blood is subject to a laminar flow. A controlled shear rate at the wall is created in a given observation window of 1×1 mm2, on the deposition surface. We imposed , corresponding to a value where the platelet deposition reaches its maximum in a range of 0–5000 s−1 (see electronic supplementary material, figure S1). It also corresponds to the order of magnitude for which thrombosis is observed to occur in cerebral aneurysms [12,13]. Note also that for such a low shear rate, we may expect that the secondary flow effects described in [14] are not present, and that the von Willebrand factor can be neglected [8,15]. By performing experiments with different adhesion mediators (data not shown), we observed that the integrin IIbIIIa is the receptor predominantly involved for adhesion and aggregation at the proposed shear rate, in agreement with [8,15].
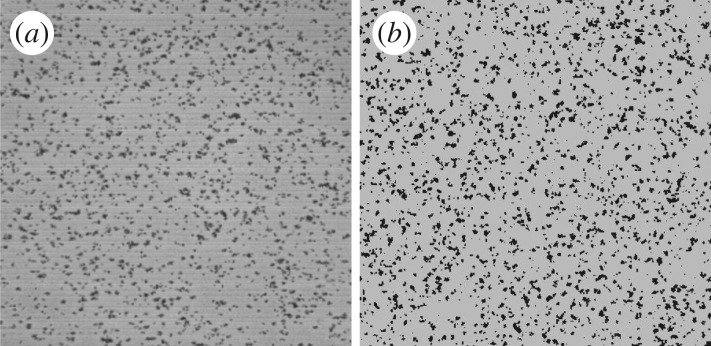
The experiment was repeated for seven healthy donors. For each of them, we measured, in the observation window, the formation of clusters resulting from deposition and aggregation of platelets (figure 1a). Note that the same deposition pattern is also observed at other locations over the substrate, indicating a homogeneous behaviour in the rotation plane.
Figure 1.
(a) Platelet deposition as observed on the Impact-R 1×1 mm deposition window, after 300 s. (b) Result of the numerical simulation, obtained with the parameters of table 1.
The number of clusters and their size, as well as the number of activated platelets and non-activated platelets still in suspension were measured at 20 s, 60 s, 120 s and 300 s. For each of these times, a new experiment had to be performed, because the measurement requires the interruption of the deposition process.
3. Observations
Our goal is to explain the observed time evolution of the above quantities as a function of the parameters of the system. Numerous mathematical models have been proposed in the literature to describe the adhesion of platelets on a surface. See for instance [16,17] and references therein. All the models assume that platelets reach the deposition surface due to a shear induced diffusion. The other parts of the proposed models depend very much on the specific question addressed by the authors, and the experimental device they have considered to produce their observations (often assuming a steady state, which is not the case here). Our first attempts to model the Impact-R experiments convinced us that the current knowledge is not sufficient to explain the observed data.
An unexpected feature was the fact that platelet deposition is limited by some unidentified mechanism. During the first 60 s, we observe a rapid increase of the number of clusters but, at 300 s, while there still exists a large number of platelets in suspension, no new formation of clusters is observed, and the cluster surfaces do not increase any longer.
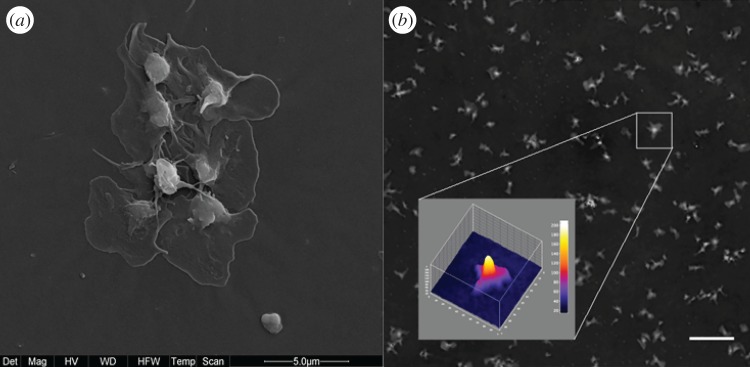
We first attempted to explain the slowdown of the increase of cluster areas by assuming a dominant growth in the third dimension (z-axis). Using a digital holographic microscope, we were able to study the development of the aggregate thickness [18], a quantity never measured before to our knowledge (figure 2). However, the three-dimensional nature of the aggregate was not sufficient to explain the saturation of the areas of the clusters. We performed new experiments (see electronic supplementary material, figures S3 and S4) that revealed that blood albumin is the main factor limiting adhesion and aggregation, as it competes with platelets for deposition. This is compatible with the results reported in [19], in a different experimental setting.
Figure 2.
(a) Scanning electron microscopy image (magnification 12 000×) of platelet aggregates in the well. (b) The three-dimensional shape of a platelet aggregate based on the optical height obtained by digital holographic microscopy. The vertical scale bar unit is 5.2 nm and the field of view 12.8 ×12.8 μm. Scale bar, 20 μm.
To account for the above observation, we propose the following scenario. (i) Activated platelets (AP) adhere to the deposition surface, thus forming a seed for a new cluster. (ii) Non-activated platelets (NAP) and AP can deposit at the periphery, or on top, of an existing cluster. This is the aggregation mechanism that makes the cluster grow. (iii) Albumin (Al) also deposits on the surface, thus reducing locally the adhesion and aggregation rates of platelets. Note that, due to the thrombogenic property of polystyrene, we do not expect platelets to detach once deposited.
4. Mathematical model
To describe and validate the above process, we propose the following numerical model. The substrate S is aligned with the xy-plane and the blood layer expands along the z-axis. We consider three types of particles: AP, NAP and Al. Any of them can be either in suspension in the blood layer, or deposited on S. We consider a mixed particle-density representation: particles in suspension are described by a density field but as individual entities when they deposit.
The blood layer has thickness L=0.82 mm and is subject to a constant shear rate . As reported in various studies (e.g. [20]), this shear rate will affect the motion of the red blood cells (RBC) in suspension, and create the so-called shear-induced diffusion of platelets and albumin towards the deposition substrate.
The deposition substrate S is discretized as n×n square cells of area ΔS=5 (μm)2, corresponding to the size of a deposited platelet (obtained as the smallest variation of cluster area observed with the microscope). The number n is chosen as so that the total area of the substrate is S=1 mm×1 mm, as in the experiment.
Assuming a good horizontal mixing in the xy-plane due to the rotating flow, we consider that the densities of AP, NAP and Al only vary along the z-axis and can be described by three one-dimensional diffusion systems from which we will determine the probability that AP, NAP or Al deposits on each cell of the substrate. This assumption considerably speeds up the computation as we replace the three-dimensional bulk dynamics by a one-dimensional model. As a result the exploration of the parameter space will be done in an acceptable time.
Accordingly, we assume that the AP, NAP and Al particles in the bulk are described by
| 4.1 |
where ρ is the density of either AP, NAP or Al, J is the flux of particles and D the shear induced diffusion.
The initial densities ρ(z)=ρ0 are independent of z, and are determined by experiment: 172 200 (μl)−1 for NAP, 4808 (μl)−1 for AP and 2.69×10¹³ (μl)−1 for Al.
The boundary condition at the top of the blood layer is J(L,t)=0 at any time. On the deposition layer, we first define a boundary layer of thickness Δz. It describes the region just above the substrate where particles are available for deposition. Let us denote by N(t) the average number of particles in a volume ΔS×Δz in the boundary layer. Thus, the boundary condition for the density of suspended AP, NAP and Al at z=0 is ρ(0,t)ΔSΔz=N(t).
The boundary layer is populated by the particles reaching the substrate by diffusion from the bulk, and depleted by the deposition on the substrate. This is described by the following equation for N(t):
| 4.2 |
where pd is the deposition rate, which will evolve during time and will vary across the substrate, according to the deposition history. In order to implement this process, particles are considered as individual entities that can deposit on any cell (i,j) of the substrate.
Let δt be the time discretization and pd(i,j,t) the deposition rate on cell (i,j) at time t. Then, pd(i,j,t)N(t)δt is interpreted as the probability that a new platelet deposits on that cell. The total number m(t) of newly deposited particles on the entire substrate is therefore
| 4.3 |
where rand(i,j) are random numbers uniformly distributed in [0,1[. The term pdN(t) in equation (4.2) is then computed as m/(n2δt), i.e. the average number of deposited particles per cell and per time unit. Note that for albumin, pd(i,j,t)N(t)δt is directly taken as the number of newly deposited molecules.
The deposition rates pd(i,j,t) are implemented as follows. On cells already occupied by a platelet, a new platelet can only deposit on top, thus increasing the thickness of the aggregate. This rate is noted ptop and is supposed constant over time. On platelet-free cells, a new platelet can deposit at a rate which is different for AP and NAP and depends on the amount of albumin already in this cell. NAP can only deposit in a cell next to an existing aggregate. Al can only deposit in a platelet-free cell.
The exact deposition rules are the following. An albumin that reaches the substrate at time t deposits with a probability P(t) which depends on the local density ρal(t) of already deposited Al. We assume that P is proportional to the remaining free space in the cell,
| 4.4 |
where pal is a parameter and is determined by the constraint that at most 100 000 albumin particles can fit in the area ΔS.
An activated platelet that hits a platelet-free cell on S deposits with a probability Q, where Q decreases as the local concentration ρal of albumin increases. We assumed that
| 4.5 |
where padh and λ are parameters. This expression can be justified by the fact that a platelet needs more free space than an albumin to attach to the substrate, due to their size difference. In other words, the probability of having enough space for a platelet decreases roughly exponentially with the density of albumin in the substrate. This can be validated with a simple deposition model on a grid, where small and large objects compete for deposition.
Once an activated platelet has deposited, it is the seed of a new cluster that grows further due to the aggregation of further platelets. In our model, AP and NAP can deposit next to already deposited platelets. From the above discussion, the aggregation probability R is assumed to be
| 4.6 |
with pagg another parameter. Figure 3 illustrates the proposed deposition rules.
Figure 3.
Sketch of the deposition substrate, discretized in cells of area ΔS, corresponding to the surface of a platelet. The grey levels indicate the density of albumin already deposited in each cell. The picture also illustrates the adhesion, aggregation and deposition along the z-axis. On the left panel, activated platelets (grey side discs) deposit first. Then in the right panel, non-activated platelets (white side discs) aggregate next to an already formed cluster.
The above model can be simulated numerically with different values of the unknown parameters (pal, padh, λ, pagg and ptop), in order to reproduce the time evolution of the in vitro experiment, namely the number Nc(t) of clusters per mm2, the average cluster size s(t) and the number Nap(t) and Nnap(t) of platelets still in suspension (activated and non-activated, respectively).
However, the shear-induced diffusion coefficient D and the thickness of the boundary layer Δz need to be determined. The value of D from the Zydney–Colton theory (e.g. [16,17,21]) produces a flux of platelets towards the deposition substrate with D≈5×10⁻¹¹ m2 s−1 for the direction perpendicular to the flow, when considering and a hematocrit of 40%. This value is however too small to explain the 3125 platelets per microlitre that have disappeared on average from the bulk within the first 20 s of the experiment, even with the maximum deposition rate. In a column of section ΔS=5 (μm)2 and height L=0.82 mm (i.e. 4.1 μl), this amounts to about 12 800 deposited platelets.
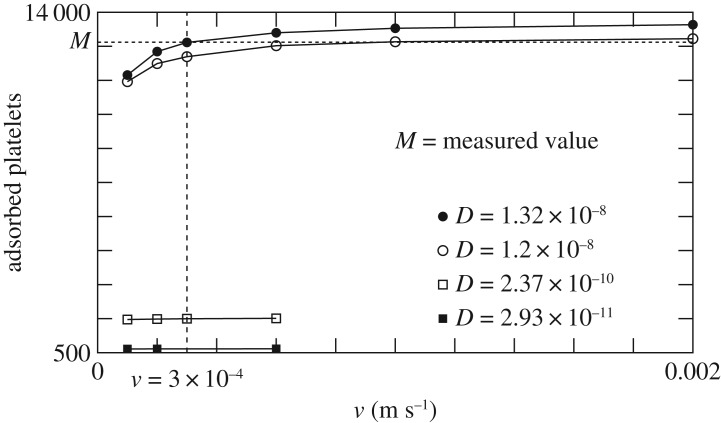
To determine D, we take the smallest value compatible with the observed depletion of platelets from the bulk within the first 20 s, assuming that all platelets hitting the surface adhere. This problem is solved with a particle-based diffusion–deposition model. The experimentally determined number of particles in a column of section ΔS=5 (μm)2 and height L=0.82 mm are randomly distributed in space. Then they undergo a discrete-time (but continuous-space) random walk: at every time step Δt each particle randomly changes its velocity to ±v and moves accordingly. Particles that cross the line z=0 are removed. Those reaching z=L are bounced back from were they came. Using D=v2Δt/2, we can choose Δt as a function of D and explore the deposition count after 20 s for different v and D, as illustrated in figure 4.
Figure 4.
Number of particles adsorbed after 20 s, in the random walk model.
The typical value of v is based on two-dimensional simulations of a bloodflow subject to a shear rate of 100 s−1 and hematocrit of 40%, with fully resolved RBC and platelets (see [22,23] for details of the model used for these simulations). The measured velocity distribution of platelets is shown in figure 5 and the order of magnitude of v is chosen as the standard deviation.
Figure 5.
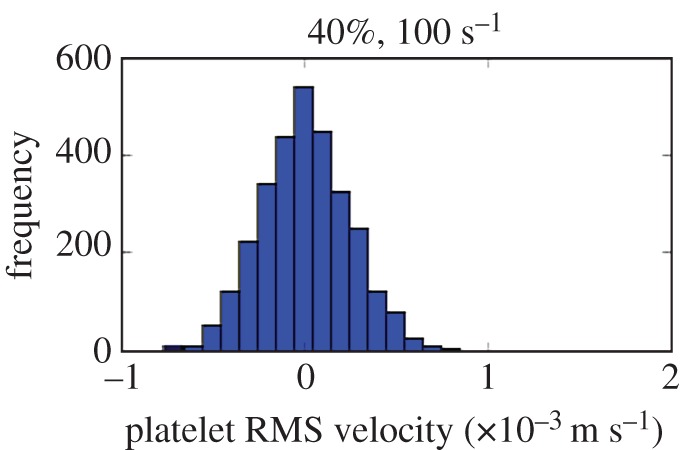
Platelet velocity distribution in a two-dimensional blood shear flow, with fully resolved RBC and platelets.
From figure 4, we conclude that to match the experiment, assuming a perfect adsorption, the diffusion coefficient D is required to be D≥1.2×10⁻⁸. The published value D≈5×10⁻¹¹ m2 s−1 for and hematocrit of 40% is clearly too small to explain the observed deposition rate, independently of a precise choice of v.
In the following, we chose D=1.3×10⁻⁸ m2 s−1, corresponding to the molecular velocity v=3×10⁻⁴ m s−1, as obtained from the fully resolved simulation of platelets and RBC shown in figure 5. Possible explanations for this unexpected value of the diffusion coefficient will be further discussed below.
The discrete-time, continuous-space random-walk model can also be used to determine Δz, the thickness of boundary layer that is needed to properly implement the diffusion–deposition process. We varied Δz in the system of equations (4.1) and (4.2) so as to match the density profile with that of the random-walk model, with several values of deposition probabilities. These numerical investigations show that Δz=2×10⁻⁵ m produces a good agreement between the continuous and discrete models.
5. Results and discussion
The above model for adhesion and aggregation of platelets, including the presence of albumin, has been run for 5 min of physical time, with D=1.3×10⁻⁸ m2 s−1 and Δz=2×10⁻⁵ m. We checked the independence of the result with respect to spatial and temporal discretization of the one-dimensional diffusion models, which is not obeyed if the boundary layer Δz is omitted.
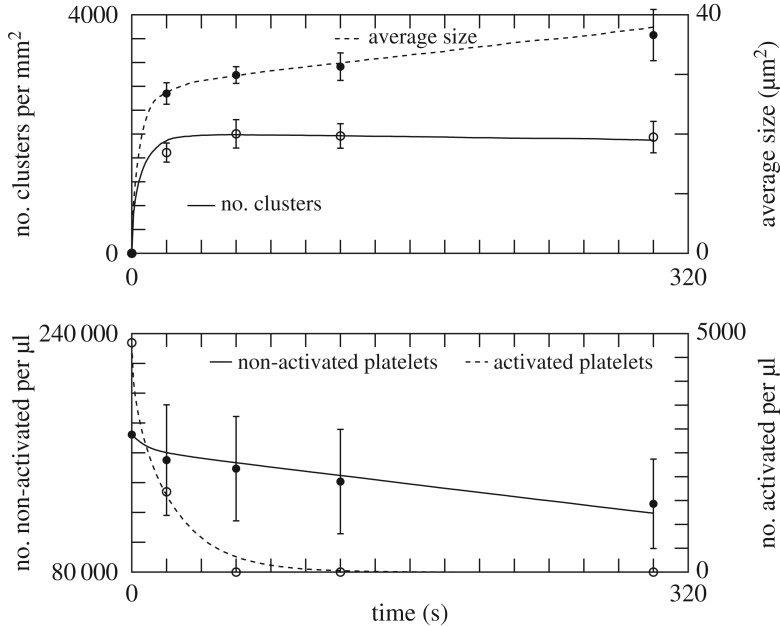
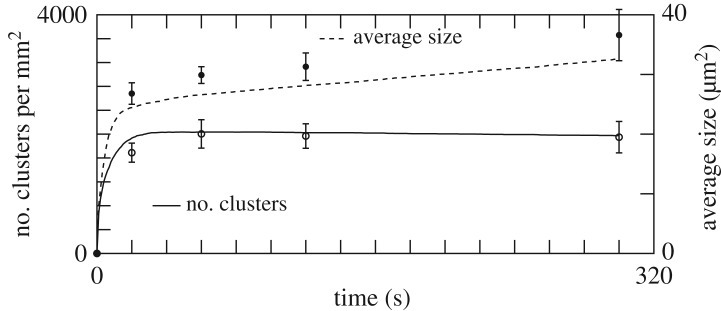
Table 1 reports the values of pal, padh, λ, pagg and ptop, obtained by exploring parameter space, that produce an optimal agreement with experiment, as depicted in figure 6. Changing the value of these parameters affects the quality of the results, as illustrated in figure 7. The effect on the deposition pattern of removing albumin is illustrated in the electronic supplementary material, figure S6.
Table 1.
The parameters of the model found to provide the best fit of the experimental data (figure 6), for and a polystyrene coating.
| padh (s−1) | pagg (s−1) | pal (s−1) | ptop (s−1) | λ (μm2) |
|---|---|---|---|---|
| 110 | 14.6 | 1.7×10⁻³ | 0.6 | 30 |
Figure 6.
The result of the adhesion and aggregation model (continuous and dashed lines) and the experimental data (points). The parameters used in the simulation are given in table 1.
Figure 7.
Same as figure 6, but with padd=120 s−1 and pagg= 14 s−1. The size of the aggregates is very sensitive to this reduction of pagg. The curves describing the time evolution of the number of pre-activated or non-activated platelets are very similar to those of figure 6, and not repeated here.
The high value of padh suggests that adhesion is diffusion-limited, whereas aggregation is reaction-limited. Figure 1b shows the simulated deposition pattern after 5 min. Figure 6 shows that our model reproduces quantitatively the in vitro measurements, thus confirming the proposed scenario of deposition and aggregation, and the competition with albumin. Note that the values in table 1 are expected to depend on the shear rate and the nature of the substrate. Such a dependence was indeed observed by Shenkman et al. [24] when changing the composition of the deposition surface with, for instance, a fibrinogen or a von Willebrand factor (vWF) coating.
In our experimental set-up, several substrates were used to coat the polystyrene surface. The use of extracellular matrix (laminin, fibronectin, collagen IV) interfered with the number of platelet aggregates formed and their average size, but without altering the qualitative behaviour (see electronic supplementary material, figure S7). We performed also complementary experiments to address the role of major platelet receptors, such as GPIb and IIb/IIIa, in our experimental conditions (see electronic supplementary material, figure 8). As expected, the Impact-R experiments confirmed the dominant role of receptor IIb/IIIa at low shear rate and of GPIb at high shear rate. The role of blood vWF was found to be important only at high shear rate (see electronic supplementary material, figure 9). Moreover, we also observed that our model responds to the adenosine diphosphate supplementation (see electronic supplementary material, figure 10). This is in agreement with a previous work reported in [25].
Figure 8.
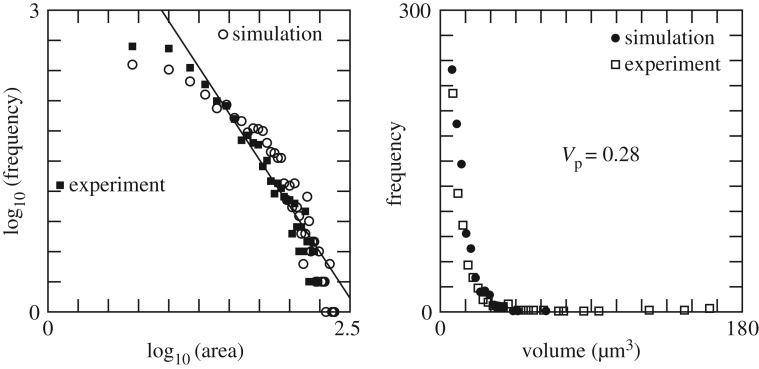
(a) Distribution of the size of clusters at t=300 s. The area is given in square micrometres. (b) Distribution of cluster volumes at t= 300 s. The data suggest a power law with exponent −2.8. Simulation parameters are given in table 1.
To further test the model against the experiment, we compared the distribution of sizes s and volumes of the clusters measured by digital holographic microscopy (figure 8). The size distribution from the simulation matches very well that of the experiment, at 20 s (data not shown) and 300 s. The log–log plot suggests a power law distribution p(s,t)=α(t)s−β(t), with β(20 s)=2.23 and β(300 s)=1.84.
From the simulation, one obtains the distribution of the number of particles per cluster, including those that piled up along the z-axis. Assigning a volume of V p=0.28 (μm)3 to each aggregated platelet leads to a volume distribution compatible with the in vitro measurements (figure 8b). This volume is smaller than the volume of a platelet in suspension (6 (μm)3) because, as indicated by observations with a holographic microscope [18], platelets lose a significant part of their volume during deposition. Our selected value of V p also yields a match between the experimentally measured total volume V tot=1 701272 (μm)3 of deposited aggregates and the total numerical number Ntot=6 032 000 of deposited platelets.
This study has revealed unexpected phenomena in the adhesion–aggregation processes of platelets, namely the competition with albumin and the different roles played by activated and non-activated platelets. By adhesion, activated platelets initiate a new cluster which mostly grows due to the non-activated platelets. By analysing the three-dimensional structures of the aggregates, we could obtain the distribution of areas and volumes. By tuning the model parameters so as to fit the in vitro time observations, the adhesion and aggregation rates can be measured. The excellent agreement between the model and the experiment gives a strong credit to the plausibility of the proposed scenario.
Our study has also revealed that the Zydney-Colton shear induced diffusion coefficient is significantly too small to explain the observed deposition rate. It is well known that the transport of RBC and platelets in a shear flow is a very complex phenomenon [20], and not yet fully understood. For instance, Kumar & Graham and Eckstein & Belgacem [20,26] report that the flux of platelets is better described with a drift-diffusion model J=−D grad ρ−ρ grad Φ, where Φ is called the ‘rheological potential’, describing the collision of platelets with an inhomogeneous distribution of RBC. However, the precise expression for Φ is still to be derived. We are currently working on this problem, using the fully resolved bloodflow simulations developed in [22,23]. Preliminary results in a two-dimensional simulation [27] have shown a very fast initial migration of the platelets towards the vessel wall, in a time scale incompatible with a pure diffusion process with Zydney–Colton diffusion coefficient. Interestingly however, the thickness of the platelet margination layer that forms next to the wall would be compatible with the experimentally observed flux of platelets assuming the Zydney–Colton diffusion coefficient.
With the current lack of a better understanding, it is interesting to notice that the effective diffusion coefficient we obtained in this study in order to explain the observed deposition rate gives a very good account of the dynamics of the whole deposition process.
Strictly speaking, the above results apply to the present experimental setting. But due to the general concepts we have used, both for the model and the experiment, we expect them to be qualitatively correct in other situations relevant to biomedical science.
Supplementary Material
Acknowledgements
We acknowledge support from the European FP7-VPH THROMBUS project and from CADMOS.
Ethics
This study conforms with the Declaration of Helsinki and its protocol was approved by the Ethics Committee of ‘CHU de Charleroi’ (comité d’éthique OM008). All volunteers gave their written informed consent.
Data accessibility
Our C++ simulation code is available at http://cui.unige.ch/~chopard/RSOS/ together with explanations on how to run it. All the experimental data relevant to this work are presented in the paper or the electronic supplementary material.
Authors' contributions
B.C. conceived the numerical model, wrote the code, performed the numerical simulations and analysed the results, and drafted the manuscript. D.R.d.S. performed the experimental work on the Impact-R. J.L. discussed the hypotheses of the numerical model and the results, and worked on the manuscript. L.M. designed and implemented the two-dimensional blood flow model with fully resolved red blood cells and platelets, did the simulation of the diffusion of platelets in shear flow of red blood cells to determine the RMS velocity of the platelets. F.D. and C.Y. conceived the experimental device to measure the three-dimensional properties of the platelet aggregates. P.V.A. brought theoretical ideas and revised the manuscript. O.E. brought the clinical expertise and contributed to the interpretation of the results. L.V. and D.P.-M. performed the scanning electron microscopy observations. G.C. performed the image processing. E.L. designed the blood flow model with fully resolved red blood cells and platelets, interpretation of the simulation of the diffusion of platelets in shear flow of red blood cells. A.G.H. worked on the design of model for fully resolved red blood cell and platelets and contributed to the theoretical discussions of the anomalous diffusion of platelets in shear flow of red blood cells. K.Z.B. designed the experiments, supervised all measurements, developed the theoretical ideas to describe the deposition process and wrote parts of the manuscript.
Competing interests
We declare we have no competing interests.
Funding
This project was funded by the FP7-ICT-2009-6, VPH THROMBUS project A quantitative model of thrombosis in intracranial aneurysms, grant agreement 269966 (http://www.thrombus-vph.eu/). The rest of the funding was provided by the institution of each author.
References
- 1.Franco A, Corken A, Ware J. 2015. Platelets at the interface of thrombosis, inflammation, and cancer. Blood 126, 582–588. (doi:10.1182/blood-2014-08-531582) [DOI] [PMC free article] [PubMed] [Google Scholar]
- 2.Barr JD, Chauhan AK, Schaeffer GV, Hansen JK, Motto DG. 2013. Red blood cells mediate the onset of thrombosis in the ferric chloride murine model. Blood 121, 3733–3741. (doi:10.1182/blood-2012-11-468983) [DOI] [PMC free article] [PubMed] [Google Scholar]
- 3.McCarty OJT. et al. 2005. Rac1 is essential for platelet lamellipodia formation and aggregate stability under flow. J. Biol. Chem. 280, 39474–39484. (doi:10.1074/jbc.M504672200) [DOI] [PMC free article] [PubMed] [Google Scholar]
- 4.Patel S. et al. 2012. The cell motility modulator Slit2 is a potent inhibitor of platelet function. Circulation 126, 1385–1395. (doi:10.1161/CIRCULATIONAHA.112.105452) [DOI] [PubMed] [Google Scholar]
- 5.Fogelson A, Neeves K. 2015. Fluid mechanics of blood clot formation. Annu. Rev. Fluid. Mech. 47, 377–403. (doi:10.1146/annurev-fluid-010814-014513) [DOI] [PMC free article] [PubMed] [Google Scholar]
- 6.Shimizu M, Kohara S, Yamamoto M, Ando Y, Haida M, Shinohara Y. 2006. Significant relationship between platelet activation and intra-media thickness of the carotid artery in patients with ischemic cerebrovascular disease. Thromb. Res. 117, 647–52. (doi:10.1016/j.thromres.2005.05.009) [DOI] [PubMed] [Google Scholar]
- 7.Tosenberger A, Ataullakhanov F, Bessonov N, Panteleev M, Tokarev A, Volpert V. 2013. Modelling of thrombus growth in flow with a DPD-PDE method. J. Theor. Biol. 337, 30–41. (doi:10.1016/j.jtbi.2013.07.023) [DOI] [PubMed] [Google Scholar]
- 8.Maxwell MJ, Westein E, Nesbitt WS, Giuliano S, Dopheide SM, Jackson SP. 2007. Identification of a 2-stage platelet aggregation process mediating shear-dependent thrombus formation. Blood 109, 566–576. (doi:10.1182/blood-2006-07-028282) [DOI] [PubMed] [Google Scholar]
- 9.Remuzzi A, Boccardo P. 1993. Albumin treatment reduces in vitro platelet deposition to PMMA dialysis membrane. Int. J. Artif. Organs 16, 128–131. [PubMed] [Google Scholar]
- 10.Fontaine E, Warwick R, Poullis PSM. 2009. Effect of foreign surface pacification with albumin, aprotinin, propofol, and high-density lipoprotein. J. Extra Corpor. Technol. 41, 3–9. [PMC free article] [PubMed] [Google Scholar]
- 11.Shenkman S, Einav Y, Salomon O, Varon D, Savion N. 2008. Testing agonist-induced platelet aggregation by the Impact-R [Cone and plate(let) analyzer (CPA)]. Platelets 19, 440–446. (doi:10.1080/09537100802082256) [DOI] [PubMed] [Google Scholar]
- 12.de Sousa DR. et al. 2015. Determination of a shear rate threshold for thrombus formation in intracranial aneurysms. J. NeuroInterventional Surg. 8, 853–858. (doi:10.1136/neurintsurg-2015-011737) [DOI] [PubMed] [Google Scholar]
- 13.Malaspinas O. et al. 2016. A spatio-temporal model for spontaneous thrombus formation in cerebral aneurysms. J. Theor. Biol. 394, 68–76. (doi:10.1016/j.jtbi.2015.12.022) [DOI] [PubMed] [Google Scholar]
- 14.Shankaran H, Neelamegham S. 2001. Nonlinear flow affects hydrodynamic forces and neutrophil adhesion rates in cone–plate viscometers. Biophys. J. 80, 2631–2648. (doi:10.1016/S0006-3495(01)76233-9) [DOI] [PMC free article] [PubMed] [Google Scholar]
- 15.Wijeratne SS. et al. 2013. Mechanical activation of a multimeric adhesive protein through domain conformational change. Phys. Rev. Lett. 110, 108102 (doi:10.1103/PhysRevLett.110.108102) [DOI] [PMC free article] [PubMed] [Google Scholar]
- 16.Tokarev A, Butylin A, Atauliakhanov F. 2011. Platelet adhesion from shear blood flow is controlled by near-wall rebounding collisions with erythrocytes. Biophys. J. 100, 799–808. (doi:10.1016/j.bpj.2010.12.3740) [DOI] [PMC free article] [PubMed] [Google Scholar]
- 17.Affeld K, Goubergrits L, Watanabe N, Kertzscher U. 2013. Numerical and experimental evaluation of platelet deposition to collagen coated surface at low shear rates. J. Biomech. 46, 430–436. (doi:10.1016/j.jbiomech.2012.10.030) [DOI] [PubMed] [Google Scholar]
- 18.Boudejltia KZ, de Sousa DR, Uzureau P, Yourassowsky C, Perez-Morga D, Courbebaisse G, Chopard B, Dubois F. 2015. Quantitative analysis of platelets aggregates in 3D by digital holographic microscopy. Biomed. Opt. Express 6, 3556–3563. (doi:10.1364/BOE.6.003556) [DOI] [PMC free article] [PubMed] [Google Scholar]
- 19.Sharma N, Mohammad S, Chuang H, Mason R. 1981. Albumin-IgG complexes in human serum and plasma that inhibit blood platelet adhesion. Proc. Natl Acad. Sci. USA 78, 7750–7753. (doi:10.1073/pnas.78.12.7750) [DOI] [PMC free article] [PubMed] [Google Scholar]
- 20.Kumar A, Graham MD. 2012. Margination and segregation in confined flows of blood and other multicomponent suspensions. Soft Matter 8, 10536–10548. (doi:10.1039/c2sm25943e) [DOI] [PubMed] [Google Scholar]
- 21.Mehrabadi M, Ku DN, Aidun CK. 2015. A continuum model for platelet transport in flowing blood based on direct numerical simulations of cellular blood flow. Ann. Biomed. Eng. 43, 1410–1421. (doi:10.1007/s10439-014-1168-4) [DOI] [PubMed] [Google Scholar]
- 22.Mountrakis L, Lorenz E, Hoekstra AG. 2013. Where do the platelets go? A simulation study of fully resolved blood flow through aneurysmal vessels. Interface Focus 3, 20120089 (doi:10.1098/rsfs.2012.0089) [DOI] [PMC free article] [PubMed] [Google Scholar]
- 23.Mountrakis L, Lorenz E, Malaspinas O, Alowayyed S, Chopard B, Hoekstra A. 2015. Parallel performance of an IB-LBM suspension simulation framework. J. Comput. Sci. 9, 45–50. (doi:10.1016/j.jocs.2015.04.006) [Google Scholar]
- 24.Shenkman B, Savion N, Dardik R, Tamarin I, Varon D. 2000. Testing of platelet deposition on polystyrene surface under flow conditions by the cone and plate(let) analyzer. Thromb. Res. 99, 353–361. (doi:10.1016/S0049-3848(00)00255-3) [DOI] [PubMed] [Google Scholar]
- 25.Shenkman B, Tamarin I, Dardik R, Frojmovic M, Varon D. 2001. Transient adhesion refractoriness of circulating platelets under shear stress: the role of partial activation and microaggregate formation by suboptimal ADP concentration. Br. J. Haematol. 112, 1055–1061. (doi:10.1046/j.1365-2141.2001.02657.x) [DOI] [PubMed] [Google Scholar]
- 26.Eckstein EC, Belgacem F. 1991. Model of platelet transport in flowing blood with drift and diffusion terms. Biophys. J. 60, 53–69. (doi:10.1016/S0006-3495(91)82030-6) [DOI] [PMC free article] [PubMed] [Google Scholar]
- 27.Pleunis Z. 2014. Shear-induced transport of platelets in a red blood cell suspension. Bachelor Project 10001615, University of Amsterdam, Computational Science Amsterdam, The Netherlands.
Associated Data
This section collects any data citations, data availability statements, or supplementary materials included in this article.
Supplementary Materials
Data Availability Statement
Our C++ simulation code is available at http://cui.unige.ch/~chopard/RSOS/ together with explanations on how to run it. All the experimental data relevant to this work are presented in the paper or the electronic supplementary material.


